Research & Reviews: Journal of Material Sciences
ISSN:2321-6212
ISSN:2321-6212
1School of Civil Engineer, Henan Polytechnic University, Jiaozuo 454003, P.R.China
2School of Emergency Management, Henan Polytechnic University, Jiaozuo 454003, P.R.China
Received Date: Sep 29, 2017; Accepted Date: Oct 24, 2017; Published Date: Oct 30, 2017
Copyright: © 2017 Wang C, et al. This is an open-access article distributed under the terms of the Creative Commons Attribution License, which permits unrestricted use, distribution, and reproduction in any medium, provided the original author and source are credited.
DOI: 10.4172/2321-6212.1000200
Visit for more related articles at Research & Reviews: Journal of Material Sciences
The new and diversified urban smart growth model, has been gradually developed and accepted by people around the world. First of all, according to the scientific, systematic and comparable design principles, the author establishes the urban growth intelligibility evaluation system composed of four subsystems, such as urban growth intensity, urban land growth efficiency, urban livable level and urban growth structure. Then, we use the improved entropy value method to carry out dimensionless processing on each index, and then determine the weight of each index. Finally, the evaluation system is used to quantitatively evaluate and analyze the degree of smart growth in Wuhou District of Chengdu, and then putting forward the development plan to guide its growth towards smart.
Urban smart growth, Improved entropy method, Quantitative assessment, Evaluation system
At present, the urban development model is facing many difficulties, the phenomenon of urban sprawl continues to emerge. A new and diversified urban smart growth model [1] has been gradually developed and accepted by people around the world. Urban smart growth is aimed at solving the problems in the process of urban development in order to promote the development of the city, and make the urban land more scientific, compact and efficient [2]. This model was first proposed by Grand Daning, Governor of Maryland, USA in 1997, the original intention is to establish a state government to guide the means of urban development, and government spending on urban development have a positive impact to some extent ease the problem of urbanization in the suburbs of the United States [3].
Given the planned objectives of long-term sustainable and stable development, many cities are implementing initial plans to move towards smart growth [4-6]. Given the planned objectives of long-term sustainable and stable development, many cities are implementing initial plans to move towards smart growth. Smart growth focuses on urban construction, with particular emphasis on the overall development of the city: economic prosperity, social equality, and environmental sustainability. For now, this task is more important than ever because the world is rapidly urbanizing. It is estimated that by 2050, the urban population will reach 66% of the world's total population, which means that 2.5 billion people will take part in the world's urban population [7,8]. As a result, urban construction is becoming increasingly important and increasingly necessary to ensure that people have social equality and sustainable development of their homes, resources and job opportunities [9].
Smart growth is an urban planning theory that originated in 1990’s as a means to curb continued urban sprawl and reduce the loss of farmland surrounding urban centers [10].
There are ten principles for urban smart growth. Mix land uses; Take advantage of compact building design; Create a range of housing opportunities and choices; Create walk able neighborhoods; Foster distinctive, attractive communities with a strong sense of place; Preserve open space, farmland, natural beauty, and critical environmental areas; Strengthen and direct development towards existing communities; Provide a variety of transportation choices; Make development decisions predictable, fair, and cost effective; Encourage community and stakeholder collaboration in development decisions.
These broad principles must be tailored to a community’s unique needs to be effective [11]. Thus, any measure of success must incorporate the demographics, growth needs, and geographical conditions of a city as well as the goal to adhere to the three E’s [12].
So far, many scholars have put forward their own research methods for quantitative evaluation of urban smart growth, these methods are summarized as follows: Analytic hierarchy process, Gray relational analysis, Ecological footprint model and Entropy method. The entropy method in the case of extreme or negative value of the case is inadequate [13]. Therefore, on the basis of the existing research results, the author makes some improvements to the entropy method, and takes the Wuhou District of Chengdu as the research object, carrying out quantitative assessment and analysis of the degree of urban smart growth in order to provide information for the relevant government units to develop information to help, while enriching the quantitative growth of quantitative assessment methods [12].
The Principle of Constructing Evaluation Index System
Based on the theory of smart growth: Smart growth as a trend of development of foreign countries, it is worth learning from China and other developing countriesThe three goals of smart growth-Economic Prosperity, Social Equity and Environmental Sustainability are important parts of building a smart city [14].
Construction principles of evaluation system: The establishment of a city's smart growth assessment system requires comply with systematic principles, scientific principle and comparability principle
Urban smart growth depends on the state of the various elements within the city system, isolated to grasping a single index the effect is very limited, focusing on the system as a whole, in order to obtain a good integrated function. This is also one of the starting points for the selection of indexes of the city's smart growth evaluation index system.
The selected indexes need to be able to scientifically and comprehensively reflect the connotation of city’s integrated environment.
For each index can be in different nature, different regions of the city to compare. As far as possible to choose the relative value, the average value as an evaluation index.
The process of evaluation system: Based on the concept of smart growth, this paper selects four evaluation indexes: urban growth intensity, urban land use growth efficiency, urban livable level and urban growth structure, so as to establish the urban smart growth evaluation system. It is as shown in the Table 1. The urban smart growth success rate evaluation process is as shown in the Figure 1.

Figure 1: The process of evaluation system.
Table 1. Urban smart growth evaluation index system.
| First grade Indexes | Secondary grade indexes | Third grade indexes | Responses to ten principles | Notes |
|---|---|---|---|---|
| Urban Smart Growth Index(A) | Urban land growth intensity(B1) | Urban population expansion coefficient(C1) | 1 | a11/a2 |
| Urban economic expansion coefficient(C2) | 10 | a11/a7 | ||
| Urban population residence rate(C3) | 3, 6 | a3/a9 | ||
| Urban land growth efficiency(B2) | Urban Land Average Output(C4) | 2 | a5/a9 | |
| Urban Land Average Financial Revenue(C5) | 7 | a6/a9 | ||
| Urban Land Average employment(C6) | 10 | a4/a9 | ||
| Livable level of urban growth(B3) | Urban per capita road area(C7) | 8 | a10/a1 | |
| Urban per capita public transport vehicles(C8) | 8 | a12/a1 | ||
| Urban green coverage rate(C9) | 5,6 | a13/a8 | ||
| Urban Per Capita Public Book(C10) | 7 | a14/a1 | ||
| Urban air quality rate(C11) | 6 | AQI | ||
| Urban land use structure(B4) | Land use proportion(C12) | 2 | - | |
| Urban structural integrity(C13) | 5 | - |
Selection of Evaluation Index
In this paper, the construction of the evaluation index system mainly refers to the "smart growth" ten principles, LEEDND (LEED for Neighborhood Development Rating System) and the WHO's health community evaluation index [15].
Urban growth intensity: Because the urban growth research carried out by the author itself is a dynamic change process, it is not appropriate to use static absolute variables in the selection of urban growth intensity index factors, but rather to use the relative index of two-variable ratio, of the indexes are relatively comparable. We try to use three influencing factors to measure the intensity of urban growth [16]. The static index selection results are as shown in the Table 2.
Table 2. Static index selection.
| Index | Impact factor |
|---|---|
| a1 | Number of urban population |
| a2 | Urban population growth rate |
| a3 | Urban non-agricultural population |
| a4 | Urban employment |
| a5 | Urban GDP |
| a6 | City revenues |
| a7 | Urban economic growth |
| a8 | Urban built-up area |
| a9 | Urban construction land |
| a10 | Road length |
| a11 | Urban land use growth |
| a12 | Standard bus number |
| a13 | Urban green coverage area |
| a14 | Public library |
For different cities, the city size and population are not the same, so the author uses the city expansion coefficient as a measure of the total amount of urban growth indexes. The urban expansion coefficient is calculated as the ratio of urban land growth rate to urban population growth rate. The standard value is generally adopted as the international critical standard with urban expansion coefficient of 1.12. When the city expansion coefficient is greater than 1.12, the city's urban expansion is fast, the urban growth of land for the extensive use; when the city expansion coefficient is less than 1.12, the total urban growth is smart growth, urban growth for the conservation of land use.
As an increasingly important factor in economic activities, land is becoming more and more important to economic development. It is helpful to evaluate the efficiency of urban land use in an objective and comprehensive way. Increasing the urban economic expansion coefficient indexes, is conducive to reflect the economic growth brought about by the growth of urban construction land, making the city a more comprehensive evaluation of the intensity of growth.
The city floor area ratio refers to the ratio of the total urban construction area to the urban construction land area. The floor area ratio is an important index of the intensity of construction land use. It is determined by economic level, environmental conditions and national policies. It can affect land price and affect land development income and is directly related to the comfort of living in a reasonable urban space environment, The greater the city floor area ratio, indicating that the higher the intensity of urban growth, and vice versa.
Urban land use efficiency: The change of urban land use efficiency mainly involves the economic output of urban land area, which is an important index to measure whether the urban construction land is efficient [17]. The evaluation of urban land use efficiency of the selection of urban land area, local fiscal revenue and other urban land productivity indexes. Urban land productivity is the main criterion for judging the efficiency of urban growth. The higher the total amount of land produced by unit land, the higher the degree of intensive land use, the better the urban growth benefit and vice versa [18]. In addition, the employment situation as an increasingly important goal of urban development, is an important factor in measuring the quality of urban growth, the author of urban land employment indexes as a measure of urban land growth efficiency of the important indexes used to measure the growth of urban land Benefit changes.
City livable level: The livable level of urban growth refers to the improvement of the city's service facilities with the growth of urban land. It is difficult to measure the level of urban social construction by using quantitative indexes to measure accurately, but we can measure the level of urban social construction by comparing the degree of social facilities in urban growth. The paper uses the indexes of urban per capita road area, the number of public transport vehicles per capita, the amount of public books per capita, and the greening coverage rate of the built area to measure the urban livable level.
Urban per capita road area is reflected in the city with the expansion of urban road construction progress and enhance the situation, to a large extent determine the efficiency of urban production and life; and urban per capita bus number to a certain extent reflects a The city with the growth of the city government attach importance to the degree of priority of public transport, but also the international measure of a city urban growth is reflected in the environment low consumption, low carbon, energy saving the main indexes; urban built area green coverage indexes reflect the city with the growth of the city The degree of the construction and improvement of the greening environment reflects the situation of the urban green space environment construction. The number of the books that the city has per capita objectively reflects the level of the enjoyment of the basic services of the urban public culture, which is an important index of the city's smart growth. Air quality and good rate reflects the quality of the city's air a year, but also reflects the city life comfort an important index.
Determination of Index Weight by Entropy Method
After the data are processed by the extreme method, the entropy method is used to determine the weight of the data. According to the characteristics of entropy, we can judge the discrete degree of a certain index by the entropy value, the greater the degree of the discrete index, the greater the impact of the index on the comprehensive evaluation. The following steps are required to determine the weight of the index by the entropy method.
There are seven main steps in the comprehensive evaluation of urban smart growth with improved entropy method.
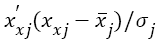
Step one: as the different indexes have different dimensions and units, in order to eliminate the differences in dimension and dimension units of non-commensurability, so the evaluation index should be first dimensionless processing, that is, the same degree of quantification. There are different approaches to different types of indexes, as described in the literature. We use the same degree of quantification approach is as follows
 (1)
(1)
where  is the index value after quantization;
  is the average of the j index; is the standard deviation of the j
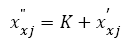
index.Step two: to eliminate negative values, pan the coordinates. The index
is the average of the j index; is the standard deviation of the j
index.Step two: to eliminate negative values, pan the coordinates. The index  becomes
  after the coordinate
translation.
after the coordinate
translation.
Among them:
 (2)
(2)
Where K is the magnitude of the coordinate translation.
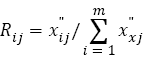
Step three: calculate the proportion Rij of index  , among them:
 (3)
(3)
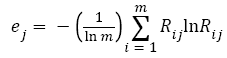
Step four: calculate ej the entropy of the index of item j
 (4)
(4)
can prove: ej∈[0,1].
Step five: calculate the difference coefficient gj of item j. The formula is gj=1-ej, when the value of gj is larger, the importance of xj index in the comprehensive evaluation is stronger.
Step six: calculate the weight B of the index A and calculate the formula is:
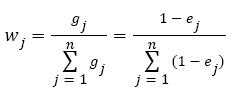 (5)
(5)
Where j=1,2,…,n
Finally, use the formula 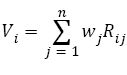 to calculate Vi the city's smart growth capacity in year i.
Urban Smart Growth Degree Evaluation System
For selected cities, data collection and normalization are performed for each index. Based on the weight of each index, we can synthesize 17 factors into 13 third-level indexes and further synthesize 4 second-level indexes. Finally, we can get the general index of the "smart growth" degree of each city, so we can list the following formula:
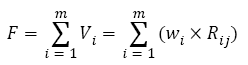 (6)
(6)
Where F is the general index of the sample city's smart growth degree; wi is the weight of the i index; and Rij is the value of the i index of the city.
Analysis on the Degree of Smart Growth in Chengdu City
Wuhou District is located in the southwest of Chengdu, has a long history and rich cultural resources. To the end of 2015 Wuhou total population reached 0.54 million, the natural population growth rate of 0.994%; land area of 122 km2, of which 4.72 km2 of arable land; Wuhou District annual GDP of 79.51 billion RMB, Including industrial output value of 12.8 billion RMB.
The Development of Wuhou District from 2011 to 2015
The economic development statistics of Wuhou District are as follows:
From 2011 to 2015, Wuhou District to achieve steady economic growth. By the end of 2014, the region's GDP reached 73.93 billion RMB, an increase of 55.8% over the end of 2010; the per capita GDP reached 68 thousand RMB, equivalent to 11 thousand dollars, ranking in the forefront of the central city.
The level of urbanization statistics of Wuhou District are as follows.
Urbanization and urban growth are closely related. It is the inevitable trend of human social development and objective laws. This paper will use the urban non-agricultural population in the proportion of the total population to measure the level of urbanization. Through the development trend of urbanization level, so as to explore the urban growth trend and development direction closely related to it.
The urbanization rate of Wuhou District (the proportion of non-agricultural population) was divided by 2000. In the period of 1990-2000, the Wuhou urbanization rate increased by an average of 1.48%, and in 2000-2008 this rate was also maintained at 1.27 percentage points. The annual GDP and urbanization rate of Wuhou District from 2011 to 2015 are as shown in the Figure 2.

Figure 2: The annual GDP and urbanization rate of Wuhou District from 2011 to 2015.
The built-up area and cultivated land area statistics of Wuhou District are as follows:
The process of urban space expansion is also a process of improving the area of built-up area and the area of occupied cultivated land. The increase in urbanization and the expansion of urban metropolitan areas are still at the expense of a sharp decline in cultivated land area. As the "Chengdu Statistical Yearbook" statistics on the calendar year in the city area of arable land are scattered and not complete, it cannot effectively reflect the changes in Wuhou District. Therefore, the cultivated land area data are used in the city's statistical data (including municipal districts and counties under the jurisdiction of, while the built-up area is using the statistical data of municipal districts. Although the statistical standards of the two are different, there are some errors in contrastive analysis and trend change, but they do not affect the overall contrast effect and the overall situation. The built-up area and cultivated land area of Wuhou District from 2011 to 2015 are as shown in the Figure 3.

Figure 3: The built-up area and cultivated land area of Wuhou District.
Exponential Analysis on the Smart Growth of Wuhou District
The three indicators of the Wuhou District of smart growth data from 2011 to 2015 are as shown in the Table 3.
Table 3. Three indexes on the Wuhou District smart growth from 2011 to 2015.
| Indexes | Unite | 2011 | 2012 | 2013 | 2014 | 2015 |
|---|---|---|---|---|---|---|
| Coefficient of expansion of the urban population (C1) | - | 3.6 | 3.75 | 3.9 | 4.05 | 4.21 |
| Urban economic expansion coefficient (C2) | - | 3.16 | 4.15 | 5.86 | 9.51 | 22.49 |
| Rate of urban population (C3) | ten thousand people/km2 | 69.39 | 70.2 | 71.06 | 71.95 | 72.88 |
| Output per area (C4) | 0.1 billion RMB/km2 | 1075.63 | 1077.68 | 1079.82 | 1082.06 | 1084.41 |
| City area revenue (C5) | 0.1 billion RMB/km2 | 260.44 | 257.11 | 253.64 | 250 | 246.19 |
| City area employment (C6) | ten thousand people/km2 | 54.01 | 55.14 | 56.32 | 57.56 | 58.85 |
| Urban per capita area of roads (C7) | km/ten thousand people | 8.65 | 8.52 | 8.39 | 8.26 | 8.13 |
| City buses per capita (C8) | cars/ten thousand people | 12.44 | 12.52 | 12.61 | 12.71 | 12.8 |
| Urban green coverage rate (C9) | - | 8 | 8.1 | 8.21 | 8.33 | 8.45 |
| Urban per capita public library (C10) | books/people | 1.7 | 1.66 | 1.63 | 1.59 | 1.55 |
| Good rate of urban air quality (C11) | - | 0.44 | 0.59 | 0.73 | 0.87 | 1.01 |
| Land use percentage (C12) | - | 0.11 | 0.1 | 0.09 | 0.08 | 0.07 |
| The structural integrity of the city (C13) | - | 0.51 | 0.46 | 0.41 | 0.36 | 0.31 |
Using the entropy method to calculate the above data, the weights of the three indexes are shown in Table 4.
Table 4. The weight of each of the three indexes.
| Index | C1 | C2 | C3 | C4 | C5 | C6 | C7 |
|---|---|---|---|---|---|---|---|
| Weight | 0.3151 | 0.1486 | 0.0469 | 0.0470 | 0.0474 | 0.0468 | 0.0468 |
| Index | C8 | C9 | C10 | C11 | C12 | C13 | |
| Weight | 0.0468 | 0.0468 | 0.0469 | 0.0587 | 0.0517 | 0.0507 |
And then reach the five-year study of the first-level indexes of precision as shown in the Table 5.
Table 5. Wuhou District of urban growth in the smart level indexes.
| Year | 2011 | 2012 | 2013 | 2014 | 2015 |
|---|---|---|---|---|---|
| Smart degrees of increase | 279.93 | 290.92 | 302.33 | 314.14 | 326.34 |
According to the above data, we can see that in the five years of 2011-2015, Wuhou urbanization as a whole is getting higher and higher, it is developing more and more "smart".
As a result of various factors, Wuhou District in different historical periods has different degrees of expansion. Before China's reform and opening up, the main expansion areas of the Wuhou zone were urban areas in the north and west, especially in the southwest. After China's reform and opening up, the Wuhou District spatial expansion mainly concentrated in the interior of the city, and at the same time, it expanded to the south-east area bordering Yuci District.
The population density and employment density of Wuhou District are both large, and the population distribution is more dispersed, has a higher degree of urbanization. But the land use level is low, the contradiction between land supply and demand is prominent, land use structure and layout is not reasonable. In the traffic aspect, for residents of Wuhou District, because the proportion of public transport travel is minimal, leading to its travel structure is extremely unreasonable, and the performance of urban road congestion at the peak of the situation is extremely serious. Although the urban volume rate has been rising in recent years, but the value is truncated; and housing vacancy rate is generally high, a serious backlog of commercial housing, land waste serious.
In order to solve the problems in Wuhou District spatial expansion, we should formulate scientific land use planning, and implement reasonable urban spatial expansion strategy; Strengthen the intensive use of urban land, and promote the compact development of cities; Protect green open space and prevent urban disorder expansion; and advocate TOD development model, vigorously develop the use of urban underground space.
This research was supported by the national natural science foundation of China (41371092) and Henan polytechnic university Foundation (B2015-62).