Keywords
|
| Ant Possibilistic, Fuzzy Logic Rules, Conditional Probabilistic Distribution, Forecasting, Entropy Principle, Stock Investors |
INTRODUCTION
|
| The national economy is highly influenced by the performance in stock trading where enormous amount of capital goods are heavily traded all around the world through the stock market. Also, with high uncertainty involved in the market and governmental policies, prediction of stock price is considered to be one of the significant and challenging tasks. Naive Possibilistic Classifiers (NPC) [1] with uncertain data considered two types of uncertainties using Gaussian Posisbilistic Distribution to deal with imperfect data. However, large changes in the stock exchange market with high dimensional uncertain data had made the stock investors to look for alternative method for effective forecasting of stock data. Sequential Probabilistic Learning for Adaptive Fuzzy Inference System (SPLAFIS) [2] used Bayesian Adaptive Resonance Theory (BART) to reduce the complexity for stock exchange data. But, with large amount of uncertainty, all stock attributes and classes were not on genuine uncertain data. |
| The art of forecasting involves projecting the performances of future on the basis of historic data. An effective method of forecasting helps in the process of making decision and plan accordingly. An integrated approach based on Genetic Fuzzy Systems (GFS) was introduced in [3] for effective forecasting of stock prize by applying Stepwise Regression Analysis (SRA). However, the risk involved was not analyzed. To analyze the risk involved, Data Mining (DM) [4] methods were applied on Tehran Stock Exchange (TSE) data and were efficient in terms of pricing and financial ratio. But the problem of optimization was not achieved. Nonlinear Auto Regressive (NAR) [5] model was introduced to provide better forecasting using K-means algorithm. A hybrid intelligent model [6] was designed to improve the accuracy of forecasting tools by combining genetic fuzzy expert system and data preprocessing. |
| Human reasoning can be computerized using the technique, Artificial Intelligence, (AI) and is considered to be one of the most challenging tasks for predicting time series data. A hybrid model integrating, data preprocessing, genetic algorithms and levenberg-marquardt was introduced in [7] for improving the accuracy involved in predicting time series data. Though, accuracy was improved, the mean error was observed to be high. To reduce the mean square error (MSE), in [8], wavelets with fuzzy logic was introduced for forecasting time series data. The stock market intelligence [9] was analyzed using frequent item set, pattern discovery and sentimental analysis to improve the rate of accuracy. But, the accuracy was observed to reduce based on diversity. A prediction model was designed in [10] to improve the accuracy based on diversity in factor. In this Possibilistic Fuzzy Clustered Forecasting (AP-FCF) method to forecast complex high dimensional uncertain data. |
RELATED WORK
|
| Efficient prediction of stock market for financial analysis not only serves for the short-tem investors but it is also an efficient means for long-term investors too. Principal Component Analysis was applied in [11] with the aid of Support Vector Machine (SVM) for improving the forecasting accuracy. However, pattern sequence was left unaddressed. Approximation and Prediction of Stock Series Data (APSSD) [12] was introduced to identify the pattern sequence to reduce the computational cost using data approximation process. The APSSD method was proved to be efficient in reducing the mean absolute error. However, the matching sequences were not fine tuned. Prototype Generation Classifiers were introduced in [13] for forecasting stock market trend and was proved to be accurate. A hybrid combinatorial method involving clustering and classification was introduced in [14] to improve the rate of value being prediction at early stage using decision tree.In [15], an integration method involving sequential chart pattern, k-means and apriori algorithm was designed for making profit on real market not only for short term investors but also for term investors. |
DESIGN OF ANT POSSIBILISTIC APPROACH USING PREDICTION MINING ON HIGH DIMENSIONAL UNCERTAIN DATA
|
| In this section, a detailed description about the design of ant possibilistic approach using prediction mining on high dimensional uncertain data is provided with the help of a neat architecture diagram. High dimensional uncertain stock data is analyzed and accurate forecasting result is provided to the investor using Ant Possibilistic Fuzzy Clustered Forecasting (AP-FCF) method. The Ant Possibilistic Approach with Conditional Probabilistic Fuzzy Clustered Set Distribution function is developed to increase the profit of the investors. The objective of the AP-FCF method is to develop an efficient prediction mining technique for easy extraction of the information based on the request of the investor. The Possibilistic approach is developed based on the ant procedures. The ant procedure is used for obtaining the intelligent behavior of the system, once the investor’s request about the particular information about stock is provided. The basic operational step of the proposed method is shown in Fig.1. |
| Fig.1 shows the operational step of the proposed AP-FCF method. Maximum Entropy approach is a probabilistic distribution function which is used to forecast the result. With the help of uncertain data and using maximizing entropy, the AP-FCF method obtains the prior knowledge about the stocks and provides them to the investors within the stipulated time period. The distribution function using maximum entropy does not forecast the accurate result. As a result, the forecasting operation is repeated to fetch the precise result using the fuzzy clustered logical set rules or working on high dimension uncertain data (i.e., probabilistic result ‘0’ or ‘1’ is given as the output function). The architecture diagram of Ant Possibilistic Fuzzy Clustered Forecasting (AP-FCF) method is shown in Fig.2. |
| The main contribution of AP-FCP method is the construction of an efficient forecasting system using high dimensional uncertain data. As shown in Fig.2, using high dimensional uncertain data, efficient forecasting of financial data analysis is made. The method, AP-FCF covers wider range of stock data generating processes on different time series. It also allow in stochastically trending mean growth of the attribute and classes. First, the method, AP-FCF employs Maximum Entropy Principle Distribution approach to determine the quantity of stock classes and attributes. Using the quantity determined, second, Conditional Probabilistic Fuzzy Clustered Set Distribution is constructed to forecast set with fuzzy logic rules. The fuzzy set logic principles use the type-2 principles to improve the accuracy rate of forecasting. The accuracy on forecasting improves the stock investors profit rate by analyzing the business model. |
| Finally, prediction mining approach named Ant Possibilistic approach is carried out for effective decision making process. The approach produce optimized result based on the cooperation of the ants (i.e., data). Here, the Ant Rule based Predictive Miner algorithm constructs an efficient predictive rule for effective prediction of investment portfolios for the stock investors. The conditional probabilistic fuzzy clustered set distribution output is produced for the Possibilistic (i.e., predictive mining) operation to be carried out. As a result, the method, AP-FCF can be applied for the technical analysis of stock market with more uncertain high dimensional data. The uncertain stock index data is taken in our research work for producing the Possibilistic result based on the predictive mining. The elaborate description of maximum entropy principle distribution, conditional probabilistic fuzzy clustered set distribution and ant possibilistic approach using ant rule based predictive miner algorithm for effective prediction of stock analysis is provided in the forthcoming sections. |
MAXIMUM ENTROPY PRINCIPLE DISTRIBUTION APPROACH
|
| To start with, the maximum entropy principle distribution approach in AP-FCF divides the high dimensional uncertain data into membership functions. The membership function establishes a threshold value between the attributes and classes. The threshold value in AP-FCF helps to determine the quantity level using the attributes and classes. The quantity of the attributes ‘A’ for uncertain stock data is determined using the formula as given below, |
 (1) (1) |
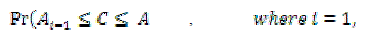
| Attribute quantity ‘ in AP-FCF method is determined using the probabilistic result ‘ where the attribute threshold is measured based on the class ‘ ’ range. Let us assume that the threshold value of the classes lies between the ranges {c1, c2}. Then, the entropy principle based achieves the maximum distribution level described as, |
 (2) (2) |
| From (2), the threshold range of the stock class data holds the maximal entropy principle result with denoting the probabilistic result obtained after determining the quantity of classes in uncertain data obtained from (1). Using APFCF Method is depicted to be zero whenever is zero. The class always ranges from ‘c1’ to ‘c2’ and AP-FCF method always assumes the maximum threshold value for quantity determination. |
CONDITIONAL PROBABILISTIC FUZZY CLUSTERED SET DISTRIBUTION
|
| Once the quantities of classes and attributes are identified using maximum entropy distribution principle, conditional probabilistic fuzzy clustered set distribution is applied to perform efficient forecasting. The conditional probabilistic is used in AP-FCF Method for better forecasting of stock investor based on the presumption set of results. For instance the conditional probability of stock rate is given based on the stability level. |
| The condition is used for forecasting the stock value. The probabilistic result function is shown through the fuzzy clustered logic rules. Conditional probability is produced through the Kolmogorov characterization, where ‘X’ and ‘Y’ are the conditions to be satisfied for forecasting the result. Here, ‘X’ and ‘Y’ condition is applied on the determined class and attribute to attain the forecast mean rate. The forecast mean rate in AP-FCF method is shown in Fig.3. |
| Experiment on Investors Request |
| -Ó Forecast Output to Investors |
| -Δ Forecast Output to Investors |
| Kolmogorov characterization in AP-FCF Method measure the forecast mean rate based on the determined quantity of classes and attributes. If the conditions ‘X’ and ‘Y’ are satisfied based on the investors request query, then accurate forecast result is provided to the investors. |
TYPE-2 FUZZY CLUSTERED LOGIC RULES
|
| Type-2 fuzzy clustered logic distribution function is used in AP-FCF Method to incorporate the membership function into the conditional probabilistic and produce fuzzy clustered set results. Fuzzy set clustered logical rules is implemented to work efficiently on high dimensional uncertain data. Conditional probabilistic with fuzzy clustered set distribution function minimizes the error function and produce the accurate forecasting result. The Type-2 fuzzy clustered logic distribution function is described as, |
 |
| Based on the conditional probabilistic, fuzzy clustered logic distribution function is evaluated in (5). |
| Let us consider for instance, two clusters If the share exchange value of the company is boom at period whereas reached its peak at . Then the stock values of and is included in one cluster. |
| whereas the stock values of and is included in another cluster . Finally, fuzzy clustered rule from (5) is applied on each cluster in order to produce accurate forecasting result. AP-FCF Method takes the ‘ ’ attributes with ‘ ’ class ranges to identify the conditional result. The Type-2 Fuzzy Clustered set based result is then provided to the stock investors with being a condition with ‘ ’ satisfied on all attribute ‘ ’ and is the condition with ‘ ’ satisfied on all attribute ‘ ’. The conditional ‘ ’ and ‘ ’ are measured through all the attributes of the stock data class to produce higher accuracy result. The conditions are combined together using the union operations and produce the fuzzy set results. |
| Ant Rule based Predictive Miner algorithm is described as, |
| Ant_Rule_Predictive_Miner() |
| Input: test set (i.e., Request Condition from Stock Investors), i, k |
| 1: for each test set do |
| 2: Discover Ant Rule List for operation |
| 3: while (Test Set) |
| 4: Ant index the uncertain data |
| 5: if (Ant index = Convergent of Test Set) then |
| 6: repeat |
| 7: Ant rule starts with empty set and constructs Current Ant Predictive Miner rule |
| 8: Update the pheromone of all iterations based on the quantity of the attributes and classes |
| determined |
| 9: Update the convergent set as i=i+1 and k=k+1 |
| 10: Condition applied for all class attributed with same pheromone (i.e., process) |
| 11: Until (no. of stock investor’s conditions = no. of ant rule satisfied) |
| 12: else |
| 13: Fetch the probabilistic result |
| 14: end if |
| 15: end while |
| 16: end for |
| 17: return Ant_Rule_Predictive_Miner(probabilistic result) |
| Output: Opinion Result produced through Possibilistic approach |
| End |
EXPERIMENTAL EVALUATION
|
| To validate the performance of Ant Possibilistic Fuzzy Clustered Forecasting (AP-FCF) method, experiments were conducted using JAVA platform with Weka tool. In this section, the experimental setup and performance of the method is discussed using Dow Jones Index Data Set extracted from UCI repository. The dataset contains weekly data for the Dow Jones Industrial Index and used widely in business applications using Java platform that aids in forecasting the stock information with accurate precision rate. The Jones Industrial Index Dataset consists of 16 attributes with 750 instances. |
| AP-FCF forecast the stock prices using the data collected over certain period of time (i.e., day, week, and month). Each record in the row is data for a week. Every record has the proportion of return stock with subsequent week (percent_change_next_weeks_price) is used for prediction mining in proposed work. The characteristics of the attributes are real and integer values. AP-FCF forecast is used for testing the sample with the proposed work. |
| The proposed work is compared against the existing Naïve Possibilistic Classifiers (NPC) [1] with uncertain data and Sequential Probabilistic Learning for Adaptive Fuzzy Inference Naïve Possibilistic Classifiers (NPC) [1] with uncertain data System (SPLAFIS) [2]. Experiment is conducted on factors such as uncertain data forecasting rate, running time of distribution function, fuzzy clustering accuracy and high dimensional error index on stock data. |
RESULTS ANALYSIS OF AP-FCP METHOD
|
Impact of uncertain data forecasting rate PES
|
| To assess the performance of AP-FCF method and compare it to other systems, namely, Naïve Possibilistic Classifiers (NPC) [1] with uncertain data and Sequential Probabilistic Learning for Adaptive Fuzzy Inference System (SPLAFIS) [2] all three methods were implemented using JAVA with Weka tool. The results on APFCF method are investigated with the small stage information which is obtained from experimental work. |
| As illustrated in Figure 4, the uncertain data forecasting rate decreases for stock data collected using different sample periods. As shown in Fig.4, the graph is not linear which states that the stock value reached its peak during the period 2008 and there was a fall off in 2009 and an increase observed in 2010. The uncertain data forecasting rate is improved using AP-FCF method by 31 – 60 % compared to NPC [1] that helps in better forecasting for the stock investors using the Conditional Probabilistic Fuzzy Clustered Set Distribution. Moreover, by applying conditional probability in APFCF method, the forecast mean rate obtained using the Kolmogorov characterization helps in improving the efficiency of uncertain data forecasting rate by 39 – 76 % compared to SPLAFIS [2]. |
Impact of error index on high dimension stock data
|
| The error index on high dimension stock data using AP-FCF method measures the error rate while predicting the stock price in stock market. The high dimensional error index on stock data using AP-FCF method is obtained using the mean square error which is the ratio of difference between the actual and predicted valued to the actual value. It is measured in terms of percentage (%). |
| Results for the error index on high dimension stock data for different sample periods are shown in Fig.5. The error index during each sample period is observed and in a similar manner, comparison is made with other methods to obtain the error index. The error index is observed to be linearly increased up to 2009. But at periods 2010 and 2011, the error index was not observed to be linear because of the high inflation between the periods 2009 and 2011. In order to observe the error index for achieving 60 percent confidence level, a scenario with default parameters value for seven different periods was run. For each implementation run, the opening value and closing value of the stock data was changed. |
| Fig.5 compares the error index on high dimension stock data for different sample periods using AP-FCF method to that of NPC and SPLAFIS for the same scenarios discussed above. In all scenarios, the AP-FCF method outperforms all two systems. As illustrated in the graphs, the error index on high dimension stock data follows a decreasing trend when compared to the state-of-the-art methods from the start of the simulation. It can be observed that during the sampling period from 2005 to 2009, the error index observed using all three methods increased whereas during 2010 and 2011, the error index decreased using AP-FCF method in comparison to two other methods [1] and [2]. This is because of the application of Maximum Entropy Principle Distribution approach. Using the membership function in Maximum Entropy Principle Distribution approach, a threshold value between the attributes and classes are established resulting in minimizing the error index. As a result, the maximum distribution obtained reduces the error index on stock data by 13 – 56 % compared to NPC and 36 – 79 % compared to SPLAFIS respectively. |
Impact of fuzzy clustering accuracy
|
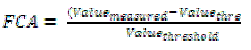
| The fuzzy clustering accuracy using AP-FCF method is the ratio of difference between the value measured and threshold value to the threshold value. The fuzzy clustering accuracy is measured in terms of percentage (%). |
 (8) (8) |
| Seven combinations of index observations between March 2005 and September 2005 with varied index observations are shown in Fig.6. |
| Fig.6 shows the behavior of the fuzzy clustering accuracy in response to varying index observations varied between March 2005 and September 2005. The average fuzzy clustering accuracy of the three methods was observed to be increasing in the periods between March 2005 and June 2005. There was a fall off in fuzzy clustering accuracy during the period July 2005 with an index observation of 500 and then a rise in the clustering accuracy was observed. This is because of the involvement of high fluctuation rate observed in the stock market, a steadiness was not observed and fuzzy clustering accuracy varied accordingly. Comparatively, the proposed method observed an increased fuzzy clustering accuracy compared to NPC and SPLAFIS. This is because of applying Type-2 Fuzzy Clustered Logic Rules on high dimensional uncertain data results in the increase in the accuracy rate. The Type-2 Fuzzy Clustered Logic Rules using Type-2 fuzzy clustered logic distribution function obtained the clustered output from conditional probabilistic resulting in the increased accuracy rate by 6 – 8 % compared to NPC. Besides, using union operators, the conditions are combined together to identify the combined result forming an increase in the fuzzy clustering accuracy by 11 – 15 % compared to SPLAFIS. |
Impact of running time of distribution function
|
| The running time of distribution function using AP-FCF method refers to the time taken to perform fuzzy clustered logic distribution function as given below. It is measured in terms of milliseconds (ms). |
| The convergence plot for measuring running time of distribution function using the index observation between the periods March 2005 and September 2005 is shown in Fig.7. From the Fig.7 we can notice that the proposed AP-FCP method converged lower running time than NPC [1] and SPLAFIS [2] by yielding higher threshold value which reduces the running time using the stock data. Moreover, AP-FCP method model had the best running time of distribution function of 0.28 ms followed by MPC, SPLAFIS with best running time of 0.36 ms and 0.51 ms respectively. The running time of distribution function is reduced with the application of Ant Possibilistic approach. With the application of prediction mining in AP-FCF method, based on type-2 fuzzy clustered set rules, the running time of distribution function is reduced by 13 – 31 % compared to NPC. Moreover, by introducing Ant Rule based Predictive Miner paradigm, uncertain data index is added to the database. It is then compared with the convergent test and produces probabilistic fuzzy rule result in lesser amount of time reducing the running time of distribution function by 32 – 82 % compared to SPLAFIS. |
CONCLUSION
|
| This paper presented a novel method for forecasting complex high dimensional uncertain data using Ant Possibilistic Fuzzy Clustered Forecasting (AP-FCF). A key feature of this method is its ability to increase the accuracy using fuzzy clustering as more requests are obtained from the investor. Maximum entropy principle distribution approach and conditional probabilistic fuzzy clustered set distribution was applied in AP-FCF method for efficient forecasting of stock data and to make profit out of it. Next, due to the change in government policy and market fluctuations, to improve the accuracy rate of forecasting, an Ant possibilistic approach was introduced in AP-FCP method. Performances results reveal that the proposed AP-FCF method provides higher level of forecasting rate and improved the fuzzy clustering accuracy on sampling periods. Compared to the predictive mining methods, the proposed Ant Possibilistic Fuzzy Clustered Forecasting method is comparatively better than the state-of-art works. |
Figures at a glance
|
 |
 |
 |
 |
| Figure 1 |
Figure 2 |
Figure 3 |
Figure 4 |
 |
 |
 |
| Figure 5 |
Figure 6 |
Figure 7 |
|
| |
References
|
- Myriam Bounhas, Mohammad Ghasemi Hamed, Henri Pradec, Mathieu Serrurierc, Khaled Melloulia, “Naive Possibilistic classifiers for imprecise or uncertain numerical data,” Elsevier Journal., pp.1-32,2014
- Richard J. Oentaryo, Meng Joo Er, San Linn., Xiang Li, “Online probabilistic learning for fuzzy inference system,” Expert Systems with Applications, Elsevier journal, pp.5082-5096, 2014
- Esmaeil Hadavandi, Hassan Shavandi, Arash Ghanbari,” Integration of genetic fuzzy systems and artificial neural networks for stock price forecasting”, Knowledge-Based Systems, Elsevier, pp.800-808,2010
- Sasan Barak, Mohammad Modarres,” Developing an approach to evaluate stocks by forecasting effective features with data mining methods”, Expert Systems with Applications, Elsevier, pp.1325-1339, 2014
- Khalil Benmouiza, Ali Cheknane,” Forecasting hourly global solar radiation using hybrid k-means and nonlinear autoregressive neural network models”, Energy Conversion and Management, Elsevier, pp.561-569, 2013
- Jamal Shahrabi, Esmaeil Hadavandi, Shahrokh Asadi,” Developing a hybrid intelligent model for forecasting problems: Case study of tourism demand time series”, Knowledge-Based Systems, Elsevier, pp.112-122,2013
- Shahrokh Asadi, Jamal Shahrabi, Peyman Abbaszadeh, Shabnam Tabanmehr,” A new hybrid artificial neural networks for rainfall–runoff process modeling”, Neurocomputing, Elsevier, pp.470-480,2013
- Kais Ismail Ibraheem ,Eman Bacheer Abdelahad.” An Algorithm Forecasting Time Series Using Wavelet”, International Journal of Computer Science Issues, Vol. 11, Issue 1, No 1, pp.1-33,2014
- Rajesh V. Argiddi, Dr.Mrs.S.S.Apte , Bhagyashri U. Kale,” An Analysis on Stock Market Intelligence and Research Approaches”, International Journal of Application or Innovation in Engineering & Management, Volume 3, Issue 1,pp.1-4, January 2014
- Ms. Hiral R. Patel, Mr. Amit B. Suthar, Dr. Satyen M. Parikh,” A Proposed Prediction Model for Forecasting the Financial Market Value According to Diversity in Factor”, International Journal of Computer Technology & Applications, Vol 5 (1),131-135, Feb 2014
- Yanshan Wang, In-Chan Choi,” Market Index and Stock Price Direction Prediction using Machine Learning Techniques: An empirical study on The KOSPI and HIS”, Elsevier, Sep 2013
- Vishwanath R H, Leena S, Srikantaiah K C, K Shreekrishna Kumar, P Deepa Shenoy, Venugopal K R, S S Iyengar and L M Patnaik,” Forecasting Stock Time-Series using Data Approximation and Pattern Sequence Similarity”, Elseiver, pp.90-100,Sep 2013
- PETR HAJEK,” Forecasting Stock Market Trend using Prototype Generation Classifiers”, WSEAS TRANSACTIONS on SYSTEMS, Issue 12, Volume 11, pp.671-680,December 2012
- Abhishek Gupta1, Dr. Samidha D. Sharma,”Clustering-Classification Based Prediction of Stock Market Future Prediction”, International Journal Of Computer Science and Information Technologies, Vol. 5 (3), pp.2806-2809,2014
- KUO-PING WU, YUNG-PIAO WU AND HAHN-MING LEE,” Stock Trend Prediction by Using K-Means and AprioriAll Algorithm for Sequential Chart Pattern Mining”, JOURNAL OF INFORMATION SCIENCE AND ENGINEERING 30, 653-667 (2014)
|