ISSN ONLINE(2319-8753)PRINT(2347-6710)
ISSN ONLINE(2319-8753)PRINT(2347-6710)
Swaminaidu.G1, Soundarya Mala.P2, Sailaja.V3
|
| Related article at Pubmed, Scholar Google |
Visit for more related articles at International Journal of Innovative Research in Science, Engineering and Technology
This paper describes the how to detect the damaged buildings in remotely sensed areas. There are several different algorithms for automated change detection. These methods are based on isotropic frequency filtering, spectral and texture analysis, and segmentation. Texture is a sample area, it defines properties of surface. Texture is an important approach to region description. Sometimes edge detection cannot identify the changes or damages in the buildings, in that type of situations the texture analysis is most useful. The three principal approaches used in image processing to describe the texture of a region are statistical, structural and spectral. Texture analysis gives the more reliable to detect the damaged buildings in crisis areas. For the texture analysis, we calculate the Haralick properties parameters such as energy and homogeneity for the images. A rule-based combination of the change algorithms is applied to calculate the probability of change for a particular location. Now a day’s damaged building detection using image processing techniques occupy prominent place. Texture properties play a vital role in the damaged building detection. The method proposed in this paper used texture features for the detection of damaged buildings in the crisis areas.
Keywords |
| homogeneity, segmentation, texture analysis, edge detection |
INTRODUCTION |
| Change detection is the process of identifying differences in the state of an object or phenomenon by observing it at different times. Essentially, it involves the ability to quantify temporal effects using multitemporal data sets. The effects of the cyclones, earth quakes, floods and natural disasters are needed to be found. There are so many techniques to detect the damaged buildings or areas such as image difference, image ratio, principle component analysis, multivariate alteration detection (MAD) [4] and post classification change detection. One of the major applications of remotely-sensed data obtained from Earth-orbiting satellites is change detection because of repetitive coverage at short intervals and consistent image quality [2]. Change detection is useful in such diverse applications as land use change analysis, monitoring of shifting cultivation, assessment of deforestation, study of changes in vegetation phonology, seasonal changes in pasture production, damage assessment, and crop stress detection, disaster monitoring snow-melt measurements, day/night analysis of thermal characteristics and other environmental changes. |
| Good change detection research should provide the following information: |
| • Area change and change rate |
| • Spatial distribution of changed types |
| • Change trajectories of land-cover types and |
| • Accuracy assessment of change detection results. |
| When implementing a change detection project, three major steps are involved: |
| • Image preprocessing including geometrical rectification and image registration, radiometric and atmospheric correction, and topographic correction if the study area is in mountainous regions |
| • Selection of suitable techniques to implement change detection analyses and |
| • Accuracy assessment [1]. |
DAMAGED BUILDING DETECTION |
| Earlier methods such as image ratio, image difference, principle component analysis [5] are failed to detect the reliable changes of buildings so that we had to develop a different procedure for change detection. This procedure is based on several different principles: Fourier transformation, edge detection, texture analysis [10] and segmentation. |
A. TEXTURE ANALYSIS |
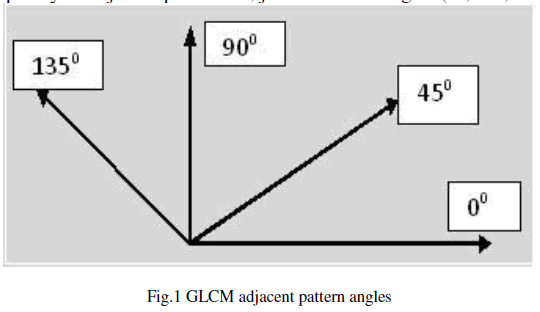
| An important approach to region description is to quantify its texture content. Although no formal definition of texture exists, intuitively this descriptor provides measures of properties such as smoothness, coarseness, and regularity. Structural techniques [11] deal with the arrangement of image primitives, such as the description of texture based on regularly spaced parallel lines. Statistical approaches yield characterizations of texture as smooth, coarse, grainy, and so on. Spectral techniques are based on properties of the Fourier spectrum and are used primarily to detect global periodicity in an image by identifying high-energy narrow peaks in the spectrum. For the calculation of texture parameters, we make use of the Haralick features [8]. This is based on the gray-level co-occurrence matrix (GLCM). GLCM finds frequency of adjacent pattern < i, j> in different angles (00, 450, 900, or 1350) shown in fig1. |
 |
| The different parameters of texture features are |
| • Energy |
| • Homogeneity or Inverse Distance Moment (IDM) |
| • Correlation |
| • Contrast |
| In these texture features are also called as Haralick properties. In these properties energy and homogeneity are used to detect the damaged buildings. Because of the maximum information about the particular area will be carried by those parameters. It can also use the all Haralick properties but it leads to more complex process. The GLCM for every image calculated after an initial histogram matching of the multitemporal images. Based on the GLCM, the texture features homogeneity and energy is computed with differently sized windows ranging from 3×3 to 17×17 pixels. Best results are obtained with a 13×13 window. |
B. SEGMENTATION |
| Segmentation subdivides an image into its constituent regions or objects. Segmentation should stop when the objects or regions of interest in an application have been detected. Segmentation of nontrivial images is one of the most difficult tasks in image processing. Segmentation accuracy determines the eventual success or failure of computerized analysis procedures. For this reason, considerable care should be taken to improve the probability of accurate segmentation. Segmentation algorithms are based on one of two basic properties of intensity values discontinuity and similarity [13] . In the first category approach is to partition is to partition an image based on abrupt change in intensity. The principal approaching in the second category are based on partition an image into regions that are similar according to a set of predefined criteria. Thresholding, region growing, and region splitting and merging are examples of methods in this category. The segmentation method that we developed for our study is based on the Euclidean distance. The gray value range is calculated and divided by a constant. The properties, simplicity of implementation, and computational speed, image Thresholding enjoys a central position in application of image segmentation. Segments with a high correlation represent no changes. Segments with a low correlation represent changes. |
C. EDGE DETECTION |
| Edges are significant local changes of intensity on an image. Edges are typically occurring on the boundary between two different regions on an image. Basically edge detection may perform in four different steps [12]. They are |
| • Smoothing |
| • Enhancement |
| • Detection |
| • Localization |
| Smoothing suppresses as much noise as possible without destroying the true edges. Enhancement is nothing but the sharpening of the image. It is the process of apply a filter to enhance the quality of the edges in the image. Detection is used to determine which edge pixels should be discarded as noise and which should be retained. Usually Thresholding provides the criterion for the used for detection. Localization determines exact location of an edge. Sub-pixel resolution might be required for some applications, i.e. estimate the location of an edge to better than the spacing between the pixels. Edge thinning and linking are usually required in this localization. |
| There are many methods for edge detection, but most of them can be grouped into two categories, searchbased and zero-crossing based. The search-based methods detect edges by first computing a measure of edge strength, usually a first-order derivative expression such as the gradient magnitude, and then searching for local directional maxima of the gradient magnitude using a computed estimate of the local orientation of the edge, usually the gradient direction. The zero-crossing based methods search for zero crossings in a second-order derivative expression computed from the image in order to find edges, usually the zero-crossings of the Laplacian or the zero |
| crossings of a non-linear differential expression. As a pre-processing step to edge detection, a smoothing stage, typically Gaussian smoothing, is almost always applied. A survey of a number of different edge detection methods can be found in (Ziou and Tabbone 1998); [6] see also the encyclopedia articles on edge detection in Encyclopedia of Mathematics [3] and Encyclopedia of Computer Science and Engineering. [7] |
| There are so many operators in edge detection some of the operators are |
| • Sobel edge detector |
| • Prewitt edge detector |
| • Robert edge detector |
| • Canny edge detector |
| In these edge detection operators canny edge detector [9] gives the best results compare the other approaches like |
| • Better detection specially in nose conditions |
| • improving signal to noise ratio |
| • localization and response |
METHODOLOGY |
| This method is composed with three image processing tools that are frequency filtering, texture features and segmentation. By applying of frequency filtering high frequency areas are indentified and we can easily process it. Texture features are used for measuring the different properties of images area and segmentation gives simplified information about image for it diagnosis. Those are as follows: |
A. FOIRIER TRANSFORMATION |
| Read images which are captured on different dates say T1 and T2. |
| • Apply adaptive band pass filter in both images. |
| • Convert resulted images into spatial domain by applying inverse Fourier transform. |
| • Apply edge detector on both images i.e. T1 and T2. |
| • As post processing, apply morphological close and open operations. |
B. TEXTURE PARAMETERS |
| • Find GLCM for images whose multi temporal images histograms are same. |
| • For every 13X13 window find Haralick features i.e. energy and inverse diversity. |
| • If these features values are high that indicates building otherwise it indicates with outbuildings. |
C. CHANGE DETECTION BASED ON SEGMENTATION |
| • Find a threshold for both images i.e. T1 and T2. |
| • Find Euclidean distance for every pixel to adjacent pixel and process image as follows |
| If |
| Euclidean distance < threshold |
| Pixel belongs to same segment |
| Else |
| Pixel belongs to other segment. |
| • For segments of T1 and T2 find difference. |
| • For this difference, find correlation factor and result should is assigned to assigned to each segment. |
| • Than classify the segment into higher correlation values and lower correlation values which designates ‘no changes’ and ‘changes’. |
D. THE PROPOSED METHOD (COMBINATION OF ABOVE THREE METHODS) |
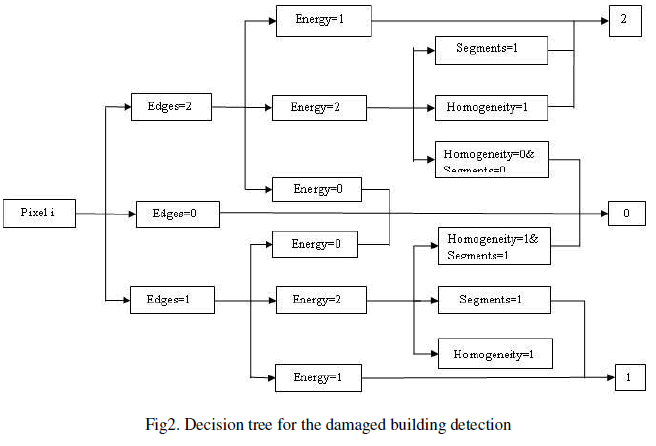
| • The decision tree for the damaged building detection as shown in the fig.2. Where edges= result of the edge detection based on filtering in the Fourier domain. Segments=result of the change detection using segmentation. Homogeneity and Energy=results of the texture features. Numbers are related to the following classes: 0 = unchanged buildings, 1= changed/destroyed buildings, 2 = new buildings. |
| • As of result of edge detector, if edge parameter shows ‘no change’ the pixel in image is classified as ‘no change’. |
| • If the edge parameter shows ‘new building’, the pixel is classified as ‘new’. |
| • If the texture features energy shows ‘change’ and homogeneity or segmentation shows ‘change’ than result is ‘new’. Otherwise unchanged. |
| • If edge parameter shows ‘change’ then result is ‘change’ and energy is also considered. |
| • If energy shows ‘no change’ pixel is classified as ‘no change’. |
| • If energy show ‘new’ but segment and homogeneity show ‘change’, the pixel is assigned to ‘change’ otherwise ‘unchanged’. |
 |
 |
 |
 |
RESULT |
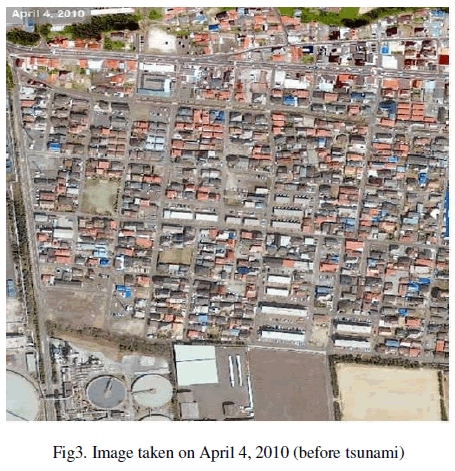
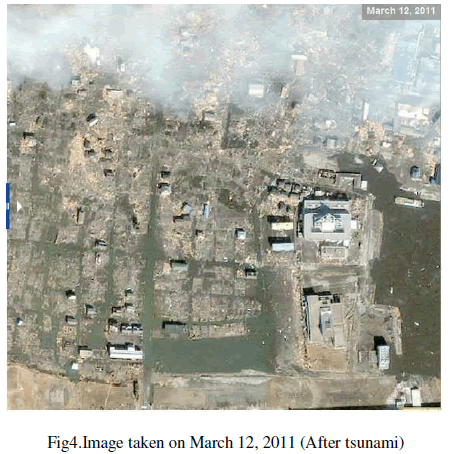
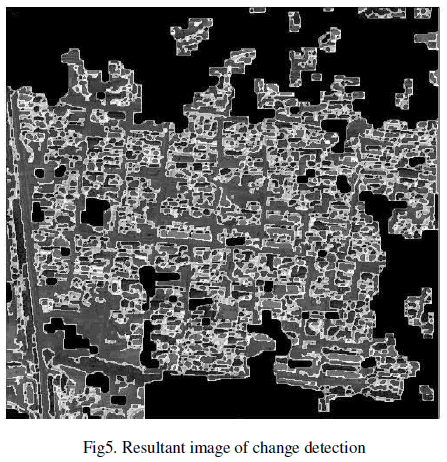
| As shown in fig3 and fig4 two images are taken at two different dates before and after the tsunami. After the applying the method the resultant image is shown in fig.5. With the change detection based on frequency domain filtering, texture features, segmentation and subsequent edge detection, it proved possible to identify unchanged areas, new buildings and damaged buildings, even very small changes. The resultant image fig5 contain three different colors: Black color stands for “no change”, White color stands for “new buildings (construction)”, Gray color stands for “changed buildings (destruction)”. |
CONCLUSION |
| In this paper, a new change detection method is described by using image processing tools. This method is composed with three image processing tools that are frequency filtering, textures features those are energy and homogeneity and segmentation. This method gives superior results compare with the ordinary detection methods such as image difference, image ratio, principle component analysis, multivariate alteration detection (MAD) and post classification change detection. |
ACKNOWLEDGEMENT |
| The authors also would like to thank the anonymous reviewers for their comments and suggestions to improve this paper. The authors also would like to thanks Sasi kiran varma, K.Jyothi, Saka kezia joseph, Obulesh |
References |
|