Research & Reviews: Journal of Chemistry
e-ISSN: 2319-9849
e-ISSN: 2319-9849
Kvamme B* and Sapate A
Department of Physics and Technology, University of Bergen, Norway
Received date: 22/07/2016; Accepted date: 23/09/2016; Published date: 26/09/2016
Visit for more related articles at Research & Reviews: Journal of Chemistry
ransport of hydrocarbon on the seafloor of the North Sea involves conditions of methane hydrate formation for most of the transport conditions from delivery to the receiving end. Hydrate stability regions are further extended through additional content of ethane. The critical question is therefore whether water will drop out from the gas and how it will drop out. Water can obviously condense out as liquid water, as has been the usual basis for hydrate risk evaluation schemes. Pipelines are rusty even before they are placed out on the seafloor and the question is if the water will benefit from dropping out onto these rusty surfaces at lower concentrations than dew-point concentrations for the same system at local temperatures and pressures. In this work we have used state of the art theoretical models to estimate maximum water content before condensation, and similar for adsorption on Hematite (rust). It is found that the maximum content of water that would be permitted for dew-point is more than 18 times than what would be permitted if adsorption on rust was the criteria for water drop-out. These ratios do not change significantly by adding ethane but the absolute tolerance limit for water mole-fraction is reduced. It is therefore recommended that dehydration units should be dimensioned according to estimated maximum water content before adsorption on rusty surfaces. Hematite is a dominant form of rust but it is still recommended that similar analysis is conducted for Magnetite and Iron oxide.
Natural gas hydrates, Pipeline transport, Risk analysis, Rust
Clathrate hydrates formed from hydrocarbons and water commonly called gas hydrates (GH), are inclusion compounds formed by the combination of hydrogen bonded water molecules forming cavities, and suitably sized molecules filling these cavities. Hydrates are formed when constituents come in contact with each other under favorable hydrate forming conditions of low temperature and high pressure. Due to the huge amounts of methane trapped in ice-like form as hydrates, GHs are recognized as “fuel of the future”. Most of the natural gas hydrate is trapped under sealing formations (normally clay or shale) in sediments, or permafrost with varying additional sealing in addition to frozen layers above the hydrate zones. The origin of the methane in natural gas hydrates is, in most natural occurrences, from biogenic degradation of organic material in the upper few hundreds of meters of the crust. These hydrates are typically very rich in methane, in contrast to hydrocarbons released from thermogenic degradation of organic material deep down in the crust. Different origin of hydrocarbons offshore Norway is reflected in the composition of natural gas being produced. Gas from Troll is very rich in methane and the limited amount of ethane and heavier hydrocarbons has not been considered as valuable enough to justify a costlier (investment and operation) separation plant for very low temperature separation. The Troll separation plant therefore is a simple so-called dew-point separation plant, in which the lowest temperature is -22°C at 69 bar. This is in contrast to gas from Kvitebjørn. This gas is separated on the same location (Kollsnes outside Bergen in Norway) but is a separate plant. The higher content of ethane and heavier justifies a more complex process plant which goes down to -70°C. For the Troll plant the final separator is one of the critical points in terms of possible hydrate and ice formation due to the low temperature and high concentration of ethane in the liquid outlet from the final separator. Since content of propane and higher is very low we might expect a methane dominated structure I hydrate in the gas phase and structure I dominated by ethane in the liquid phase out from this separator. Any limited content of propane will lead to some structure II hydrate but likely small amounts in the Troll separation system.
In addition to methane (CH4), GHs contain other light hydrocarbons like ethane (C2H6), propane (C3H8), butane (C4H10) etc. and non-hydrocarbons such as carbon dioxide (CO2), Hydrogen sulfide (H2S), Nitrogen (N2) etc [1]. These guest molecules enter hydrate as supporting stabilization while some of them are unable to make hydrate as pure components at these conditions, like for instance N2. The composition of natural gas varies from field to field and region to region. Although more hydrate structures had been discovered during the latest two decades there are three structures which are the most common and well known; structure I, structure II and structure H. Unit cell of sI hydrate is made up of 46 water molecules and contains two small and six large cavities, small cage Pentagonal dodecahedron (512) while large cage is a Tetrakaidecahedron (51264). A cubic unit cell has dimension of about 12.01 Å at 0°C. Unit cell is the smallest symmetrical unit crystal which is repeated in all volumetric dimensions into macro crystals. One-unit cell of structure II consist 136 water molecules and has 8 large and 16 small cavities. Large cage is Hexakaidecahedron (51264) arranged in terms of faces, made up of 16-sided cavity with 12 pentagonal faces and four hexagonal faces. The cubic unit cell dimension is 17.36 Å at 0°C. In all of the three structures, the small cage is a Pentagonal dodecahedron (512) since it has the shape of 12 pentagonal faces [1]. Structure H is rarer and we could not find any references to findings of structure H in industrial hydrate plugs formed during processing or transport.
Formation of these various hydrate structures depends on the available space in cavities compared to size of molecules entering these. The actual stabilization depends on short range interactions, so-called van der Waal type interactions, and in some cases also coulombic interactions between partial charges in guest molecules and host molecules in the lattice without any chemical bonding. An example Hydrogen sulfide, which has a dipole moment which is strong enough to have significant coulombic attractions towards water in the lattice but weak enough to ensure that the water lattice do not collapse [2]. Generally small guest molecules such as methane, Ethane can form both structure I and structure II hydrate, but the size of the large cavity is very beneficial for ethane. Pure components of the two, as well as mixtures of these will predominantly form structure I hydrate. Propane (C3H8) is too large to fit into the large cavity of structure I and only forms structure II hydrate through occupation of the large cavity in that structure. The small cavity of that structure is very similar to the small cavity in structure I and is well stabilized by occupation of methane. Mixtures of methane and propane will therefore form structure II hydrates initially but when all of propane is extracted from the gas over to hydrate the remaining methane will form structure I hydrate.
Long term transportation of natural gas to reasonably close markets is normally accomplished by pipelines, as for example with most of the pipelines transporting natural gas from fields offshore Norway and also including pipeline transport to Germany for further distribution. Shipping of natural gas as Liquefied Natural gas (LNG) system or Compressed Natural Gas (CNG) system is normally costlier and dedicated to destinations far away. LNG from Snøhvit offshore the north of Norway, as one example, was targeted towards the USA market. After USA started large scale production of gas from shale this market disappeared. Most of the conditions during separation of natural gas in a plant like for instance the Troll plant is inside the hydrate formation region of temperature and pressure if free water is available, or if water can drop out from the gas as separate phase(s). Transport of natural gas from Norway to the continent involves high pressures and low temperatures as well. Typical delivery pressure for transport is 250-300 bar. Pressures on receiving ends vary, depending on desired transport velocity on the receiving end and further infrastructure for processing, petrochemistry or transport distribution. The minimum pressure range used in this work corresponds to 50 bar. This temperature is somewhat random but based on transport lines to further distribution and/or further processing. Similar analysis for lower minimum pressures in the hydrate formation region is of course trivial along the lines described in this paper. Temperature outside the pipelines on the seafloor is rarely above 6°C and also well within hydrate forming conditions if a separate water phase is available or can drop out from water dissolved in the gas. Given these ranges of conditions then methane hydrate will form if water drops out from the gas. Although methane is the primary component of natural gas it may, as discussed above, contain other light hydrocarbons and non-hydrocarbons. Nitrogen has limited stabilization effect on the hydrate cavities and represents rather a dilution of the natural gas, which alters the hydrate formation to higher pressures and/or lower temperatures. Hydrogen sulfide, on the other hand, stabilizes the hydrate very efficiently so even limited amounts of hydrogen sulfide shifts the hydrate forming conditions to lower pressures and/or higher temperatures.
Normally water is following the hydrocarbon stream from the producing well. Water is separated from the hydrocarbon stream by a three phase separator. The minimum amount of water following the hydrocarbons further into the processing will be saturation concentration before the water phase was removed. Typically, some additional water is distributed into the hydrocarbon stream in the form of nano to micro droplets due to hydrodynamics. Depending on the local conditions of temperature and pressure, gas composition and mole-fraction of water in the gas, water can drop out and form separate water phases. Water can condense out or adsorb on the solid surfaces (typically rusty pipelines) as two examples examined in this study. And if hydrate forms the adsorption of water from gas on hydrate crystals yet another possibility. Theoretically hydrate can also form directly from dissolved water in the gas although the low concentration of water makes it rather unlikely. In particular in view of the associated released heat, heat which needs to be transported away through a heat insulator (non-polar gas).
Hydrate forming from a separate water phase and gas components can eventually form substantial ice-like plugs that can severely obstruct the flow and in worst case lead to total blocking and damage to pipeline or equipment. The safest solution is to remove water from the gas down to a level of mole-fraction, which does not represent a risk in formation of a separate water phase, whether that means a liquid water phase or water adsorbing on rust.
Estimation of upper limit of water content that can be permitted in a natural gas stream during processing or transporting for given ranges of temperature and pressure is a critical issue in the evaluation of how much water that needs to be removed. The most common way to dry the gas is through absorption in glycol, which can be utilized down to around -25°C. Other systems for water removal, mostly adsorption technology, are needed for lower temperature separation.
In this work we primarily focus on two different routes that can lead to hydrate formation from a gas mixture. One route involves the condensing of water and subsequent hydrate formation from the free water phase and hydrate formers from the gas phase. A second route goes through adsorption of water from the gas on rust, and then formation of hydrate from free water and hydrate formers from the gas phase. Hydrate cannot form directly on the rusty surface because of incompatibility between the distribution of partial charges of hydrogens and oxygens in the hydrate lattice, and atom charges in the rust surface. But the rust will serve as a catalyst for kicking out water from the gas and then hydrate can form slightly outside of the first two or three water layers (roughly 1 nm). As mentioned above hydrate formation directly from water dissolved in gas is not likely due to limitations in mass- and heat-transport. This route is still evaluated as a reference to see if it thermodynamically feasible. If the water/hydrocarbon system were totally unaffected by surface stress from flow, then a hydrate film would form rapidly on the water/hydrocarbon interface and rapidly block further transport of hydrate former and waters through the hydrate film (very low diffusivity coefficients). In that case hydrate would grow from the hydrate formers dissolved in water, and hydrate could grow from water dissolved in gas, which then would benefit from nucleation on the hydrate surface. But in a flowing situation with turbulent shear forces this is not a realistic situation. Yet another important difference between a flowing situation and a stationary constant volume, constant mass experiment in laboratory is that supply of new mass is continuous. As such there is not the limiting situation that all water is consumed and hydrate formation stops. Rust formed from iron and oxygen under impact of water is a mixture of several different iron oxides like Magnetite (Fe3O4), Hematite (Fe2O3) and iron oxide (FeO). Magnetite often forms very early while in the long run Hematite appears to be one of the most thermodynamically stable forms of ordinary rust. By ordinary rust we then mean various iron oxide forms as a result of iron exposed to water and oxygen. Impurities of components like Carbon dioxide and Hydrogen sulfide can lead to conversions over to iron carbonates and various iron/sulfur components.
Water will always follow the hydrocarbon stream entering an offshore or onshore processing plant, from a production well. Amount of water vary, from a separate water phase being produced along with the hydrocarbons, and downwards to water dissolved in hydrocarbon gas and liquid phases. Gas processing involves several unit operations that can lead to thermodynamic conditions favorable for hydrate formation. Turbines leading to gas cooling and low temperature flash tanks are two typical examples.
In the North Sea alone there is 7800 km of rusty pipelines transporting oil and gas. The range of operating pressures in terms of delivery pressure from separation plant and pressure on receiving plant, or connection point varies, as discussed above. Temperatures on the seafloor are typically in the range of -1 to 6°C. A pressure range of 50 to 250 bar covers large portions of the North Sea transport conditions. Hydrate will therefore form during pipeline transport if free water phases can be formed from water in the hydrocarbon system. Remains of water will always prevail after hydrocarbon processing and the question is how high concentration of water that can be tolerated without risk of water dropping out from the hydrocarbon solution.
Hydrates formed in pipelines could be removed using various technologies but the simplest possible way to reduce risk of hydrate formation is to evaluate the upper limit of water content that can be permitted in natural gas stream during transport. The primary focus of this work is to compare hydrate risk evaluation as based on two different schemes. As mentioned above, estimation of water dew point pressures for local temperatures is the basis for the more classical industrial approach use in most industry. With water dew-point mole-fraction as the dependent variable rather than temperature or pressure the limit of water content before water condensation can be calculated for each local temperature and pressure during the transport. The resulting maximum water content that can be tolerated is the basis for design of water removal systems. Yet another possibility is that water adsorbs on rusty pipeline surfaces and subsequently forms hydrates heterogeneously from water layers slightly outside [3].
The first step controlling hydrate formation is to evaluate at what temperature-pressure conditions in a particular system are conducive to gas hydrate formation. However, the estimation of maximum amount of water that can be tolerated in gas during its pipeline transport without a risk of hydrate formation is a very complex issue due to competing phase transition mechanisms and different routes to hydrate formation, where both kinetics and thermodynamics plays vital role. The dynamic situation becomes even complex due to the fact that hydrates formed in transport pipelines are unable to reach thermodynamic equilibrium due to the limitations of Gibbs phase rule. In non-equilibrium situation, chemical potentials of different hydrate forming components are different across all the phase boundaries.
Our study is based on free energy analysis since hydrate formed from different phases will have different free energies because of different chemical potential of guest molecules. The brief description of hydrate phase transition scenario can be seen in [4]. In equilibrium situation the classical way to solve for equilibrium is to solve simultaneously the conditions for equilibrium, mass-conservation, and energy-conservation. In a non-equilibrium situation, the equilibrium conditions will be replaced by the combined 1st and 2nd law of thermodynamics through some schemes for minimizing free energy locally under constraints of massand energy-conservation. In case of hydrate formation and dissociation, each phase transition is modeled as pseudo reactions with corresponding changes in free energies as driving force for phase transition itself and dynamically coupled to mass transport & heat transport [5]. Impact of competing phase transitions needs to couplings to kinetics of mass and heat transport. Free energy changes associated with all phase transitions can be calculated by using equation.
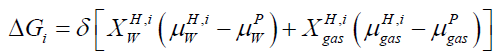 (1)
(1)
Where x=composition, H=hydrate phase, i=phase transition scenario, μ=chemical potential, p=liquid, gas, adsorbed phases, δ=+1 for hydrate formation and -1 for hydrate dissociation.
Various possible hydrate formation routes, as well as routes that can lead to hydrate dissociation during transport of natural gas through pipelines have been discussed by Kvamme [4] on the basis of changes in free energy associated with the various phase transitions. Note in particular that for a non-equilibrium situation chemical potentials for guest molecules in various phases are not the same. This implies that the chemical potentials for the guest molecules in the hydrate will be different as well, as can be seen from a Taylor expansion from an equilibrium point [6-8].
The hydrate phase transition itself, whether it is formation or dissociation, is a nano-scale process which is kinetically controlled by what happens on a thin interface-typically 3-4 water layers (roughly 1-1.5 nm). The implicitly coupled mass transport is therefore a molecular scale diffusion transport. The support of mass from a larger surrounding couples this diffusion to hydrodynamics of the flow situation. But the thermodynamic driving force for the phase transition itself is of course also implicitly coupled to the associated heat transport needed. For hydrate formation then the formation enthalpy needs to be transported away. And for dissociation the heat must be supplied by heat transport from the surroundings. The absolute value of heat that needs to be transported is consistently given by Equation 1 and standard thermodynamic relationships. i.e.:
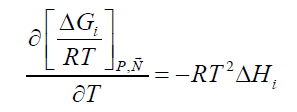 (2)
(2)
This can be evaluated numerically and analytically based on the models for chemical potentials incorporated, as discussed later. The actual heat transport dynamics, as implicitly coupled to the phase transition thermodynamics (Equation 1) is individual for each phase transition. Hydrate formation on the interface of water adsorbed on rust will have fast heat transport through liquid water and solid rust. Similarly, for hydrate formed from dissolved and/or adsorbed hydrate formers in this layer. For these situations heat transfer may be two to three orders of magnitudes faster than mass transport [9] and as such no rate limiting process.
As discussed above the system in consideration cannot reach equilibrium. If a quasi-equilibrium approach is utilized in order to evaluate thermodynamic benefits of various routes of hydrate formation or dissociation, then the classical equilibrium equations applies:
T(I)=T(II)=T(III) ….. =T Thermal Equilibrium (3)
P(I)=P(II)=P(III) …..=P Newton’s law, Mechanical Equilibrium (4)
μ(I)=μ(II)=μ(III) …..=μ Chemical Equilibrium (5)
In above equations superscript (I), (II), (III) and further are phase index for each of the co-existing phases being considered. Residual thermodynamic through the use of an equation of state SRK (Soave-Redlich-Kwong) [10] is utilized for all components in all phases, including hydrate, liquid water and ice. This is accomplished using molecular dynamics simulation results for water in various phases (empty hydrates, liquid water, and ice) [11].
Fluid Thermodynamics
The chemical potential of component i in gas phase is calculated by:
 (6)
(6)
where фi is fugacity coefficient for component i in given phase and y with arrow denote mole fraction vector of the gas.
lim (фi) → 1.0 ….for ideal gas
Also note that the ideal gas chemical potential includes the trivial mixing term due to ideal gas mixing of gases at constant pressure.
Aqueous Thermodynamics
Estimation of chemical potential of pure water are based on samplings from molecular simulations [11].
Symmetric excess: Chemical potential of component i in water phase is given by,
![]() (7)
(7)
Where γi → 1.0 when xi → 1.0
Note that the ideal liquid term contains the trivial ideal mixing term as well as the pure liquid value.
Asymmetric access: Components like methane, ethane and higher hydrocarbons have limited solubility in water and a reference state of infinite dilution is appropriate.
 (8)
(8)
lim (γi∞) → 1.0 when xi → 0
On the basis of these values it appears thermodynamically possible for hydrate to form from solution in water, also in accordance with earlier studies [12,13]. Nevertheless, the limited amount of methane and ethane dissolved into water does not make this route to hydrate a very important one in gas transport. It does not mean that it cannot play a role at some stage during massive hydrate growth. But it is likely not a key route in a primary hydrate risk evaluation.
In Equation 8, superscript ∞ indicates chemical potential of component i in water at infinite dilution, γi∞ indicates activity coefficient of component i in aqueous phase based on the same reference state. R is the universal gas constant. Solubility of methane and ethane are both individually so low that they may almost be considered as independent. As such Equation 9 below may be utilized with Equation 8, and similar for ethane based on solubility models may be important for situations of hydrate growth during shut-down and absence of significant hydrodynamic shear forces.
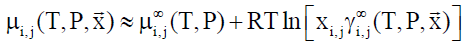 (9)
(9)
In Equation 9, subscript i and j refers to different phases and components respectively.
Hydrate Thermodynamics
For chemical potential of water in hydrate the usual Langmuir type adsorption model is utilized but in the form derived by Kvamme & Tanaka [11], which also accounts for lattice movements and corresponding impacts of various guest molecules:
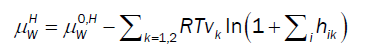 (10)
(10)
Where superscript H refers to hydrate phase, μWH refers to chemical potential of water in hydrate, μW0,Hdenotes chemical potential of water in empty clathrate structure, vk indicates fraction of cavity type k per water molecule, hik is cavity partition function of component k in cavity type j. The canonical partition function is given by:
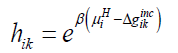 (11)
(11)
Where β is the inverse of gas constant times temperature, Δgikincrefers to impact on hydrate water from inclusion of the guest molecules i in the cavity k.
At equilibrium chemical potential of component i in hydrate has to be equal to its chemical potential in the phase it has been extracted from [4]. In our study, water will totally dominate the dew point and hydrate formation from dropped out liquid water can be obtained by following Equation 12. However, the chemical potential of all gas components of hydrate are estimated by using Equation 6 when dissolved in gaseous phase.
 (12)
(12)
Based on the model described by [11], the chemical potential of empty hydrate structure is estimated and has been verified to have predictive capabilities, which makes any empirical formulations redundant and may be unphysical since chemical potential is a fundamental property. Throughout this study we approximate the right hand side of (12) by pure water. This will imply a limited shift to the chemical potential of liquid water. As an example the correction at 150 bar and 274 K will be -0.07 kJ/mole and slightly higher for 200 bar and 250 bar but still not dramatic for the purpose of this study.
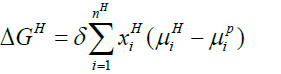
Below Equation 13 proves beneficial for the calculation of free energy change related to a hydrate phase transition ΔgH:
 (13)
(13)
In above equation, H and P is hydrate and parent phase of molecule i respectively.
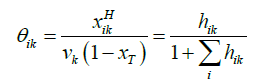
The relation between the filling fraction, the mole fractions & cavity partition function is given by Equation 14:
 (14)
(14)
Where xT = total mole fraction of all guests in the hydrate.
θik = Filling fraction of component in cavity type k.
xikH = Mole fraction of component i in cavity type k.
We did not make any attempts to fit interaction parameters in order to reproduce experimental data and priority on keeping the statistical mechanical model [11] free of adjustable parameters in all terms, including also empty hydrate chemical potentials and chemical potentials for ice and liquid water. Any other users of the methods and type of analysis described through this work may adjust their individual models at their own discretion. Nevertheless, it is still important to examine the qualitative agreements between estimates from our model systems [11], and representative experimental data.
In below Figures 1–3, compared the estimated hydrate equilibrium curve with experimental values from literature [14-16] resp. for simple ethane hydrate equilibrium. Even without utilizing any empiric data fitting, we considered the deviations quite acceptable for further illustration of maximum water content permitted for different scenarios leading to hydrate formation. In particular, predicted values are good enough for the range of relevant temperatures (274 K-280 K).

Figure 1: Comparison of estimated and experimental data for ethane hydrate equilibrium for a system containing pure ethane. Solid line (-) is estimates while asterisk (*) are experimental data from literature [6].

Figure 2: Comparison of estimated and experimental data for ethane hydrate equilibrium for pure ethane. Solid line (-) is estimates while asterisk (*) are experimental data from literature [7].

Figure 3: Comparison of estimated and experimental data for ethane hydrate equilibrium for pure ethane. Solid line (-) is estimates while asterisk (*) are experimental data from literature [8].
Verification of Hydrate Equilibrium Estimates for Binary Mixtures
Estimated hydrate equilibrium data for binary mixture of methane and ethane are compared with experimental data from literature [15] in Figures 4 and 5 below.

Figure 4: Estimated and experimental hydrate equilibrium curve, for gas mixture of 0.56 % methane and 0.44% ethane. Solid line (-) is estimates while asterisk (*) are experimental data from literature [7].

Figure 5: Estimated and experimental hydrate equilibrium curve, for gas mixture of 0.95 % methane and 0.05 % ethane. Solid line (-) is estimates while asterisk (*) are experimental data from literature [7].
The deviations between predictions and experimental data are acceptable for a qualitative analysis and illustration of the difference between the classical hydrate evaluation approach and approaches that also accounts for other routes toward hydrate formation. Others that want to use our approach to evaluate hydrate risk using their own mathematical models and tuned codes.
Water available for hydrate formation in transport pipeline can exist in three different states. Water dissolved in gas is inevitably. Water can be present as nano to micro droplets and water can also condense out as liquid water droplet. Yes, a third option is that water can adsorb on rust (in our study hematite). Direct hydrate formation from water dissolved in gas and hydrate formers is thermodynamically feasible but mass transport is limitation. Here we have considered two approximations for water, first water being dropped out as liquid droplets at specific temperature – pressure conditions and forms hydrate, second alterative include water being adsorbed on pipeline surfaces resulting in subsequent heterogeneous hydrate formation [3].
Figures 6–11 illustrate the estimated upper limit of water content in a system containing varying concentration of ethane and methane gas mixture with small amount of impurities including Carbon dioxide, Nitrogen and propane, before dropping out as liquid water and before adsorption on hematite.

Figure 6: Maximum water content before liquid drop out for mole fraction of gas containing pure ethane. Curves from bottom to top correspond to pressure 50 bar, 90 bar, 130 bar, 170 bar, 210 bar and 250 bar respectively.

Figure 7:Maximum water content before adsorption on hematite for mole fraction of gas containing pure ethane. Curves from bottom to top correspond to pressure 50 bar, 90 bar, 130 bar, 170 bar, 210 bar and 250 bar respectively.

Figure 8: Maximum water content before liquid drop out for mole fraction of gas containing 0.44 % ethane and 0.56 % methane. Curves from bottom to top correspond to pressure 50 bar, 90 bar, 130 bar, 170 bar, 210 bar and 250 bar respectively.

Figure 9: Maximum water content before adsorption on hematite for mole fraction of gas containing 0.44 % ethane and 0.56 % methane. Curves from bottom to top correspond to pressure 50 bar, 90 bar, 130 bar, 170 bar, 210 bar and 250 bar respectively.

Figure 10: Maximum water content before liquid drop out for mole â fraction of gas containing 0.05 % ethane and 0.95 % methane. Curves from bottom to top correspond to pressure 50 bar, 90 bar, 130 bar, 170 bar, 210 bar and 250 bar respectively.

Figure 11:Maximum water content before adsorption on hematite for mole â fraction of 0.05 % ethane and 0.95 % methane. Curves from bottom to top correspond to pressure 50 bar, 90 bar, 130 bar, 170 bar, 210 bar and 250 bar respectively.
In our work, we have chosen the temperature range within 274 K to 280 K since the actual conditions at the North seafloor resembles and pressure range between minimum pressure ranges of 50 bar to higher pressure 250 bar.
Based on absolute thermodynamics we have investigated the different routes to hydrate formation with ideal gas as a reference state. This makes comparison between different hydrate forming pathways more clear and consistent in free energy changes and relevant enthalpy changes as well.
In order to estimate the amount of water dropped out, a simple flash calculation can be applied. Under suitable T, P hydrate stability conditions, deposited water can form hydrate. Even though this is a trivial route to hydrate formation, water will prefer to drop out as adsorbed more quickly on rust [17] then hydrate forms from a number of additional pathways including either from adsorbed water and hydrate formers in gas phase or from both adsorbed water and hydrate formers.
From above Table 1, in a system containing pure ethane at temperature 274 K and pressure 50 bar, the estimated water permitted based on dew-point as basis for water drop-out (Figure 6) is 19 times higher than a limit based on water drop-out as adsorbed on Hematite (Figure 7). Similarly comparing the same system at quite higher pressure 250 bar, it is observed that the mole-fraction of water before liquid drop out (Figure 6) is 19.2 times higher than the mole-fraction of water before adsorption on hematite (Figure 7). Now in a system containing 44% ethane + 56% methane at temperature 280 K and pressure 90 bar, the estimated water tolerance based on dew-point as basis for water drop-out (Figure 8) is 18 times higher than a limit based on water drop-out as adsorbed on Hematite (Figure 9).
| TMin=274.0 (K) | Tmax=280 (K) | ||||
|---|---|---|---|---|---|
 |
At pressure (Bar) |  |
 |
 |
 |
| Pure Ethane | 50 | 0.0001566 | 0.0000082 | 0.0002231 | 0.0000125 |
| 90 | 0.0002615 | 0.0000136 | 0.0003722 | 0.0000209 | |
| 130 | 0.0003517 | 0.0000183 | 0.0005006 | 0.0000281 | |
| 170 | 0.0004296 | 0.0000224 | 0.0006113 | 0.0000344 | |
| 210 | 0.0004966 | 0.0000259 | 0.0007068 | 0.0000397 | |
| 250 | 0.0005543 | 0.0000289 | 0.0007891 | 0.0000443 | |
| 44% Ethane + 56 % Methane | 50 | 0.0001456 | 0.0000076 | 0.00021710 | 0.0000122 |
| 90 | 0.0002088 | 0.0000109 | 0.0002990 | 0.0000168 | |
| 130 | 0.0002859 | 0.0000149 | 0.0004059 | 0.0000228 | |
| 170 | 0.0003525 | 0.0000184 | 0.0005004 | 0.0000281 | |
| 210 | 0.0004099 | 0.0000213 | 0.0005821 | 0.0000327 | |
| 250 | 0.0004593 | 0.0000239 | 0.0006526 | 0.0000367 | |
| 5% Ethane + 95 % Methane | 50 | 0.0001413 | 0.0000074 | 0.0002107 | 0.0000118 |
| 90 | 0.0001775 | 0.0000092 | 0.0002611 | 0.0000147 | |
| 130 | 0.0002228 | 0.0000116 | 0.0003230 | 0.0000182 | |
| 170 | 0.0002710 | 0.0000141 | 0.0003893 | 0.0000219 | |
| 210 | 0.0003165 | 0.0000165 | 0.0004527 | 0.0000254 | |
| 250 | 0.0003571 | 0.0000186 | 0.0005099 | 0.0000287 | |
Table 1: Table for a system containing gas mixture of ethane + methane showing when will be the dew point and adsorption point occur and at what point will the hydrate be formed at a particular temperature, pressure conditions.
Our results clearly suggest that water will prefer to drop out faster as adsorbed on solid surfaces indicating that liquid water drop-out as adsorbed phase onto rust is a dominating route to hydrate formation during pipeline transport of natural gas. It is therefore recommended that similar analysis is conducted for models systems of Iron oxide and Magnetite. A more rigorous dynamic analysis can be accomplished through model systems using Phase Field Theory [18] with solid surface models extracted from Molecular Dynamics simulations [19,20].
Local conditions of temperature and pressure during transport of methane in pipelines on the seafloor of the North Sea involve conditions of methane hydrate formation. Addition of ethane increases the ranges of hydrate stability.
According to Gibbs phase rule and the combined 1st and 2nd law of thermodynamics hydrates formed during transport of gas stream containing dominated by methane but with ethane as additional component are unable to establish equilibrium. As a consequence, the local free energy minimum will determine phase distributions and associated concentrations under constraints of mass and heat transport involved in the phase transition.
In this work we have examined the limits of water mole-fractions in methane/ethane mixtures that can be tolerated before the water drops out as either liquid water droplets (dew-point) or adsorbs on rust (as modeled by Hematite). For pure methane the tolerance limits as estimated from dew-point has been estimated to roughly 18 times higher than corresponding limit for adsorption on Hematite (rust) at 280 K. Similar ratios for 274 K are roughly 19 times. These ratios do not change much by adding ethane, but the tolerance levels for water are reduced compared to the pure methane system.
According to the estimates presented through this work, hydrate risk evaluation should be based on predictions of maximum water content before adsorption on rusty surfaces and dehydration units should be dimensioned accordingly.
https://transplanthair.istanbul
https://hairclinicturkey.co
https://hairclinicistanbul.co
https://besthairtransplant.co
https://hairtransplantistanbul.co