ISSN ONLINE(2319-8753)PRINT(2347-6710)
ISSN ONLINE(2319-8753)PRINT(2347-6710)
Md. Firojuddin Molla1, Jumafuddin Sheikh2
|
| Related article at Pubmed, Scholar Google |
Visit for more related articles at International Journal of Innovative Research in Science, Engineering and Technology
The mid-day meal scheme is the popular name for the school programmed in India. Its provide launch free off cost to school children’s on all working days. The key objectives of the programme to protect the student from the class room hunger, increasing school enrolment and attendance, addressing malnutrition and social empowerment through provision of employment to women’s. This paper attempt to analysis the levels of education in different family size wise, age group wise, and per capita income wise in the study areas. Literacy in the India is key for socioeconomic progress, and the Indian literacy rate grew to 74.04% in 2011 from 12% at the end of British rule in 1947. Although this was a greater than sixfold improvement, the level is well below the world average literacy rate of 84%, and India currently has the largest illiterate population of any nation on earth. Despite government programs, India’s literacy rate increased only “sluggishly” and a 1990 study estimated that it would take until 2060 for India to achieve universal literacy at then-current rate of progress. The 2011 census, however, indicated a 2001-2011 decadal literacy growth of 9.2%, which is the slower than the growth seen during the previous decade.
Keywords |
| Mid-day meal, Literacy, Per capita income |
INTRODUCTION |
| Literacy and level of education are basic indicators of the level of development which achieved by a society .In world scenario Spread of literacy is generally associated with important of modern civilization such as modernization, urbanization, industrialization, communication and commerce. Literacy forms an important input in overall development of individuals enabling them to comprehend their social, political and cultural environment better and respond to it appropriately. Higher levels of education and literacy lead to a greater awareness of society and also contributes in improvement of economic and social attributes. It acts as a catalyst for social upliftment enhancing the returns on investment made in almost every aspect of development effort, be it population control, health, hygiene, environmental degradation control, employment of weaker sections of the society. Today the level of education is positively correlated with a beneficial programme mid-day meal. In India in madras state first time this programme is start in 1925, then in Kolkata 1928, also in nation level the Mid-day Meal Scheme was launched by the Government of India in 1995 and the Cooked Mid-Day-Meal Programme was started in West Bengal in 1100 schools of six districts from January, 2003. This programme is popularly known as a public welfare concept in India. The mid –day meal scheme is the popular name for the school programmed in India. Its provide launch free off cost to school children on all working days. The key objectives of the programme is to protect the student from the class room from hunger, increasing school enrollment and attendance, addressing malnutrition and social empowerment through provision of employment to women’s. This paper attempt to find out the levels of education in different family size wise, age group wise, per capita income wise in the study areas and also shown how Mid-day meal program impact on educational levels. The success of this scheme is illustrated by the tremendous increase in the school participation and enrolment rates in Tamil Nadu ( Sengupta, 2012). |
| Implementation of mid-day meal programme is an incredible attempt of Govt. of India .To enhance literacy rate in rural area, was implemented with objectives of the programme to protect the student from the class room hunger, increasing school enrolment and attendance, addressing mal nutrition and social empowerment through provision of employment to women’s. Literacy is essential for eradicating poverty and mental isolation, for cultivating peaceful and friendly international and for permitting the free play of demographic processes. Various studies have been conducted in India about mid-day meal scheme and studentsâ achievement in schools (Dreze & Goyal, 2003; Dreze & Kingdon, 2001; Khera, 2002; Mondal et al, 2007 etc.). Most of the studies revealed that there exist a positive relationship between mid-day meal program and enrolment and attendance of students in schools including education and health outcomes of students. |
OBJECTIVES |
| Following objectives have been used for the research work are- To examine the impact of mid-day meal programme on education level, to evaluate educational condition of the study area, try to find out the problems of education and school dropouts in different level of the study area, to analyses the demographic profile and Educational status. |
DATA BASE AND METHODOLOGY |
| The data have been collected based on both secondary and primary for the study area. Secondary data have been collected from published and other published organization. The collected primary data have been analyzed into simple percentage, firstly which is categorized into family member based on size of house hold. The primary data collected through the direct field investigation. The field investigation has been conducted with a well designed questioner. A direct interview has been conducted with a person from each sampled household of the Village. Sampled households were selected on the basis of random sampling technique. A total of 50 households have been selected from 129 households on the basis of sampling techniques. |
| The present work has been accomplished with both quantitative as well as qualitative technique. Among the quantitative techniques, both simple and standard statistical techniques have been applied to gather the facts. Simple percentage technique has been used to analyze the socio-cultural and economic status of the households of the study area. |
| Table 1 Demographic profile of the study area, 2013 |
 |
STUDY AREA |
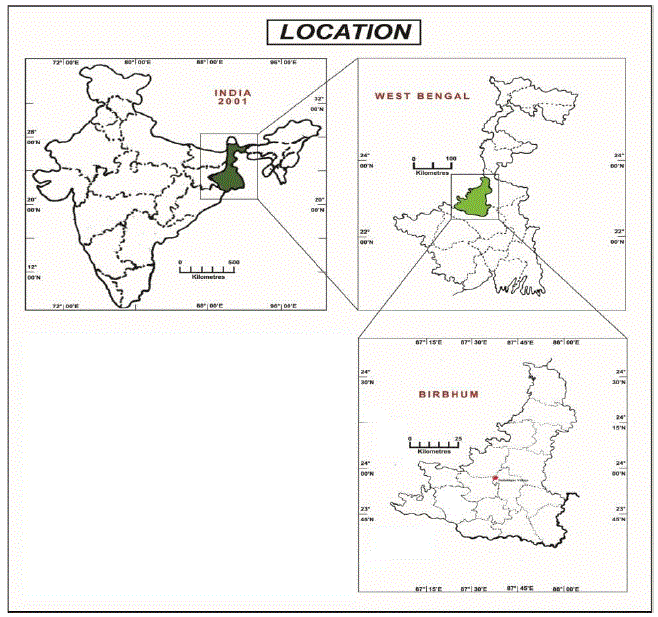
| The village Ballabhpur village is located to the North and North West of Santiniketan about 3.5 km. away from Vishwa Bharati. The geographical location of this village is confined within the latitudes of 230 41’ 54” N and 260 42’ 26” N and longitudes of 870 40’ 07” E and 870 40’ 37” E in the police-station and subdivision of Bolpur, Dist- Birbhum, W.B. This included in the topographical map of survey of India No. 73M/10 and J. L. No. of this mouza is 64. |
 |
| Source: 2001 |
POPULATION STRUCTURE |
| Table: 2 Distribution of population among the sampled households, Ballabhpur Village, 2013 |
 |
| The table 2 reveals that the distribution of population of Ballabhpur Village. It has been counted that 40 percent male and 35 percent female population which belongs to Scheduled Caste category come under the group of less than 3 household sizes. There is no percentage of Scheduled Tribe population comes under the category of less than 3 and 4-5 family size. On the other hand highest percentage Scheduled Tribe population (13.04 percent male and 10.62 percent female) belong to 5-6 category of families. Highest percentage of General population (26.08 percent male and 39.13 percent female) comes under the group of 4-5 family size. |
| By the close observation of this table 2, it have been conclude that most of the families belongs to the scheduled caste and scheduled tribe category in that area. |
| Table: 3 Age-group wise distribution of population among the sampled households, Ballabhpur Village, 2013 |
 |
| Table 3 focused on the age-group wise distribution of population of sampled household. The highest percentage of population (50 percent male and 50 percent female) belong to 18-40 and 40-60 age group which come under the category of less than 3 household size and lowest percentage of population which belongs to less than 6, 16- 18 and more than 60 age group. On the other hand highest percentage of population (33.33 percent) belongs to 6-18 age groups and comes under the 4-5 household size. Another 23.01 percentage of population which has been belongs to less than 6 age groups come under the categories of more than 8 size of household. Highest percentage of population (15.38 percent) which has been belongs to more than 60 age groups and comes under the category of more than 5 size of household. |
| By the close observation of this table 3 it have been conclude that the area is having major percentage of male and female populations belongs to 18-40 and 40-60 years of age group. |
EDUCATION CONDITION |
| Table 4 Educational status among the sampled household, Ballabhpur Village, 2013 |
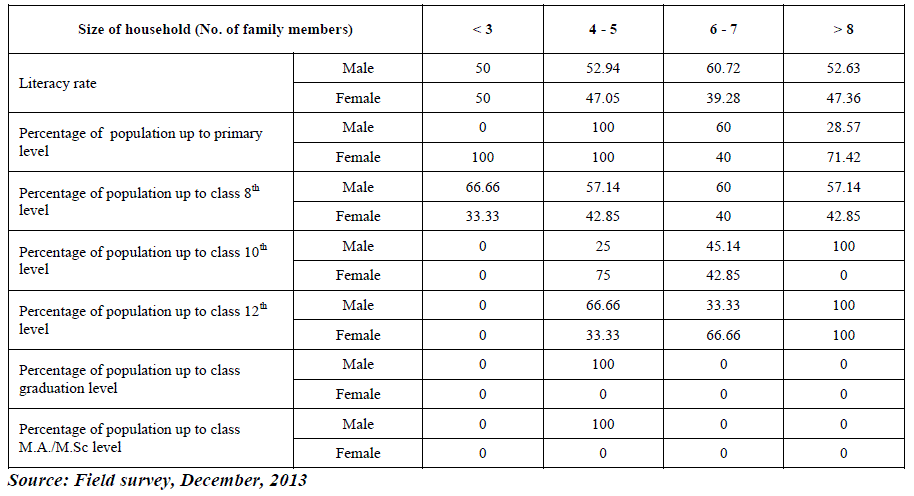 |
| The table 6 reveals that the education status of Ballabhpur Village. Average literacy rate of this village is less than 55 percent; male percentage is 54.02 and female 45.92 percent. The family has 4-5 persons they have higher educated and they carry their qualification up to M.A. / M.Sc. level. The family having four to five of they have high percentage in primary stage but in higher level educated percentage is very low. In this category 60.72 percent male and 39.28 percent female are literate. Another 52.63 percent male and 46.36 percent female literate people come under the category of more than five family members. By the close observation it has been identified that most of the male persons are preferred to give education by their parents than the female. The population has rarely got the opportunity to go the school or college. After the analysis it can evaluate that the education condition of Ballabhpur Village is very poor. Peoples are unable to bear as their education purpose due to poor economic condition. |
ECONOMIC CONDITION |
| Table: 5 Income distributions among the sampled households, Ballabhpur Village, 2012 |
 |
| The income level is depicted by the table 5 which shows that highest per capita income has Rs. 1650 and lowest per capita income is Rs. 860 which comes under the category of 4-5 and 6-7 size of household. More than 50 percent of households as their per capita income have Rs 500-900 under the category of 6-7 and their average per capita income is Rs. 860. Another 50 percent household belongs to under the category of 4-5 and their average per capita income is Rs. 1650. Average per capita income Rs. 1050, which have comes under the group of less than 3 family members of household. In category which comes under group of more than 5 members in a family have average per capita income is Rs. 860. Apart from the analysis it has been identified that economic condition of Ballabhpur Village is very poor due to lack of source and employment facilities. |
RESPONDENTS OBSERVATION |
| Table 6 Respondents Observation for Mid-day Meal Programme among Sampled House Hold, Ballabhpur Village, 2013 |
 |
 |
| Table 6 and figure reveals that the respondent’s observations for Mid-day Meal programme of selected study area. It has been identify that 80 percent respondents view is positive about Mid-day Meal programme. According to their view is that Mid-day meal programme increasing literacy level, on the other hand only 20 percent respondents’ view is negative about Mid-day Meal programme and according to their observation is no effect of Mid-day Meal programme on primary education system. Another 72 percent respondent’s observations about Mid-day meal programme increase children school attendance is positive but on the other hand only 28 percent respondents does not believed that the Mid-day meal programme increase children school attendance. It has been also identify that the 60 percent respondents believed on constraints of mass education and the other hand 40 percent respondents does not believed on constraints of mass education. About ways of overcoming 30 percent respondents view is positive on the other hand 70 percent negative respondents identified. So it has been conclude that Mid-day Meal programme is use full tools for the increase of school attendance children. |
 |
| Table 7 depicts that the mother education condition of the selected study area, this is to identify that the only 20 percent mother’s education qualification is up to class 10th level which come under the group of less than 3 family members on the other hand 100 percent up to primary level which come under the group of 4 – 5 family members. It has been also identify that 89 percent education qualification is up to class 8th level which come under the group of 4 – 5 family member on the other hand 40 percent up to class 12th level which also come under the same group. Another 60 percent education level up to 12th which come under the group of 6 – 7 family members on the other hand only 20 percent come under the group of more than 8 family members and their education level is up to 10th. |
| Table 8 Fathers Education Condition of Ballabhpur Village, 2013 |
 |
| Table 8 depicts that the father education condition of the Ballabhpur Village, this is to identify that the only 25 percent father’s education qualification is up to primary level which come under the group of less than 3 family members on the other hand 29 percent up to class 8th level which come under the same group. It has been also identify that 100 percent education qualification is up to class graduation level which come under the group of 4 – 5 family member on the other hand only 33 percent up to class M.A. / M.Sc. level which also come under the same group. Another 33 percent father’s education level is up to M.A. / M.Sc. which come under the group of 6 – 7 family members on the other hand 34 percent come under the group of more than 8 family members and their education level is up to same level. |
CONCLUSION |
| After go through the study it has been concluded that the Mi-day Meal programme helped to increase the school attendance children in primary level. So, it may be mention that the quantity of the school attendance children in primary level is increases but quality of the students falling down due to lack of management of this concerned programme. For, suitable utilization this programme Government should be makes proper rules and regulation, and also all the parents to be concerned about this programme and teacher must be maintain the above condition properly for sustainable education development. |