Faculty of Mathematical Sciences and Statistics, Department of Statistics and Actuarial Science, Elneelain University, Khartoum, Sudan
Received: 29/08/2015 Accepted: 20/11/2015 Published: 30/12/2015
Visit for more related articles at Research & Reviews: Journal of Statistics and Mathematical Sciences
A common problem encountered in statistical analysis is that of missing data, which occurs when some variables have missing values in some units. The present paper deals with the analysis of longitudinal continuous measurements with incomplete data due to non-ignorable dropout. In repeated measurements data, as one solution to a such problem, the selection model assumes a mechanism of outcome-dependent dropout and jointly both the measurement together with dropout process of repeated measures. We consider the construction of a particular type of selection model that uses a logistic regression model to describe the dependency of dropout indicators on the longitudinal measurement. We focus on the use of the Diggle-Kenward model as a tool for assessing the sensitivity of a selection model in terms of the modeling assumptions. Our main objective here is to investigate the influence on inference that might be exerted on the considered data by the dropout process. We restrict attention to a model for repeated Gaussian measures, subject to potentially non-random dropout. To investigate this, we carry out an application for analyzing incomplete longitudinal clinical trial with dropout by using a practical example in the form of a multi-centre clinical trial data.
Incomplete longitudinal data, Selection model, Diggle and Kenward model, Dropout, Missing not at random (MNAR)
A typical characteristic of longitudinal studies is that study subjects are measured over repeated time intervals. The dropout of subjects along the time scale is common. The dropout process is assumed to be stochastic in nature and generally dependent upon the observed or unobserved outcomes. It also may depend upon covariates, such as the treatment arm an individual is allocated to. The dropout may be regarded as a “failure” outcome in certain limited settings. Of prime concern to this study, is the more general situation that characterizes the statistical behavior of the original outcome, while dropout is treated as a “nuisance” occurrence that must be tolerated. As a result of this, the distinction between the outcome and the dropout processes needs to be simul-taneously maintained. Rubin [1] and Little and Rubin [2] introduce different mechanisms for denoting dropout or non-response. A dropout, or non-response, process is said to be missing completely at random (MCAR) if the non-response process is a random event independent of both unobserved and observed outcomes, missing at random (MAR), if conditional upon the observed outcomes, the non-response process is independent of the unobserved outcomes, and missing not at random (MNAR) when the non-response process depends only upon the unobserved outcomes.In the context of likelihood and Bayesian inferences, and when the parameters describing the mea-surement process are functionally independent of the those describing the non-response process,MCAR and MAR are ignorable, while a non-random process is non-ignorable [1,2]. When data are MNAR, the missingness cannot be ignored from the analysis. In this case, the longitudinal measurement process and the missingness indicators may be considered jointly [3].
It is possible to consider more general models when one assumes random missingness mechanismto be untrue [4-8].These belong to the so-called selection models family [2]. A selection model factors the joint distribution of the measurement and dropout mechanism into two parts, that is, a marginal measurement model that describes the distribution of the underlying complete data, and a dropout mechanism that describes the distribution of the missing data indicators, conditional upon the complete data. For more details, see, for example, Diggle and Kenward [5] and Verbeke and Molenberghs [9]. This is intuitively appealing since the marginal measurement distribution would be of interest also with complete data [3]. Furthermore, the missing data mechanisms (MCAR, MAR and MNAR) are most easily developed within the selection setting. However, it is often argued, especially within the context of non-random missingness model, that selection models, although identifiable, should be approached with caution [10]. Indeed, one has to make untestable assumptions about the missing data process. Selection models originated from the Tobit model of Heckman [11].The theoretical translation from the Heckman’s model to Diggle and Kenward’s selection model have been addressed by Verbeke and Molenberghs [9]. Diggle and Kenward consider a selection model for the study of a longitudinal measurement when data are MNAR by letting the probability of dropout depend on the possibly unobserved measurements. They use a linear mixed model for the longitudinal measurement and logistic regression model for the dropout process to describe the dependency between dropout indicators and measurements. The dropout indicators are used to indicate participant dropout. However, the intermittent missing data is assumed to be missed at random, and it can be ignored in the model. For alternatives for the missing data processes, see, Molenberghs and Kenward [3].
An earlier work on the selection model analysis is given by Heckman and Glynn et al. Selection models that are applied to the regression analysis of categorical variables with outcome subject to non-ignorable non-response are applied by Baker and Laird [12], while Robins et al. [13] used a selection perspective for the conditional expectation model in a semi-parametric approach. For the ignorable non-response hypothesis, Robins and Gill [14] proposed a general class of selection models under non-monotone missing data pattern. In the case of the selection models for repeated measurements, sensitivity of the conclusions to the assumptions about the dropout mechanism has been illustrated by Kenward [15]. A semi-parametric approach of missing data mechanism is proposed by Scharfstein et al. [16] in order to avoid the impact of the parametric missing data specification in a selection model perspective. With regard to the non-monotone pattern, selection models have been extended by Troxel et al. [17]. In addition to Troxel’s work, within the selection model framework, models have been proposed for non-monotone pattern as well, for instance, see, Jansen and Molenberghs [18]. In the context of categorical and other types of measure, in many examples, see, Fitzmaurice et al. [19] and Nordheim [20], the selection models were also developed. Additionally, a number of proposals have been made for non-Gaussian outcomes, see, Molenberghs and Verbeke [21]. Further details in selection models can be found in Robins et al. [22], Rotnitzky and Robins. [23] ,Robins et al. [24] (1998), Verbeke and Molenberghs [9,13] and Molenberghs and Kenward [3].
This paper deals with the analysis of longitudinal data when there are non-ignorable dropouts. We illustrate this analysis by considering the problem of missing data that occurs with a continuous outcome. We focus on the use of the Diggle and Kenward’s [5] model as a tool for assessing the sensitivity of a selection to the modeling assumptions. We restrict attention to a model for repeated Gaussian measures, subject to where dropout possibly depends upon missing outcomes, i.e., MNAR. A monotone missing pattern has been constructed in the model. Similar to Diggle and Kenward, a selection model is specified that uses a logistic regression model to describe the dependency of missing data indicators upon the longitudinal response. In the current application, we modify the analysis software to accommodate the case of more than two treatment arms as a computational extension. Our main objective here is to investigate the influence that might be exerted on the considered data by the dropout process. In order to investigate our objective, we carry out an application for analyzing incomplete longitudinal data with dropout. We outline the fitting of the selection model which is based on the linear mixed model for the measurement process as well as a logistic regression for dropout process. The model was fitted using standard statistical software (SAS version 9.2, IML macro). This is done by using a practical example in the form of a multi-centre clinical trial data. The remainder of the article is organized as follows: the data setting and modeling framework are introduced in Section 2. In Section 3, a background for the selection model is provided, followed by descriptions of the selection model based on Diggle and Kenward model frameworks as well as detailed discussion of the linear mixed model and dropout model. In Section 4, we present an application including a description of the data set used in the analysis. The results of the estimation of the model are then described in Section Results. We conclude with a discussion of the results in Section Discussion and conclusion.
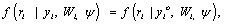
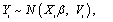
To introduce some necessary notation, we follow the terminology provided by Verbeke and Molen-berghs and Molenberghs and Kenward based on the standard modeling frameworks of Rubin (1976) and Little and Rubin [25]. So, assume that for each independent subject i = 1 …, N in the study a sequence of responses Yij is designed to be measured at a fixed set of occasions j = 1, …,n. The outcomes are grouped into a vector Yi = (Yi1, …,Yin)′. It is often neces-sary to split the outcome vector Yi into two subvectors, Yio and Yim , indicating the observed and missing components, respectively. Additionally, one can define an indicator Rij, for each occasion j as follows: Rij=1, if Yij is observed, and Rij =0 if not. The indicators of missing data (Rij) can be grouped into a vector Ri which is of parallel structure to Yi. The processes generating the vectors Yi and Ri are referred to as the measurement and missing data processes, respectively. We now pay attention to the dropout setting which is a particular case of monotone pattern of missingness in which a missing value whenever it occurs to any subject in the sequence of repeated measurements of the outcome is never followed by any observed measurement on that subject. Alternatively, when dropout occurs, one could use a scalar variable Di called the dropout indicator, rather than the missing data indicator Ri, defined as  , indicating the occasion at which dropout occurs.Next, we consider the density of the full data (Yi, Ri), denoted by
 (1)
(1)
where Xi and Wi are covariate matrices for the measurement and missing data mechanism, respec-tively, and the parameter vectors and ψ describe the measurement and missingness processes, respectively. The taxonomy, constructed by Rubin [1] and Little and Rubin [25], is based on the following factorization
 (2)
(2)
where the first and second factors denote the marginal density of the measurement process and the density of the missing data process, conditional upon the outcomes, respectively. Factorization(2) forms the basis of selection modeling as the second factor corresponds to the self-selection of individuals into observed and missing groups. Using the reversed factorization, an alternative taxonomy which can be considered is called pattern mixture models. They have the following form
 (3)
(3)
In fact, equation (3) can be described as a mixture of different populations, characterized by the observed missing data pattern. An initial attention of these models were provided by Little and Rubin [2] and Glynn et al. [10], while further attention later was provided by many authors, see, for example, Little [26,27]. As we mentioned above, Rubin’s taxonomy of missing data process is based on the second factor of equation (2), thus within the selection modeling framework
 (4)
(4)
In equation (4), the covariates for the measurement process are assumed measured but suppressed for simplicity sake. The form in equation (4) can be discussed as follows: when the missingness process is independent of the responses, i.e.,
 (5)
(5)
then the process corresponds to the case of missing completely at random (MCAR). If the miss-ingness process is only independent of the unobserved responses Yim, but depends on the observed responses Yio, consequently, assuming the form
 (6)
(6)
then the process corresponds to the case of missing at random (MAR). Finally, when the missingness process depends on the missing data Yim, the process corresponds to the case of missing not at random (MNAR). As pointed out by Rubin and Little and Rubin, when MAR mechanism holds, the parameters θ and ψ are functionally independent. In practice, the likelihood of interest then depends upon the factor  For this reason, when using a likelihood based analysis under the MAR assumption, the missing value mechanism is sometimes said to be “ignorable”. By contrast, if the likelihood of interest only depends upon the factor
  , then this is referred to as “non-ignorable” setting. Therefore, when ignorability holds, likelihood-based and Bayesian inferences are valid [9,27].
In the framework of the selection models, it is not always reasonable to assume that MAR holds, and a wide range modeling approaches for MNAR data have been proposed. One such is the model proposed by Diggle and Kenward [5] for continuous outcomes with dropout. In this section, we first describe the Diggle and Kenward’s selection model for continuous longitudinal data. We then discuss in detail the linear mixed model and the dropout model.
Diggle and Kenward’s model for continuous longitudinal outcomes
A model for longitudinal Gaussian data with non-random dropout have been proposed by Diggle and Kenward [5].Their model assumes that the missingness mechanism is MNAR which combines the multivariate normal model for longitudinal Gaussian data with a logistic regression for the dropout process. From the notation presented in Section (2) recall that for subject i, i = 1, ..., N, a sequence of responses Yij is designed to be measured at time points tij , j = 1, ..., n, resulting in a vector of observed outcomes Yi = (Yi1, ..., Yini )′ of measurements for each subject.
Note that although n measurements per subject were planned the vector Yi is of size ni < n because of missing observation. In the case of dropout, the complete Yi is only partially observed. If we let Di be the occasion where dropout occurs, then Di > 1, and Yi can be partitioned into the ( Di −1)-dimensional observed component  and the (ni −Di + 1)-dimensional missing component
  . If no dropout occurs, we let Di= ni + 1, and Yi equal . For the ith subject, the observed data is (yio,di ) , thus, the likelihood contribution is proportional to the marginal density function.
 (7)
(7)
In equation (7), a marginal model for Yi can be combined with a model for the dropout process, conditional upon the measurement, and the measurement process model, including the vectors of unknown parameters, θ and ψ, respectively. More formally, we denote the conditional probability of dropout by gj (yij, hij) at time j given the response at time j, and hij = (yi1, ..., yij-1) which denotes a possibly observed history of subject i until time ti,j-1. According to Diggle and Kenward, the dropout process allows the conditional probability for dropout at occasion j, given that the subject was still observed at the previous occasion, to depend upon the history hij and the possibly unobserved current outcome yij, but not upon future outcomes yik, k > j. Now, for calculating the dropout probability for each occasion, we use the conditional probabilities 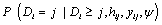 which can be expressed as follows:

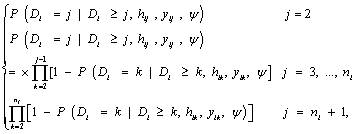 (8)
(8)
assuming no missing values at occasion j = 1. As mentioned above, Diggle and Kenward combine a multivariate normal for the measurement process together with a logistic model for the dropout process. To obtain parameter and precision estimates from the combined measure-ment/dropout model, they use maximum likelihood that involves marginalization over the unobserved components, i.e., yim. In fact, under repeated measurements for the ith subject, the mea-surement model assumes that the vector Yi satisfies the linear regression model  , where i = 1, ...N, in which β is a vector of population-averaged regression coeffcients. Further, Verbeke and Molenberghs [9] pointed out that the matrix Vi can be left unstructured or as-sumed to be of a specific form, for example, resulting from a linear mixed model, a factor-analytic structure, or spatial covariance structure. As Molenberghs and Kenward [3], there is some advantages to using an unstructured covariance matrix. Following, we introduce the measurement and dropout models that can be combined for the dropout process.
For continuous outcomes, Laird and Ware [28] proposed linear mixed-effects models, and they can be written as follows
 (9)
(9)
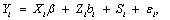
where Yi is the ni-dimensional response vector for subject i, 1 ≤ i ≤ N, N is the number of subjects, Xi and Zi are (ni × p) and (ni × q) known design matrices, β is the p-dimensional vector containing the fixed effects, bi ~ N(0, G) is the q-dimensional vector containing the random effects. The residual components εi ~ N(0, σ2Ini), and b1, ..., bn, ε1, ..., εn are assumed to be independent. The serial correlation is captured by the realization of a Gaussian stochastic process, Si which is assumed to follow a N(0, τ2Hi) law. Here, the serial covariance matrix Hi dependent upon i through the number n of observations and through the time points tij at which measurements are taken. Using autocorrelation function ρ(tij − tik), the structure of the matrix Hi is determined. A first simplifying assumption is that Hi depends upon the time interval between two measurements Yij and Yik, i.e., ρ(tij − tik) = ρ(u), where u = |tij − tik| represents the time lag. The autocorrelation function decreases such that ρ(0) = 1 and ρ(u) → 0 as u → ∞. Finally, G is a general (q × q) covariance matrix with its (i, j) element given by dij = dji. The random effects in model (9) stem from heterogeneity between subjects, in the sense that various aspects of their behavior may exhibit inter-subject random variation. It follows from model (9) that, given the random effect bi, Yi is normally distributed with mean vector Xiβ +Zibi and covariance matrix Vi. Thus, after integrating over random effects, inference for the marginal distribution of the outcome Yi, can be written as follows
 (10)
(10)
where 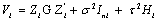 is a
is a  covariance matrix which combine both the measure-ment error and serial components. On the other hand, to include various fixed effects, a random intercept, and allowing Gaussian serial correlation, a linear mixed model is used for the measure-ment model process. In this case the covariance matrix Vi becomes
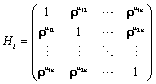
where σ2 > 0 and 0 ≤ ρ ≤ 1. The covariance structure Vi in equation (11) combines both serial autocorrelation and a shared random effect variance in the estimation. The main problem with this approach, which is due to Diggle and Kenward, is that it assumes stationary. In practice, if times of measurement are common, the unstructured matrices can be used (aside from very small trials) and for unbalanced times, a random coefficient model.
As noted previously, we focus only on incompleteness due to dropout, and thus we assume that the first measurement Yi1 is measured for all subjects in the study. In agreement with notation introduced in Section 2, the selection model arises when the joint likelihood of the measurement process and the dropout process is factorized as follows
 (12)
(12)
We use the linear mixed-effects model introduced in equation (9) to model the measurements process, together with a logistics regression to describe the dropout process. According to Diggle and Kenward, the model for dropout process is based on a logistics regression for the conditional probability of dropout at occasion j, given the subject is still in the study. Again, the gi (yij, hij) denotes this probability of dropout at time j, in which hij = (Yi1, Yi2, ..., Yij−1) is a vector possibly containing all observed measurements up to including occasion j-1, as well as relevant covariates, in the conditional probability of dropout model. Modeling the dropout mechanism may be simplified by allowing dropout to depend upon the current measurement and immediately preceding measurement only with corresponding regression coefficients, i.e., ψ1 and ψ2. A commonly used version of such a logistic dropout model is
 (13)
(13)
where ψ0 and ψc denote the intercept and the vector of parameters for covariates Wi, respectively.
The model in equation (13) contains special cases corresponding to MAR and MCAR mechanism that can be obtained from ψ2 =0 or ψ1= ψ2=0, respectively. As pointed out by Diggle and Kenward and Verbeke and Molenberghs, a likelihood ratio test (LRT) can be used to compare the model fit under a model that assumes the missing data due to dropout are MCAR versus MAR, that is, the LRT for MCAR versus MAR has an approximate χ12 distribution. The LRT statistic is used to test the hypothesis of ψ2 = 0 (i.e., MAR), where dropout is no longer dependent upon the current measurement, and similarly to test the hypothesis of ψ1= ψ2=0 (i.e., MCAR), where dropout is assumed to be at random, the dropout therefore, does not depend upon the outcome altogether. However, the use of the LRT is inappropriate for hypothesis test for MNAR versus MAR when all the other modeling assumptions hold, due to the fact that the behavior of the LRT statistic for the MNAR parameter ψ2 is non-standard, since the availability of the information on ψ2 is very rare and interwoven with other features of both measurement and dropout models [4]. In addition, Rotnitzky et al. [29] illustrated that the limiting distribution is a χ2 mixture with characteristics controlled by the singular information matrix. Therefore, for the ψ2 associated with MNAR model, the score equation creates a quasi-linear dependence structure in the system of score equations. This issue is studied in detail by Jansen et al., while, in the context of an onychomycosis study, Verbeke et al. have stated that excluding a small amount of measurement error can change drastically the LRT statistic for the MAR null hypothesis, see also for example, Verbeke and Molenberghs. In practice, such a distinction (MAR/MNAR) can only be made using untestable modeling assumptions such a distributional form, see, Kenward [29]. This problem is really laid bare in Molenberghs et al. [30] which shows that the formal-based distinction between MAR and MNAR is not possible as for any MNAR model there exists an MAR model that fits the data equally well. The similarity of the MAR and MNAR models with respect to fitting to the observed data, may present different predictions of the unobserved outcomes, conditional upon the observed ones. Hence, it is broadly agreed that the role of such MNAR models is in sensitivity analysis, that is if the assumptions are changed, the conclusions from the primary (typically MAR) analysis are also changed. Further detail on the precise nature of sensitivity analysis can be found in Molenberghs and Verbeke [21] and Molenberghs and Kenward [3].
Below we describe the data set that is used in the analysis as well as the application schemes that are used in the analysis of the selection models based on Diggle and Kenward approach. In terms of the application of the statistical techniques considered in this study, we use the statistical software, SAS programme.
The example that is used here concerns the analysis of repeated measures designs and demonstrates how to investigate a specific scenario based on dealing with longitudinal data that has a nonignorable dropout mechanism. The data is based on experiments that rely on the split-plot design assumptions. Such experiments which include repeated measures designs have structures that involve more than one size of experimental unit. In this case, a subject is measured over time where time is one of the factors in the treatment structure of the experiment. By measuring the subject at several different time occasions, the subject is essentially being (split) into parts (time intervals), and the response for each part is measured. The larger experimental unit is the subject or the collection of time intervals which constitute a cluster. The smaller unit is the interval of time during which the subject is exposed to a treatment or an interval just between time measurement. The only departure from the classical split-plot assumptions is because in this case the subplot treatments (time intervals) are not randomized. The data used is from a multi-centre experiment data which is a typical longitudinal example. The data used here is described and reported in Milliken and Johnson [31]. This example considers an experiment that involves three drugs where each subject was measured repeatedly at three different time points (j = 1, 2, 3), where the outcome is described only as a measure of a continuous blood component. The data were collected by three different investigators (or in three different centres) and contains fifty-one patients. There are seventeen patients assigned to each drug. All of the fifty-one patients were observed at the first occasion, whereas only eight and ten patients were not seen at the third occasion and at both the second and third occasions, respectively. In Table 1, we present the numbers of dropouts by time, centre and drug. The dropouts occur for all drugs and centres. It is clear that drug2 contains more percentages of missing values. The observed data for all subjects are shown in Figure 1. The main purpose of this experiment has been to estimate the effects of the drugs on the blood component over time, as well as to investigate the relationship between drugs and blood component. In this study, we restrict attention to the influence that might be caused on these effects by the dropout mechanisms as well as to examine which dropout mechanism better describe the data. The full results of the analysis of this trial using a likelihood based linear mixed models approach have been reported elsewhere by Milliken and Johnson.

Table 1: Numbers of dropouts in the multi-centre trial.

Figure 1: Multi-centre data. Observed data for all subjects.
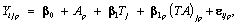
To apply the selection models due to Diggle-Kenward model based on continuous longitudinal data, in the current computations, we modified the SAS macro that was reported in Dmitrienko et al. [32] that maximizes the log-likelihood for the model using PROC IML to the case of three drugs as opposed to most application which are based on two drugs. We carried out an application to the above modeling strategy to the multi-centre data as earlier described. We fit the Diggle and Kenward model in accordance with the MCAR, MAR and MNAR assumptions to our own data set. The three post-baseline visits correspond to the measurements taken at times 1, 2 and 3. In the linear mixed model in equation (9), we allow the inclusion of a variety of fixed effects, a random intercept, and Gaussian serial correlation. Furthermore, the dropout model in equation (13) is considered, assuming that the dropout does not depend upon the covariates. Apart from the explicit MCAR, MAR, and MNAR versions of this model, we will also conduct an ignorable analysis (that is, an analysis based on the measurement model only, ignoring the dropout model). Firstly, we fit a linear mixed model (LMM) of the form in equation (9) in order to obtain initial values for the parameters estimation of the measurement model. Assuming that the first measurement Yi1 is observed for every subject in the study. We thus assume a linear time trend of the response within each drug group. This implies that each profile can be described using two parameters, namely the intercept and a slope. The error matrix is chosen to be of the form (11). Since the multi-centre trial data contains fifty-one subjects (i = 1, ..., 51) observed at three time points (j = 1, 2, 3) for three drugs (p = 1, 2, 3), the model can be written as follows
 (14)
(14)
where Yijp is the blood component of subject i at time j on drug p, Ap denotes the pth drug effect,
Tj denotes the jth measurement time effect, (AT)jp denotes the interaction effect between time and drug, and  where
where 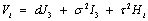 with
with
Using the set to zero constraint (A1=0),β0 is the intercept for the drug1 group, (β0 + α2) is the intercept for the drug2 group, and for drug3, the intercept is (β0 + α3), where denotes the fixed effects. These are, respectively, referred to as β01, β02 and β03 in the results, as we will see in Tables 2 and 3. The slopes are β1, (β1 + β12) and (β1 + β13) for drug1, drug2, and drug3, respectively, referred to as β11, β12 and β13 in the results presented in Tables 2 and 3. The SAS PROC MIXED with REPEATED statement can be used to obtain the initial values. In conforming to the model introduced in equation (13), we use the following logistic regression model for the dropout model probabilities.

Table 2: Multi-centre data. Parameter estimates of the linear mixed model, used as initial values for the Diggle-Kenward model.

Table 3: Multi-centre data: Maximum likelihood for the parameter estimates (standard errors) under MCAR, MAR, and MNAR assumptions without covariate in the dropout model.
where ψ1 and ψ2 denote the logistic regression coefficients for current and immediately previous observations, respectively, and j denotes the time points. In practice, the combined model for measurement and dropout can be fitted to the data using a generic function maximization routine in the maximum likelihood [15]. In doing so, Diggle and Kenward used the simplex algorithm of Nelder and Mead [32] to maximize the log-likelihood. However, for the same purpose, we use another optimization method that is available in SAS software, so-called Newton-Raphson ridge optimization. For more detail of this method, see, Dmitrienko et al. [33] Therefore, we use SAS IML macro which maximizes the likelihood for the model, so as to fit the selection models for the dropout process. The results of initial values for the parameter estimates of the logistic dropout model can be obtained as in Table 4.

Table 4: Initial values for the parameters of the dropout model.
Next, we introduce the results of the application that was discussed earlier. The initial values for the parameters of the linear mixed model are listed in Table 2. The results of maximum likelihood for the parameter estimates (standard errors) from the measurement model, as well as the results of the variance model under the three missingness mechanisms are presented in Table 3. Examining these results, we see that as expected, the parameters estimation and corresponding standard errors of the fixed effects of the measurement model and the variance model were the same under ignorability, MCAR and MAR mechanisms. This confirms what is expected in theory, see, Molenberghs and Kenward, for example. We now study factors that influence dropout. As discussed above we fit the three dropout models in turn, under the mechanisms MCAR (ψ1= ψ2=0), MAR (ψ2 = 0), and MNAR, respectively. Table 5 shows the results of the three dropout models that were considered. Here, the evidence for the MNAR setting is only borderline. Thus, under the MNAR assumption, the maximum likelihood estimates for ψ1 (-0.29) and ψ2 (0.30) were more or less equal, but with opposite signs, pointing to a relationship between the incremental change and probability of dropout. This finding agrees with the theoretical findings of Molenberghs and Kenward, noting that the dropout often depends upon the increment yij - yi, j-1. This can be justified by the fact that two subsequent measurements are usually positively correlated [34-36]. Furthermore, as can be seen in the dropout model, the parameter estimate (ψ2 = 0.30) in our model is positive, indicating a strong association between the dropout and the increment in the outcome variable (blood component) between two successive times. In addition, as mentioned previously, the maximum likelihood estimates of ψ1 and ψ2 have different signs, and furthermore, although there is a strong positive association between ψ1 and ψ2 , the likelihood based 95% confidence interval for these two parameters (ψ1,ψ2) is largely contained in the negative-positive quadrant, that is, the intervals for the parameter space where ψ1 < 0 and ψ2 > 0. The full dropout model estimated from the MNAR process is as follows:

Table 5: Dropout model: Comparison of the Parameter estimates (standard errors) for MCAR, MAR and MNAR models.
 (16)
(16)
One of our interests is to investigate whether the dropout process is MAR or MCAR, in other words, whether or not ψ1 = ψ2 =0 in equation (15). The likelihood ratio test is used to compare model fit under a model that assumes the missing data due to dropout are MCAR versus MAR. The maximum likelihood parameter estimates and minus twice the maximized log-likelihood from the MCAR, MAR and MNAR models appears in Table 3. Comparing the log-likelihood estimates from the MAR and MCAR models, we see that the likelihood ratio for the null hypothesis ψ1 = ψ2=0 is 596.99-591.43=5.56 which is significant with p < 0.01 on 1 degree of freedom. The test suggests that an MAR dropout process cannot be ruled out, i.e., there is an evidence in favour of the MAR, that is, dropouts are not completely at random in the context of the assumed model. Further, the test also support MAR over MNAR as the LRT statistics is 1.43 which is not significant. However, great care has to be taken regarding the sensitivity of the MNAR model to modeling assumptions fit here. From the dropout model in equation (15), it is possible to extend the model by using more observed outcomes. According to Diggle and Kenward [5] and Molenberghs et al. [34], the dropout in the non-ignorable models tends to depend upon the increment (i.e., the difference between the current and previous measurements, yij-yi, j-1). Including this effect implies a switch to the MAR framework. Some insight into this fitted model can be obtained by rewriting it in terms of the increment. In our case, we obtain the following
 (17)
(17)
which indicate that dropout is related to the increment yij-yi, j-1, rather than to any of the actual observations yij or yi, j-1, and such that individuals that improve most (large increments) are very likely to dropout from the study. On the other hand, it is useful also to rewrite this with respect to the increment and the sum of the successive measurements. Thereby, by rewriting equation (15), the fitted dropout model equals
 (18)
(18)
where  The parameters ν1 and ν2 represent dependence on level and increment in the outcome (blood component), and these quantities are likely to be much less strongly correlated than yi,j and yi, j-1. Thus from the fitted MNAR model in equation (18), we have
 (19)
(19)
which is to say that the probability of dropout increases with larger negative increments. In the other words, those patients who showed or would have shown a greater decrease in the overall level of the blood component from the previous time have a higher probability of dropout. This is said, given the fact that those patients who have a large improvement compared with the previous time and, a sudden shift in profile, are more likely to drop out of the study.
In terms of the significance of the drug effects, the corresponding p-values are displayed in Table 6.

Table 6: Multi-centre data: p-values for drug effects under MCAR, MAR, and MNAR assumptions.
The p-values of the drug effects at the first point in time does not change much, it being significant in all three cases. However, for all cases, the p-values of the drug2 effects were not statistically significant. It is clear from the different dropout models that the drug effects do not differ to a large extent, the impact caused by drugs might be only on the dropout rate through their effects on the blood component. This is similar to the results from Diggle and Kenward which stated that the drug effects should be made directly into the dropout model, either by using it as constants or allowing the relationship between dropout and outcome to differ between the drugs.
In this paper we have discussed the performance of the selection models based on Diggle-Kenward approach in terms of the analysis of longitudinal continuous measurements with incomplete data when there are dropouts missing not at random. We considered the use of the Diggle and Kenward [5] model as a tool to assess the sensitivity of a selection model with regard to the modeling assumptions. A model for repeated Gaussian measures, subject to a possibly MNAR assumption were considered. However, a monotone missing pattern was constructed in the model, that is, if a subjects observation was missing for a particular time point, then all subsequent data for that subject was also to be deleted. Similar to Diggle and Kenward, a selection models is specified that uses a logistic regression model to describe the dependency of missing data indicators on the longitudinal measurement. In particular, we have investigated the influence on inference that might be caused of the data by the dropout process. In doing so, we carried out an application for analyzing incomplete longitudinal data with dropout. The model was fitted by using an example from a multi-centre clinical trial data. The application notably reveals that dropout increases with one element, i.e., large increments. This implied an occurrence of unfavorable values at the previous time. In fact, this case is, in practical terms, very common in fitting selection models of Diggle-Kenward, we refer to, Verbeke and Molenberghs, Diggle and Kenward, and Molenberghs et al. Our findings were similar to those of Verbeke and Molenberghs, Diggle and Kenward, and Molenberghs et al. [31] in that the example followed in the study yielded parameter estimates for the dropout model that present different signs for current and previous observations, indicating the relationships between incremental changes and the probability of dropping out. The results further suggest that there is an evidence in favour of the prevalence of an MAR process rather than an MCAR process in the context of the assumed model. However, Verbeke and Molenberghs, Molenberghs and Verbeke, and Diggle and Kenward advise one to take care in interpreting the evidence for such conclusions, using only the data under analysis. On the other hand, when all the other modeling assumptions can be guaranteed to hold, the use of the LRT, in a well-defined sense, is inappropriate for hypothesis test for MNAR versus MAR [4]. This is certainly true for the model based on Diggle and Kenward who investigated the tests of MAR null hypothesis against MNAR, but it is important to note that their tests are conditional on the alternative model holding. In practice, such a distinction can only be made using untestable modeling assumptions such a distributional form, see, Kenward.This problem is really laid bare in Molenberghs et al. which showed that for any MNAR model there exists an MAR model that fits the data equally well. Further, they stated that it is not possible to use fit of an MNAR model for or against an MAR model, unless one puts a priori belief in the posited MNAR model. In other words, as the original MNAR model, the MAR model can give the same estimates of predictions to the observed data, and depending on the same parameter vector. This in line with previous study conducted by Gill et al. [35] For more discussions of examination the differences between an MNAR model and its MAR counterpart, we recommend Molenberghs et al. and Kenward [36] articles. Hence, it is broadly agreed that the role of such MNAR models is in sensitivity analysis that is if the assumptions are changed, the conclusions from the primary (typically MAR) analysis are also changed, as the nature of sensitivity comes due to the non-verifiability in the MNAR model from the data. Finally, in line with previous studies, for example, Verbeke and Molenberghs, Molenberghs and Kenward, Kenward and Molenberghs, and Molenberghs et al. [37], the selection model of Diggle and Kenward is viewed as a member of the sensitivity analysis framework. An alternative approach to modeling incomplete longitudinal data under a non-ignorable assumption has frequently been proposed in the literature are the pattern mixture [38].
There is also what is known as (influence tools) to deal with incomplete longitudinal data with nonignorable missingness and these are useful for detecting subjects that cause non-ignorable dropout, as well as other subjects that lead to non-random missingness. Here, we note that the scope of this study is limited to selection models based on Diggle-Kenward model, the other approaches are not included in this article. On the other hand, in order to assess sensitivity it is useful to obtain further insight into the data by comparing both the selection and the pattern mixture models, for instance, see, Kenward and Molenberghs and Molenberghs et al. [38]. While it is not the focus of our current study, sensitivity analyses are an important issue of modeling incomplete longitudinal data and should be routinely conducted. To this end, special attention should go to the comparisons between the various sensitivity analysis frameworks.
We gratefully acknowledge the support we received from Geert Molenberghs (Interuniversity Institute for Biostatistics and Statistical Bioinformatics - Universiteit Hasselt) for providing the PROC IML code from which the current code is based. We are also thankful to Milliken, G. A. (Kansas State University) for the kind permission to use his data.