ISSN ONLINE(2319-8753)PRINT(2347-6710)
ISSN ONLINE(2319-8753)PRINT(2347-6710)
Dr.G.Brindha, Ms. J. Pavithra
|
| Related article at Pubmed, Scholar Google |
Visit for more related articles at International Journal of Innovative Research in Science, Engineering and Technology
Microfinance is a sunrise sector in India. The geographic penetration of microfinance across the different states show a skewed pattern with exceptionally very high penetration in southern states of the country and almost negligible in northern and the central region . This paper seeks to identify GDP as one likely reason behind this pattern of growth by finding an association between GDP and microfinance penetration index of different states of the country
Keywords |
| Microfinance, Correlation, GDP,MPI |
Research Question: |
| Is there a correlation between GDP of a state and its Microfinance penetration index ? |
Hypothesis: |
| H1: States with higher GDP tend to have better microfinance penetration. |
| H2: There is a regional pattern in Microfinance penetration |
| Measures: |
| 1.GDP of the states for the Years 2008 and 2009 are taken |
| 2.Two separate indicators of Microfinance penetration are used |
| (a)Microfinance Penetration Index (MPI)i and |
| (b)Microfinance Poverty Penetration Index (MPPI)ii for each of the states for the year 2008 and 2009 |
LITERATURE REVIEW |
The Lopsided growth story |
| The microfinance sector is growing at a rate of more than 30% and looking at the huge share of the “unbankable” population i.e. the poor population and the rural population the future of microfinance sector looks relatively safe. But what appears to be an issue of concern is that the geographic penetration of this sector is not in tandem with the respective share of poor population of the sates . The geographic penetration of microfinance as calculated by the microfinance penetration index (MPI) and microfinance poverty penetration index (MPPI) is rather skewed .The southern states have been ,by and large the lone drivers of this growth with almost negligible contribution from states which are home to the majority of the poor population in the country. According to The State of the Sector Report 2009 report the southern states account for 69% of total loan outstanding and 55% of all MFI clients. The northern and central region which are home to a larger portion of the country’s population, and the rural poor, account for an abysmal 3% of total clients and only 7% of the poor living . |
| While there can be many a reasons for this skewed pattern of growth including differences in infrastructure, socio-political and cultural demography, this paper essentially seeks to identify the relationship between the GDP of the state and the microfinance penetration index. A positive co-relation would indicate that higher GDP of a state sets favorable condition for growth of microfinance in that state. A negative or zero co-relation would call for a robust policy support from the government to create an environment conducive for the growth of microfinance. |
DATA AND METHODOLOGY |
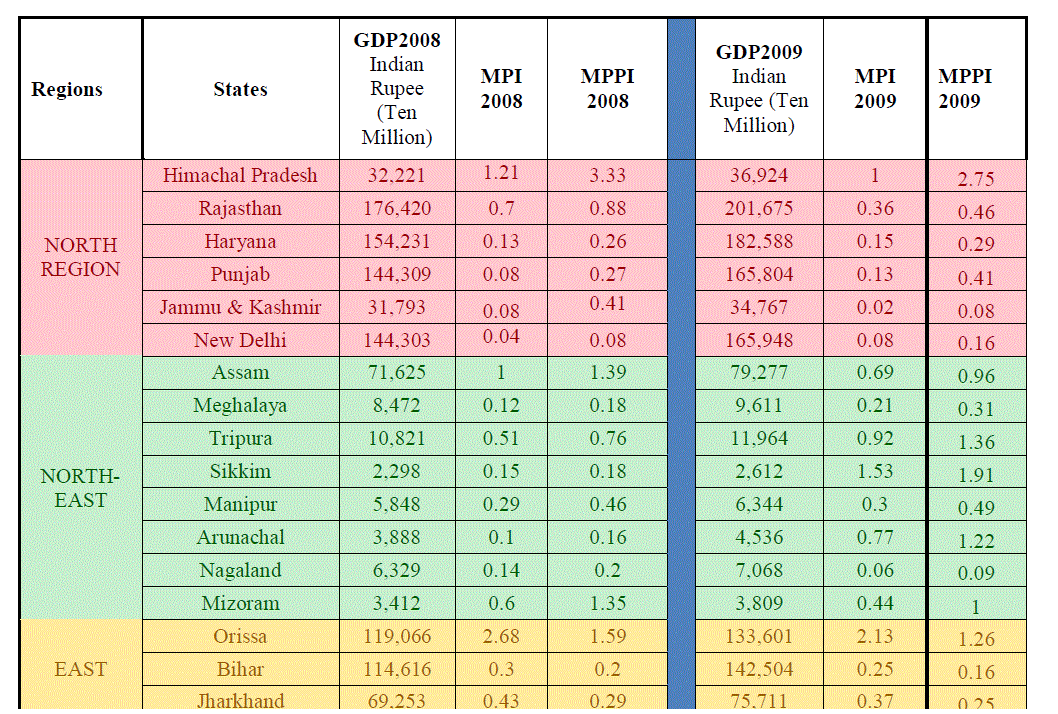
| The GDP data for different states for years 2008 and 2009 have been obtained from iiiVMW analytical services .The values for Microfinance penetration index (MPI) and Microfinance poverty penetration index (MPPI) both for year 2008 and 2009 have been obtained from “Microfinance-the state of the sector report 2009” .The method of calculation for MPI and MPPI as stated in the report is as follows: |
| ivThe number of credit clients of MFIs and members of SHGs with outstanding loans to banks were computed and each states share to the country’s total mf clients was worked out. The intensity of penetration of microfinance (MPI) was computed by dividing the Share of the State in microfinance clients with share of population. Intensity of Penetration of Microfinance among Poor (MPPI) was derived by dividing the share of the state in microfinance clients by share of the state in population of Poor. Since the microfinance clients are in the numerator, a value of more than 1 indicates that clients acquired were more than proportional to the population. Higher the score is above 1, better the performance. Lower the score from 1 which is the par value, poorer is the performance in the state. |
 |
 |
METHODOLOGY |
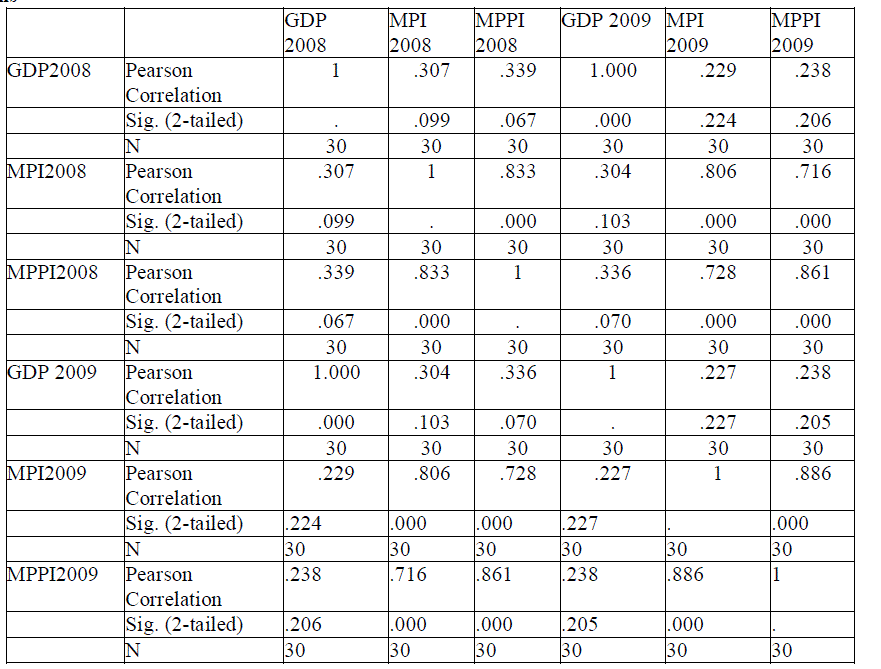
| For testing the first hypothesis Pearson’s correlations are found out |
| For testing the second hypothesis Chi-square test was administered on the data |
Test of Hypothesis H1: |
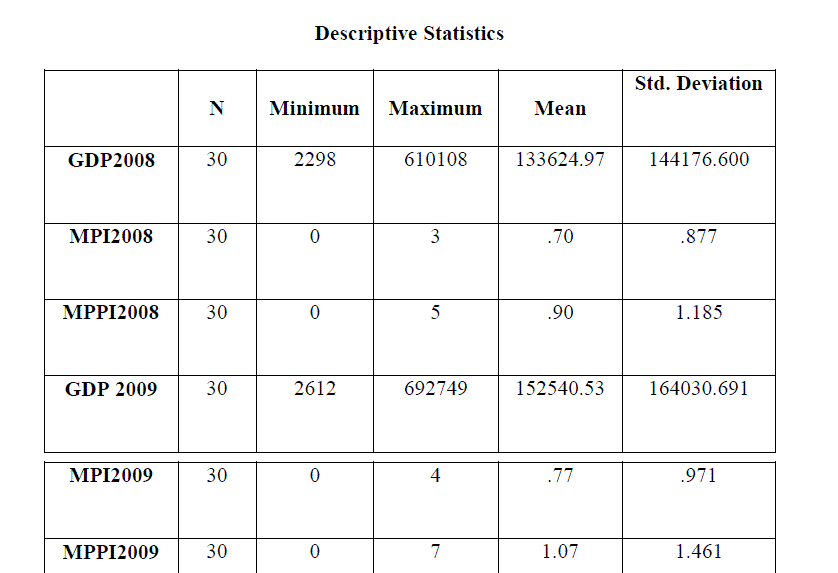
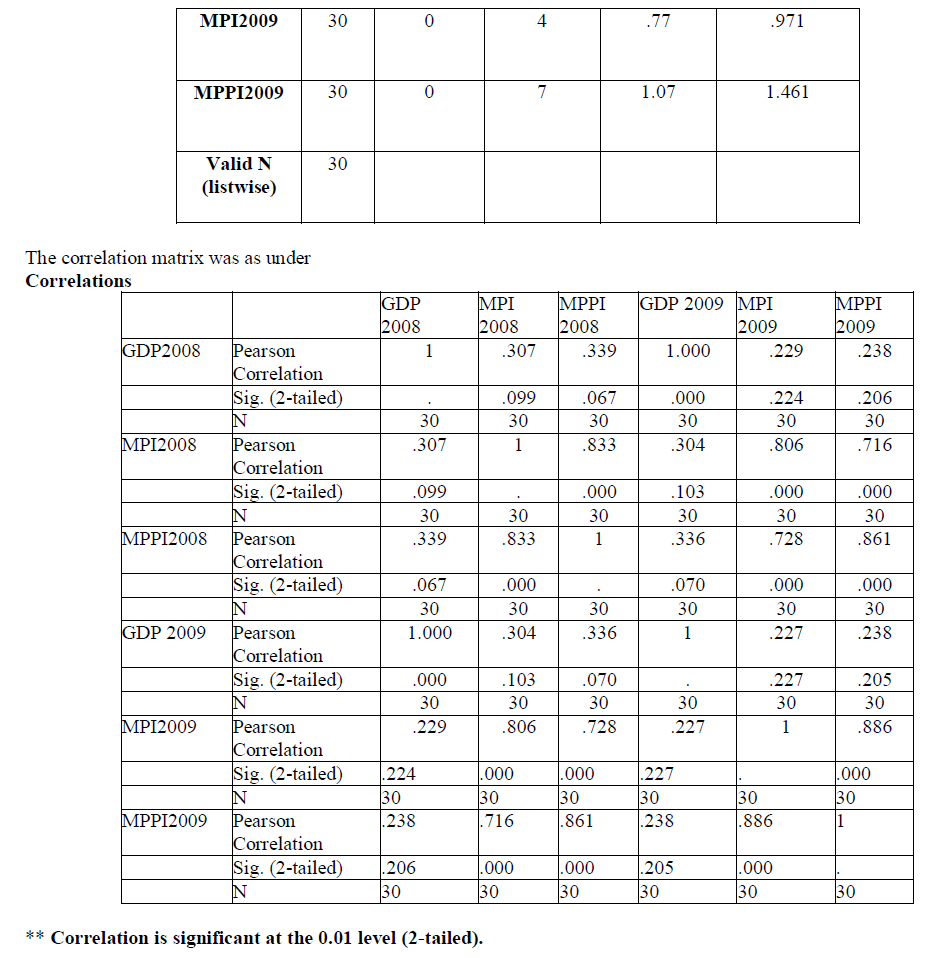
| The descriptive statistics of the data were as under |
 |
 |
FINDINGS |
| As can be observed the GDP figures had no statistically significant relationship with both the measures of microfinance penetrations i.e. MPI and MPPI. |
| The hypothesis is not accepted on the basis of not having sufficient evidence to reject the null hypothesis. From the above discussion it can be inferred that the above research proves that there is no proof to establish the relationship between the GDP figures and microfinance penetration levels |
Significance of the research lies in refuting the general perception that higher GDP states tend to have better microfinance penetration. |
Test of Hypothesis H2: |
| For the Chi Square test the regions were recoded into categories and the result of the chi square test were as under Test Statistics |
 |
Findings: |
| The relationship was significant at .002 Alphas. So the hypothesis H2 was accepted. There does exist a regional pattern in the spread of Microfinance Penetration. |
CONCLUSION |
| GDP has no Correlation with the Microfinance Penetration Index of a state. This implies that states with higher GDP and lower MPI need to put pro-active robust Government policy support to promote the growth of the sector in the state and provide financial access to the poor. As the Microfinance penetration level shows regional patterns, states with low MPI will eventually catch-up with neighboring states which have higher MPI. The high levels of penetration in the southern region of the country support this finding. Microfinance Institutions operating in southern region can also look at strategic expansion in states with low MPI which are much less competitive and an ideal ground to beget first mover advantage. |
References |
|