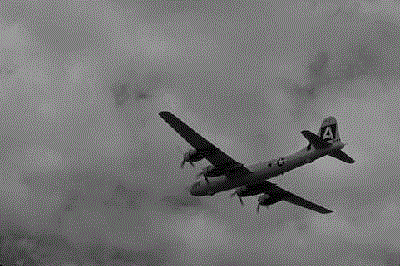
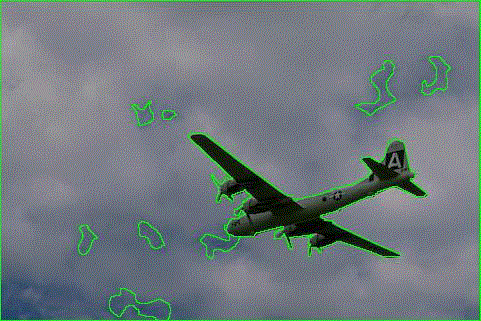
An image is an array, or a matrix, of square pixels (picture elements) arranged in columns and rows. The goal of image segmentation is to cluster pixels into salient image regions, i.e., regions corresponding to individual surfaces, objects, or natural parts of objects. The segmentation could be used for object recognition, occlusion boundary estimation within motion or stereo systems, image compression, image editing, or image database look-up. Image processing plays a key role in computer aided diagnosis and medical practice. . Shape analysis plays an important role in feature extraction and analysis. In this paper a technique is proposed to detect anaemic erythrocytes using image segmentation and shape parameters.
Keywords |
| Segmentation, Mean Shift, Thresholding, Anaemia. |
INTRODUCTION |
| Image segmentation is the process of dividing an image into multiple parts. This is typically used to identify objects or
other relevant information in digital images. It is the process by which an image is subdivided into its different parts.
Level of segmentation is depends on the level of requirement of objects. Segmentation has two objectives. The first
objective is to decompose the images into parts for further analysis. The second objective of segmentation is to perform
a change of representation. The pixels of the image must be organized into higher-level units that are either more
meaningful or more efficient for further analysis (or both). A shape parameter is a set function value of which does not
depend on geometrical transformation such as translation, rotation, size changes and reflection. Statistical shape
analysis is a geometrical analysis from a set of shapes in which statistics are measured to describe geometrical
properties from similar shapes or different groups [2]. |
II. LITERATURE REVIEW |
| Dorin Comaniciu et al proposed the general nonparametric technique for the analysis of complex multimodal feature
space and to delineate arbitrarily shaped clusters in it. The basic computational module of the technique is an old
pattern recognition procedure, the mean shift. In this the convergence of recursive mean shift procedure to the nearest
stationary point of the underlying density function is proved for discrete data. An algorithm for image segmentation is
described as an application[11]. Michael Breuß et al provide a review of shape analysis methods. Shape analysis
methods play an important role in systems for object recognition, matching, registration, and analysis. Research in
shape analysis has been motivated, in part, by studies of human visual form perception systems. Several theories of
visual form perception are briefly mentioned. Shape analysis methods are classified into several groups. Classification
is determined according to the use of shape boundary or interior, and according to the type of result. An overview of
the most representative methods is presented. D. Karakuş et al, in their paper, detection of size and shape of minerals
are considered important for the information about minerals. Different size and shape of same mineral can be effective
in classification of them. Therefore it is necessary to know the size and shape of mineral exactly. In this study, using
possibilities of image processing techniques in the detection of shape and size of mineral was discussed and a sample
study was carried out. According to this successful results can be obtained about size and shape features of minerals by
using image processing technique especially in thin section images whose third dimension effect was decreased[8]. |
III. SEGMENTAION |
| Pyramid segmentation uses a color merge (over a scale that depends on the similarity of the colors to one another in
order to segment images. This approach is based on minimizing the total energy in the image;[2] here energy is defined
by a link strength, which is further defined by color similarity. mean shift finds the peak of a color-spatial (or other
feature) distribution over time. mean-shift segmentation finds the peaks of color distributions over space. Given a set
of multidimensional data points whose dimensions are (x, y, blue, green,red), mean shift can find the highest density
“clumps” of data in this space by scanning a window over the space. However, that the spatial variables (x, y) can have
very different ranges from the color magnitude ranges (blue, green, red). [2] Therefore, meanshift needs to allow for
different window radii in different dimensions. In this case weshould have one radius for the spatial variables (spatial
Radius) and one radius for the color magnitudes (color Radius). As mean-shift windows move, all the points traversed
by the windows that converge at a peak in the data become connected or “owned” by that peak. This ownership,
radiating out from the densest peaks, forms the segmentation of the image. In Mean Shift Filtering() we have an input
image src and an output image dst.Both must be 8-bit, three-channel color images of the same width and height. The
spatial Radius and color Radius defi ne how the mean-shift algorithm averages color and space together to form a
segmentation. For a 640-by-480 color image, it works well to set spatial Radius equal to 2 and color Radius equal to 40.
The next parameter of this algorithm is max_level, which describes how many levels of scale pyramid you want used
for segmentation. A max_level of 2 or 3 works well for a 640-by-480 color images. |
| Otsu's method is used to automatically perform histogram shape-based image threasholding, or, the reduction of a
graylevel image to a binary image. The algorithm assumes that the image to be threshold [1] contains two classes of
pixels or bi-modal histogram (e.g. foreground and background) then calculates the optimum threshold separating those
two classes so that their combined spread (intra-class variance) is minimal. |
IV. PROBLEM STATEMENT |
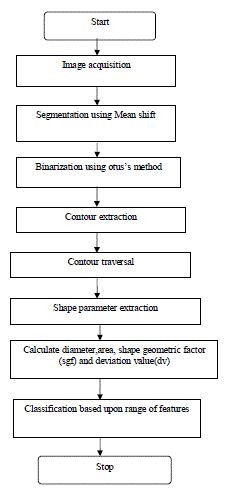
| Shape analysis plays an important role in feature extraction and analysis .A methodology has been proposed which
segment the images using mean shift technique and otus’s method is used for binarization. It extracts contours of the
objects present in the images using chain code. The contour further is used to evaluate shape parameters. Contour
tracing helps in shape analysis. Contour tracing is one of many preprocessing techniques performed on digital images
in order to extract information about their general shape. |
V. PROPOSED TECHNIQUE AND THE FLOW |
The mean-shift algorithm runs as follows. |
| 1. Choose a search window: |
| • its initial location; |
| • its type (uniform, polynomial, exponential, or Gaussian); |
| • its shape (symmetric or skewed, possibly rotated, rounded or rectangular); |
| • its size (extent at which it rolls off or is cut off ). |
| 2. Compute the window’s (possibly weighted) centre of mass. |
| 3. Centre the window at the centre of mass. |
| 4. Return to step 2 until the window stops moving (it always will). |
VI. ANTICIPATED TECHNICAL IMPLEMENTATION AND APPROACH |
| The proportional analysis on various segmentation techniques and shape parameters. |
| Design of a new algorithmic approach towards medical diagnosis. |
| Implementation of the improved and efficient algorithm on the images of RBC- normal as well as abnormal. |
| Relative study of the results with the existing techniques and generation of the detailed reports |
| Acceptance and trust level of the hypothesis and objectives specified in the research proposal |
| Framing out the conclusion and future work from the implementation performed and results fetched |
VII. SIMULATION RESULTS |
| We have segmented various images by using the Mean-Shift Segmentation. The collective representation of the
extracted parameters is shown in Table 1. Shape analysis of different RBCs have been done using segmentation
technique as shown in fig1. |
| Contour plays an important role. Once the contour of a given pattern is extracted, it's different characteristics will be
examined and used as features which will later on be used in cell classification. The contour pixels are generally a
small subset of the total number of pixels representing a pattern. Therefore, the amount of computation is greatly
reduced when we run feature extracting algorithms on the contour instead of on the whole pattern. The current
methodology works in different phases, First of all it segments the image then binarization and then successfully
extract the contours and thus shape parameters, we test the methodology for the analysis and classification of RBC
cells. With this classification, we can easily find out the blood disorders and diagnose them. Sometimes structural
changes occur in RBCs that indicate a possible pathological condition. In this paper a new technique is proposed to
diagnose the disease anemia by applying this technique on Red Blood Cell images. |
Tables at a glance |
 |
| Table 1 |
|
| |
Figures at a glance |
 |
 |
 |
 |
| Figure 1 |
Figure 2 |
Figure 3 |
Figure 4 |
|
|
References |
- A.Erhardt,âÂÂTheory and applications of digital image processingâÂÂ,http://www.control.auc.dk/~ansk00/CVG10/cvg9_dir/DIRLitterature/Theory%20and%20Applications%20of%20DIP.pdf.
- A.J. Perez, F.Lopez, et.al Colour& Shape Analysis Techniques for Weed detection in Cereal FieldsâÂÂ, Computer & Electronics in Agriculture-25, pp 197-212,2000
- Andy Tsai*, Anthony Yezzi,â A Shape-Based Approach to the Segmentation of Medical Imagery Using Level Setsâ IEEE transactions onmedical imaging, vol. 22, no. 2, February 2003.
- Anthony p. reeves, r. j. prokop, susan e. andrews,and frank p. kuhl,â Three-Dimensional Shape Analysis Using Momentsand FourierDescriptorâÂÂ, IEEE transactions on pattern analysis and machine intelligence, vol 10, no. 6. November 1988.
- ArchanaChaugule,â Application of image processing in seed technology: A surveyâÂÂ, International Journal of Emerging Technology andAdvanced Engineering Website: www.ijetae.com (ISSN 2250-2459, Volume 2, Issue 4, April 2012).
- C. igathinathane et al,â Shape identification and particles size distribution from basic shape parameters using ImageJâÂÂ, 2008 Elsevier B.V.
- D. Chaudhuri,A. Samal, âÂÂAsimple method for fitting of bounding rectangle to closed regionsâ Pattern Recognition 40, (2007)
- D. Karakus, A. H. Onur, A.H. Deliormanli, G. Konak,â Size and shape analysis of mineral particles using image processing techniqueâÂÂ, TheJournal of ORE DRESSING î 2010.
- DenisAleshin,âÂÂOpenCVTutorialâÂÂ,http://www.cc.gatech.edu/~daleshin/OpenCV_Tutorial.pdf.
- Dimtrijcsetvrikov,âÂÂBasic algorithm for digital image analysisâÂÂ.
- DorinComaniciu, Peter Meer, âÂÂMean Shift: A Robust Approach towards Feature Space AnalysisâÂÂ, IEEE Transaction on Pattern Analysis andMachine Intelligence, Vol. 24, No. 5, May 2002.
- Gary Bradski and Adrian Kaehler,âÂÂLearning OpencvâÂÂ, OâÂÂReilly Media, Inc,, September 2008: First Edition.
- Gonzales : Digital Image Processing, Prentice Hall (3th Edition.)
|