ISSN ONLINE(2319-8753)PRINT(2347-6710)
ISSN ONLINE(2319-8753)PRINT(2347-6710)
Krishnakumar P1, Y.Ramesh Babu2
|
| Related article at Pubmed, Scholar Google |
Visit for more related articles at International Journal of Innovative Research in Science, Engineering and Technology
The project presents change detection approach for synthetic aperture radar (SAR) images based on an image fusion and a spatial fuzzy clustering algorithm. The image fusion technique will be introduced to generate a difference image by using complementary information from a mean-ratio image and a log-ratio image. NSCT (Non- sub sampled contourlet transform) fusion rules based on an average operator and minimum local area energy are chosen to fuse the contourlet coefficients for a lowfrequency band and a high-frequency band, respectively to restrain the background information and enhance the information of changed regions in the fused difference image. A fuzzy local-information Cmeans clustering algorithm will be proposed for classifying changed and unchanged regions in the fused difference image. It incorporates the information about spatial context in a novel fuzzy way for the purpose of enhancing the changed information and of reducing the effect of speckle noise. For the remote sensing images, differencing (subtraction operator) and rationing (ratio operator) are wellknown techniques for producing a difference image. In differencing, changes are measured by subtracting the intensity values pixel by pixel between the considered couple of temporal images. In rationing, changes are obtained by applying a pixel-by-pixel ratio operator to the considered couple of temporal images. In the case of SAR images, the ratio operator is typically used instead of the subtraction operator since the image differencing technique is not adapted to the statistics of SAR images. The results will be proven that rationing generates better difference image for change detection using spatial fuzzy clustering approach and efficiency of this algorithm will be exhibited by sensitivity and correlation evaluation.
Keywords |
| SAR, Fusion technique, NSCT, spatial fuzzy clustering. |
INTRODUCTION |
| The detection of changes occurring on the earth surface through the use of multi temporal remote sensing images is one of the most important applications of remote sensing technology. This depends on the fact that, for many public and private institutions, the knowledge of the dynamics of either natural resources or man-made structures is a valuable source of information in decision making. In this context, satellite and airborne remote sensing sensors have proved particularly useful in addressing change-detection applications related to environmental monitoring, agricultural surveys, urban studies, and forest monitoring. Usually, change detection involves the analysis of two co-registered remote sensing images acquired over the same geographical area at different times. Such an analysis is called unsupervised when it aims at discriminating between two opposite classes (which represent changed and unchanged areas) without any prior knowledge about the scene (i.e., no ground truth is available for modeling the classes). In the analysis of multi temporal remote sensing data acquired by (optical) multispectral sensors, various automatic and unsupervised change-detection methods have been developed and described in the literature. Most are based on the so-called “difference image” (DI). The most popular way of generating the DI is by change vector analysis. This technique exploits a simple vector subtraction operator to compare pixel-by-pixel the two multispectral images under analysis. In some cases, depending on the specific type of changes to be identified, the comparison is made on a subset of the spectral channels. Synthetic aperture radars have been less exploited than optical sensors in the context of change detection. This is due to the fact that SAR images suffer from the presence of the speckle noise that makes it difficult to analyze such imagery, and in particular to perform unsupervised discrimination between changed and unchanged classes. Despite the presence of speckle noise, the use of SAR sensors in change detection is potentially attractive from the operational viewpoint. |
| These active microwave sensors present the advantage that (unlike optical ones) they are independent of atmospheric and sunlight conditions. This means that they are capable of monitoring geographical areas regularly (even if covered by clouds) and also of controlling polar regions even during the local winter period when solar light is severely limited. This makes it possible to plan the monitoring of a region (by repeat-pass imaging) with advance timing defined according to end-user requirements (e.g., seasonal and agricultural calendars). Multi temporal images changes detection in the state of remotely sensed natural surfaces by observing them at different times is one of the most important applications of Earth orbiting satellite sensors because they can provide multidate digital imagery with consistent image quality, at short intervals, on a global scale, and during complete seasonal cycles. A lot of experience has already been accumulated in exploring change detection techniques for visible and near infrared data collected by Land sat. In the case of space borne synthetic aperture radar (SAR) imagery, change detection techniques have been developed for the temporal tracking of multiyear sea-ice floes using Sea sat SAR observations, and rainfall events have been detected based on spatial radiometric variations in multidate Sea sat SAR imagery. Sea sat SAR, however, did not provide calibrated radar measurements, and multidate observations were produced in limited quantity due to the short duration of the mission. Change detection techniques for space borne SAR data have not yet been fully explored. Change detection techniques for SAR data can be divided into several categories, each corresponding to different image quality requirements. In a first category, changes are detected based on the temporal tracking of objects or stable image features of recognizable geometrical shape. Absolute calibration of the data is not required, but the data must be rectified from geometric distortions due to differences in imaging geometry or SAR processing parameters, and the accurate spatial registration of the multidate data is essential. Combining information acquired from multiple sensors has become very popular in many signal and image processing applications. In the case of earth observation applications, there are two reasons for that. The first one is that the fusion of the data produced by different types of sensors provides a complementary which overcomes the limitations of a specific kind of sensor. The other reason is that, often, in operational applications, the user does not have the possibility to choose the data to work with and has to use the available archive images or the first acquisition available after an event of interest. This is particularly true for monitoring applications where image registration and change detection approaches have to be implemented on different types of data. Both image registration and change detection techniques consists of comparing two images , the reference, and , the secondary image, acquired over the same landscape scene at two different dates. |
| Usually, the reference image is obtained from an archive and the acquisition of the secondary image is scheduled after an abrupt change, like a natural disaster. In the case of the change detection, the goal is producing an indicator of change for each pixel of the region of interest. This indicator of change is the result of applying locally a similarity measure to the two images. This similarity measure is usually chosen as the correlation coefficient or other statistical feature in order to deal with noisy data. The estimation of the similarity measure is performed locally for each pixel position. Since a statistical estimation has to be performed, and only one realization of the random variable is available, the images are supposed to be locally stationary and the ergodicity assumption allows to make estimates using several neighbor pixels. This neighborhood is the so-called estimation window. In order for the stationary assumption to hold, this estimation window has to be small. On the other hand, robust statistical estimates need a high number of samples. Therefore, the key point of the estimation of the similarity measure is to perform high quality estimates with a small number of samples. One way to do so is to introduce a priori knowledge about the image statistics. |
IMAGE FUSION |
| Image Fusion is the process of combining relevant information from two or more images into a single image. The fused image should have more complete information which is more useful for human or machine perception. The resulting image will be more informative than any of the input images. Medical fusion image is to combine functional image (CT) and anatomical image (MRI) together into one image .This image can provide abundance information to doctor to diagnose clinical disease. |
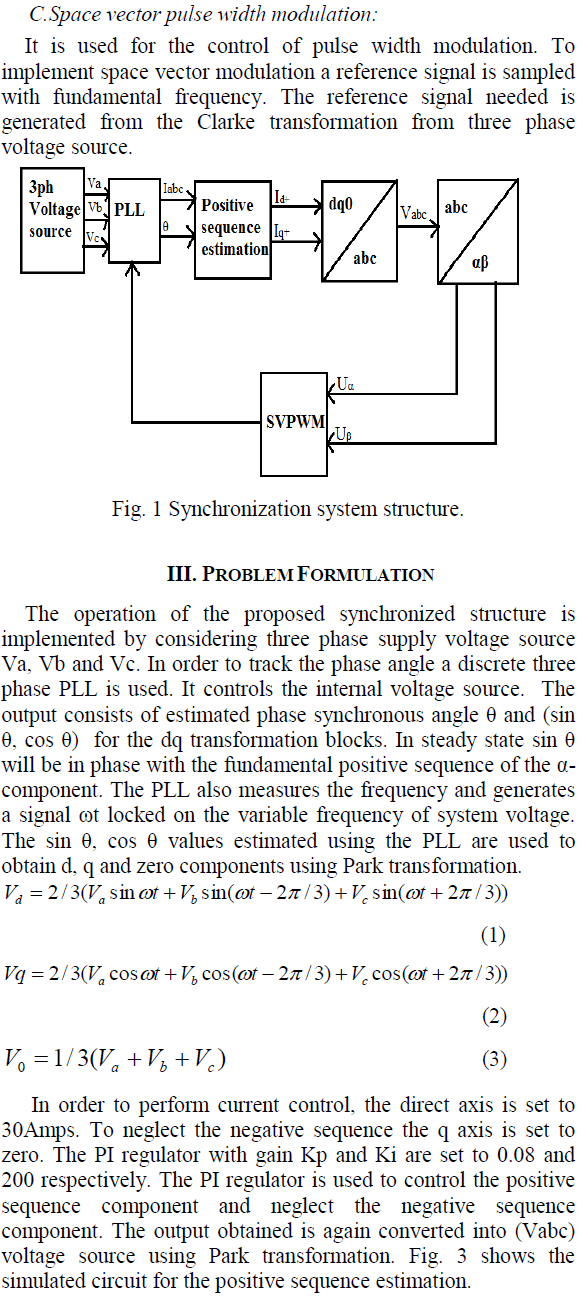 |
| The input images are fused here to get more complementary information and also some common redundant information, which illustrates the basic image fusion. |
METHODOLOGY |
| The process is to generate the difference images to enhance details about changes between source images. Here rationing will performed to obtain difference images in logarithmic and mean scale. It is highly robust to speckle noise. Logarithmic scale based difference part will be generated to identify changes and unchanged region and it is weakening the high intensity and enhancing the low intensity pixels. |
| i. DIFFERENCE IMAGE GENERATION |
| The ratio difference image is usually expressed in a logarithmic or a mean scale because of the presence of speckle noise. In the past dozen years, there was a widespread concern was considered as a heuristic parametric probability distribution function for SAR intensity and amplitude distributions. With the log-ratio operator, the multiplicative speckle noise can be transformed in an additive noise component. Furthermore, the range of variation of the ratio image will be compressed and thereby enhances the low-intensity pixels, authors proposed a ratio mean detector (RMD), which is also robust to speckle noise. This detector assumes that a change in the scene will appear as a modification of the local mean value of the image. Both methods have yielded effective results for the change detection in SAR imagery but still have some disadvantages: The logarithmic scale is characterized by enhancing the low-intensity pixels while weakening the pixels in the areas of high intensity; therefore, the distribution of two classes (changed and unchanged) could be made more symmetrical. |
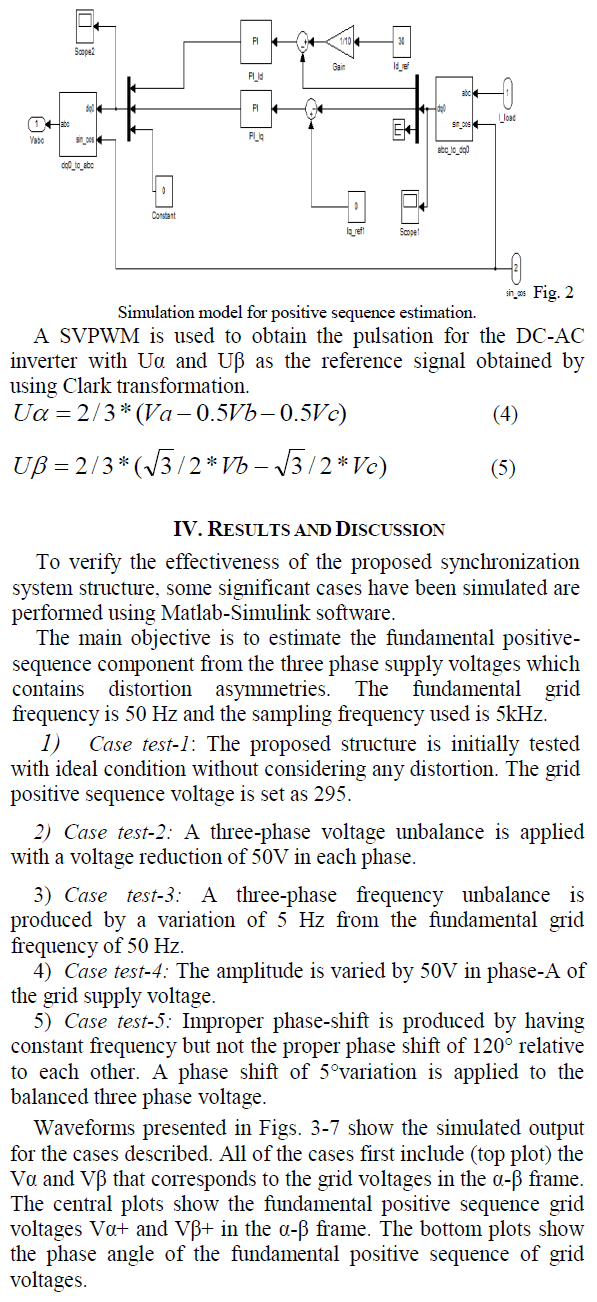 |
| However, the information of changed regions that is obtained by the log-ratio image may not be able to reflect the real changed trends in the maximum extent because of the weakening in the areas of highintensity pixels. The information of background obtained by the log-ratio image is relatively flat on account of the logarithmic transformation. Hence, it can be concluded from the above analysis that the new difference image fused by mean-ratio image and log-ratio image could acquire better information content than the individual difference images (i.e., the mean-ratio image and the logratio image). |
| ii. NSCT DECOMPOSITION |
| Various image fusion techniques have been proposed to meet the requirements of different applications, such as concealed weapon detection, remote sensing, and medical imaging. Combining two or more images of the same scene usually produces a better application-wise visible image. The fusion of different images can reduce the uncertainty related to a single image. The Brovey Transform (BT), Intensity Hue Saturation (IHS) transforms, and Principal Component Analysis (PCA) provide the basis for many commonly used image fusion techniques. Some of these techniques improve the spatial resolution while distorting the original chromaticity of the input images, which is a major drawback. Recently, great interest has arisen on the new transform techniques that utilize the multi-resolution analysis, such as Wavelet Transform (WT). The multiresolution decomposition schemes decompose the input image into different scales or levels of frequencies. Wavelet based image fusion techniques are implemented by replacing the detail components (high frequency coefficients) from a colored input image with the details components from another gray-scale input image. |
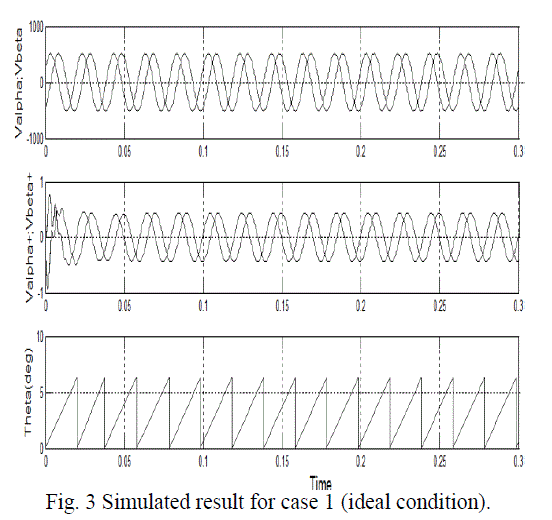 |
| However, the Wavelet based fusion techniques are not optimal in capturing two-dimensional singularities from the input images. These points are located along smooth curves rendering smooth boundaries of objects. Do and Vetterli introduced the new two-dimensional Contourlet transform. This transform is more suitable for constructing a multi-resolution and multi-directional expansions using non-separable Pyramid Directional Filter Banks (PDFB) with small redundancy factor. |
| iii. FUSION APPROACH |
| The sparse representation of images, coefficients characteristics of contourlet also has been studied. There are three relationships in contourlet coefficients. |
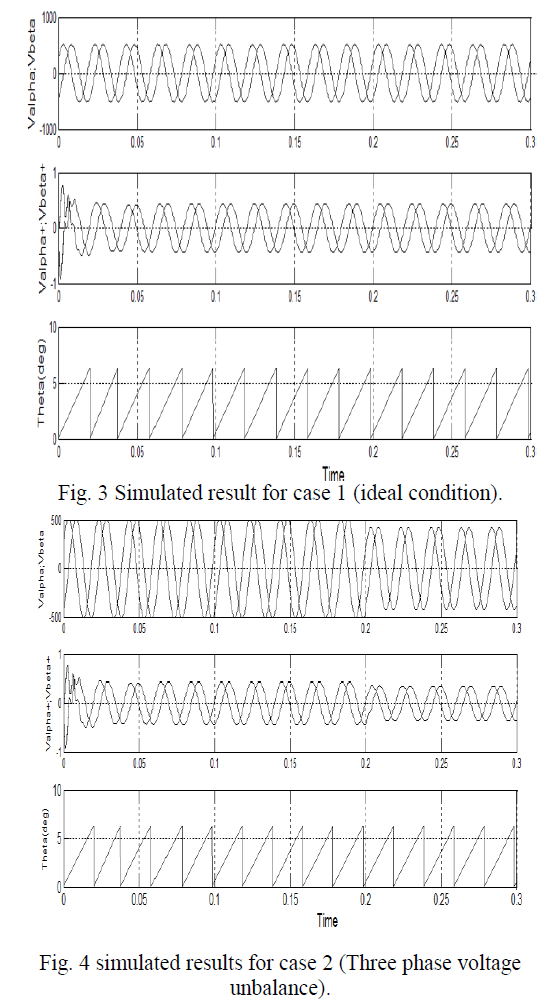 |
| The reference coefficient has eight neighbors (NX) in the same sub-band, parent (PX) at the same spatial location in the immediately coarser scale and cousins (CX) at the same scale and spatial location but in directional subbands. In [11], mutual information is utilized as a measure of dependencies to study the joint statistics of contourlet coefficients. Suppose I ( X;Y ) stands for the mutual information between two random variables X and Y. Estimation results in [11]show that at fine scales I ( X;NX ) is higher than I ( X;CX ) , which is higher than I ( X;PX ) .It indicates that the eight neighbor coefficients contain the most information about the coefficients, less information is contained in cousins and the least information is contained in the parent coefficients |
PERFORMANCE ANALYSIS |
| Change Detection: Change detection approach for synthetic aperture radar images based on an image fusion and a spatial fuzzy clustering algorithm. The image fusion technique will be introduced to generate a difference image by using complementary information from a meanratio image and a log-ratio image. |
 |
| Peak –signal-to noise ratio and Mean square error: How do we determine the quality of a digital image? Human eyes perception is the fastest approach. To establish an objective criterion for digital image quality, a parameter named PSNR (Peak Signal to Noise Ratio) is defined in equation 3.8 as follows: |
| PSNR = 10*log10 (255*255/MSE) |
| where MSE (Mean Square Error) stands for the meansquared difference between the cover-image and the stego-image. The mathematical definition for MSE is defined in equation 3.9 as follows: |
| M N |
 |
| In this above equation aij means the pixel value at position (i,j) in the input image and bij is the pixel value at the same position in the output image. The calculated PSNR usually adopts dB value for quality judgement. The larger PSNR is, the higher the image quality is (which means there is only little difference between the inputimage and the fused-image). On the contrary, a small dB value of PSNR means there is great distortion between the input-image and the fused-image. |
| Entropy: It is useful to determine the significant information from the image based on the probability of pixel values |
 |
| Where, p(x, y) is the probability of each gray level. |
| Correlation Coefficient: It gives similarity in the small structures between the original and reconstructed images. Higher value of correlation means that more information is preserved. Coefficient correlation in the space domain is defined by: |
| Correlation = sum (sum (B.*A))/Sqrt (sum (sum (B.*A))*sum (sum (A.*A))); Where, B is difference between fused image and its overall mean value. |
| A is difference between source image and its overall mean value. |
SIMULATED OUTPUT |
| The fused two different frequency sub bands are inverse transformed to reconstruct the fused image and parameters will be evaluated between input and fused image. |
 |
CONCLUSION AND FUTURE WORK |
| The project presented the Change detection approach for remote sensing satellite images based on an image fusion and a spatial fuzzy clustering algorithm. Detection of changed region involved the fusion approach for morphing the two images taken at different time to enhance details of changed region from unchanged region. Here, NSCT decomposition was effectively used to extract the smoothing and contour wedges from images to make pixel level fusion with better efficiency. In this type, an averaging rule and gradient detection were utilized. The simulated results shown that generated fused image has less error and better signal to noise ratio compared to input images. This system will be enhanced with features of segmentation approach to extract the changes part from the fused image with better sensitivity and accuracy. |
References |
|