Research & Reviews: Research Journal of Biology
ISSN: 2322-0066
ISSN: 2322-0066
Zoology Department, Faculty of Science, Cairo University, Egypt
Received Date: 15/06/2016; Accepted Date: 10/08/2016; Published Date: 16/08/2016
Visit for more related articles at Research & Reviews: Research Journal of Biology
Background: Diabetes mellitus (DM) is one of the five leading causes of death in the world and about six deaths per minute are attributable to diabetes complications. Echinochrome is quinonoid pigment which possesses high antioxidant and hypoglycemic activities. Objective: The present study was carried out to compare between the hypoglycemic and antioxidant effects of echinochrome on type 1 and type 2 diabetic rats. Methods: Thirty six male Wistar albino rats were divided into two main groups, type 1 diabetes and type 2 diabetes groups. Each main group divided into 3 subgroups (6 rats/subgroup); control, diabetic and echinochrome trated groups. Diabetes type 1 was induced by single dose of streptozotocin (60 mg/kg, i.p) and type 2 induced by high fat diet for 4 weeks before the injection with streptozotocin (30 mg/kg, i.p). The treated groups administrated echinochrome (1 mg/kg body weight in 10% DMSO) daily for 4 weeks. Results: Administration of echinochrome improved diabetic marker, liver function, lipid profile, kidney function and antioxidant system which more pronounced in T1DM, while the improvment in glucose-6-phosphate dehydrogenase, γ-glutamyltransferase and glutathion reduced were more pronounced in T2DM. Conclusions: The antidiabetic potency of Ech was more pronounced in T1DM, indicating that the possible antidiabetic mechanisms of Ech involving improved glucose metabolism, restoration of β cells, improve insulin secretion, and antioxidant activity. The cells in T1DM prefer pathway of glycolysis, while in T2DM the cells prefer pentose pathway.
Diabetes mellitus, Insulin resistant, Echinochrome, Liver, kidney.
Diabetes mellitus (DM) is one of the five leading causes of death in the world and about six deaths per minute are attributable to diabetes complications [1]. The incidence of DM has been increased annually all over the world and the number of diabetic patients will jump from 382 million patients in year 2013 to 592 million in year 2035 [2].
The majority of diabetic patients are type 2 diabetes mellitus (T2DM) and relatively small proportions (7–10%) of diabetic patients have type 1 diabetes mellitus (T1DM) [3]. T1DM is an autoimmune disease resulting in destruction of pancreatic β cells [4]. Over the last few decades, there has been an overall increase in the incidence of T1DM of ∼ 3% to 5% per year, and it is estimated that there are ∼ 65 000 new cases per year in children [5]. On the other hand, T2DM is a much more prevalent form of diabetes and is responsible for 90% of the disease prevalence [6]. It is develops primarily due to insulin resistance and dysfunction of insulin producing pancreatic β-cell, leading to insufficient insulin secretion [7].
In experimental animals, the most prominent diabetogenic chemical in diabetes research is streptozotocin (STZ) [8]. STZ has selective toxic effects on β-cells [9] because of high affinity for β-cell membrane [10], low capacity of β-cells to scavenge free radicals [11], and low NAD+/DNA ratio in islets [10]. STZ administration induces certain typical characteristics of T1DM, such as hyperglycemia, hypoinsulinemia and body weight loss [12]. T1DM induced experimentally by high dose of STZ (60 mg/kg body weight) leading to rapid destruction of β cell, severe decline in insulin plasma level and profound hyperglycemia [13]. The severs hyperglycemia and hypoinsulinemia conditions in the current study may be related to the destruction of pancreatic cells which was confirmed by the histopathological examination. On the other hand, simulation of T2DM in animals was achieved by combining the feeding of high fat diet (HFD) which produced insulin resistance and low dose of STZ treatment that caused the initial β cell dysfunction and subsequently the frank hyperglycemia [14]. HFD has been shown to induce insulin resistance by different mechanisms but considered mainly through Randle or glucose-fatty acid cycle [15]. The presence of high level of triglycerides due to excess fat intake could constitute a source of increased fatty acid availability and oxidation. The preferential use of increased fatty acids for oxidation blunts the insulin-mediated reduction of hepatic glucose output and reduces the glucose uptake or utilization in skeletal muscle leading to compensatory hyperinsulinemia, a common feature of insulin resistance [16]. As respond to insulin resistant the secretory capacity of pancreatic β cells to compensate the existing insulin resistance decrease, which achieved practically by injection with low dose of STZ leading to hypoinsulinemia [16].
Insulin therapy is the only satisfactory approach in diabetic mellitus, even though it has several drawbacks like insulin resistance, anorexia, brain atrophy, and fatty liver in chronic treatment [17]. The oral hypoglycemic agents that are capable of reducing blood sugar level belong to two chemical classes; sulfonylureas and biguanides [18]. However, the use of oral anti-diabetics is limited due to their adverse side effects including hematological, cutaneous and gastrointestinal reactions, hypoglycaemic coma and disturbances of liver and kidney functions. In addition, they are not suitable for use during pregnancy [19]. Management of diabetes without any side effects is still a challenge to medical communities, therefore natural products with anti-diabetic activity and fewer side effects are strongly needed [20].
Marine organisms are a wonderful source of biologically active natural products [21]. Many bioactive compounds have been extracted from various marine animals [22]. A majority of pharmacologically active secondary metabolites have been isolated from echinoderms [23]. There is much valuable information for new antibiotic discoveries from sea urchin (Phylum Echinodermata, class Echinoidea), which give new insights into bioactive compounds within it [24]. Sea urchin P. lividus is a widespread species in the Atlantic and the Mediterranean coasts and is subjected to intensive commercial fishing in several countries [25]. It has a number of unique substances, such as quinonoid pigments named spinochromes [26]. From these compounds, echinochrome (Ech) which possesses high antioxidant activity and is the most common dark red pigment of sea urchin shells, spines, and eggs [27].
Chemicals and reagents
Streptozotocin, dimethyl sulfoxide (DMSO), insulin and hexokinase kits were purchased from Sigma-Aldrich (St. Louis). Biochemical kits were purchased from the Biodiagnostic Company (El Moror St, Dokki, EGY).
Sea urchin collection
Sea urchins (P. lividus) were collected from the Mediterranean coast of Alexandria (Egypt) and transported to the laboratory packed in ice. The samples were thoroughly washed with sea water to remove sand and overgrowing organisms at the collection site and transported to the laboratory. The collected specimens were identified by the standard literature of taxonomic guide [28]. The collected specimens were immediately shade dried.
Echinochrome (Ech) extraction
Pigments in the shells and spines were isolated by the Amarowicz method with slight modifications [29,30]. After removal of the internal organs, the shells and spines were washed with a stream of cold water, air-dried at 4°C for 2 days in the dark and then were grounded. The powders (5 g) were dissolved by gradually adding 10 ml of 6 M HCl. The pigments in the solution were extracted 3 times with the same volume of diethyl ether. The ether layer collected was washed with 5% NaCl until the acid was almost removed. The ether solution including the pigments was dried over anhydrous sodium sulfate and the solvent was evaporated under reduced pressure. The extract including the polyhydroxylated naphthoquinone pigment was stored at -30°C in the dark.
Ethical approval
Experimental protocols and procedures used in this study were approved by the Cairo University, Faculty of Science, Institutional Animal Care and Use Committee (IACUC) (Egypt) (CUFS/F/33/14). All the experimental procedures were carried out in accordance with international guidelines for the care and use of laboratory animals.
Experimental animals
Male albino Wistar rats (Rattus norvegicus) weighing 140 ± 10 g for T1DM and 80 ± 10 g for T2DM were used in this study. The rats were obtained from the National Research Center (NRC, Dokki, Giza). Rats were housed in a temperature and humidity controlled environment and given food and water ad libitum.
Induction of type 1 diabetes mellitus (T1DM)
All rats were starved for 12 hrs before the experiment, but were allowed free access to water. T1DM was induced by intraperitoneal injection of 60 mg/kg of streptozotocin (STZ) dissolved in 0.1 mol/l sodium citrate buffer at pH 4.5. Blood glucose levels were measured 72 hr after injection of STZ. Rats were starved, but had access to drinking water for 6hr before blood glucose measurement. Fasting plasma glucose concentrations ≥ 300 mg/100 ml were considered diabetic type 1 in this experiment [31].
Induction of type 2 diabetes mellitus (T2DM)
The rats were fed a high fat diet with energy of 5.3 kcal/g, comprising 60% calories from fat, 35% from protein and 5% from carbohydrate, according to a modification of the protocols of Reed et al. [32]. After 4 weeks the rats injected intraperitoneally by a single dose of prepared solution of STZ (30 mg/kg dissolved in 0.1 mol/l sodium citrate buffer at pH 4.5). After 72 hours, fasting plasma glucose concentrations ≥ 300 mg/100 ml were considered diabetic type 2 in this experiment [33].
Experimental design
After one week of acclimatization, 36 rats were assigned into two main groups; T1DM group (18 rats) and T2DM group (18 rats).
T1DM group was divided into 3 subgroups (6 rats/subgroup):
Control group: After a single dose of citrate buffer (0.1 mol/l, i.p), the rats received 1 ml (10% DMSO, orally) daily for 4 weeks.
Diabetes group: After a single dose of STZ (60 mg/kg, i.p), the rats received 1 ml (10% DMSO, orally) daily for 4 weeks.
Ech group: After a single dose of STZ (60 mg/kg, i.p), the rats received 1 ml Ech (1 mg/kg body weight in 10% DMSO, orally) [34] daily for 4 weeks.
T1DM group was divided also into 3 subgroups (6 rats/subgroup):
Control group: After 4 weeks of normal diets feeding, the rats injected with single dose of citrate buffer (0.1 mol/l, i.p) then received 1 ml of (10% DMSO, orally) daily for 4 weeks.
Diabetes group: After 4 weeks of HFD feeding, the rats injected with single dose of STZ (30 mg/kg, i.p) then received 1 ml of (10% DMSO, orally) daily for 4 weeks.
Ech group: After 4 weeks of HFD feeding, the rats injected with single dose of STZ (30 mg/kg, i.p) then received 1 ml Ech (1 mg/ kg in 10% DMSO, orally) daily for 4 weeks.
Determination of body weight
Body weight measured at the beginning and the ending of the experiments.
Animal handling and specimen collection
The rats were fully anesthetized with 3% sodium pentobarbital, and the chest was opened. A needle was inserted through the diaphragm and into the heart. Negative pressure was gently applied once the heart had been punctured, and the needle was repositioned as required until blood flowed into the syringe. The blood collected from the rats was separated by centrifugation (3000 rpm, 15 min) to obtain sera which was stored at -80°C for the biochemical measurements.
Biochemical analysis
The serum glucose was estimated by the method of Freund et al [35], serum arginase [36], liver glucose-6-phosphate dehydrogenase [37], serum insulin [38], serum aspartate aminotransferase (AST) and alanine aminotransferase (ALT) [39], serum alkaline phosphatase (ALP) [40], serum γ-glutamyltransferase (GGT) [41], serum serum total protein [42], serum albumin [43], serum total lipids [44], serum triglycerides [45], serum total cholesterol [46], serum low density lipoprotein [47] and serum high density lipoprotein [48], serum creatinine [49] serum urea [50] and serum uric acid [51] were determined according to the manufacturer’s instructions using Spectrum Diagnostics and Bio-diagnostic kits (Giza, Egypt).
MDA level is an index of lipid peroxidation and it was estimated by Ohkawa et al [52], glutathione reduced (GSH) [53], nitric oxide (NO) [54] and catalase (CAT) [55] were determined in the liver homogenate supernatant according to the manufactures instructions using Biodiagnostic kits (Giza, Egypt).
Statistical analysis
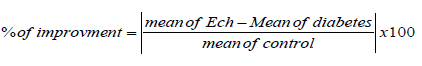
Percentage of improvement used to compare the treatment efficacy of Ech in the both types of diabetes. It takes only positive value and calculated from the following equation:
Diabetic markers
Data recorded in Figure 1 demonstrated that, efficacy of Ech to improve diabetic markers were higher in T1DM than except G6PD which was higher in T2DM.

Figure 1: Percentage of improvement in diabetic markers after administration of Ech.
Liver function
Our data shown in Figure 2 represented that efficacy of Ech to improve liver enzymes was higher in T1DM than T2DM except GGT which higher in T2DM.

Figure 2: Percentage of improvement in liver enzymes after administration of Ech
Lipid profile
Figure 3 revealed that the improve in lipid profile after the treatment with Ech was higher in T1DM than T2DM.

Figure 3: Percentage of improvement in lipid profile after administration of Ech. TG: trigrycrides, TC: total cholesterol, LDL-C: low density lipoprotein cholesterol, HDL-C: high density lipoprotein cholesterol.
Kidney function
According to Figure 4 the improve in kidney function after the treatment with Ech was higher in T1DM than T2DM.

Figure 4: Percentage of improvement in kidney function after administration of Ech.
Oxidative stress markers
Data recorded in Figure 5 demonstrated that, efficacy of Ech to reduce oxidative stress were higher in T1DM than T2DM except GSH which was higher in T2DM.

Figure 5: Percentage of improvement in oxidative stress markers after administration of Ech. MDA: malondialdehyde, GSH: glutathione reduced, CAT: catalse, NO: nitric oxide
The hypoglycemic and antioxidant perpeties of Ech was proved in pervious study [56]. Study the efficacy of Ech in treatment each type of diabetes give general insight about its mechanisms and the behavior of the cells in each type of diabetes. In our study, administration of Ech significantly increased the serum insulin concentration while, glucose concentration decreased significantly in the diabetic rats. There is indirect effect of Ech on pancreas, through inhibition of acetylcholine esterase causing increase level of acetylcholine [57]. Acetylcholine is one of stimulants of insulin release and it is believed to have an important role for regulation of islet cell function [58]. The improvement ability of Ech on glucose and insulin was lower in T2DM than T1DM, which might be due to insulin resistant. The serum arginase activity of diabetic rats decreased after treatment with Ech. Several possible explanations could explain this result: 1) increase insulin level inhibits arginase activity only when the activity of the enzyme is increased, as in DM; 2) decrease plasma glucose concentration inhibit the stimulatory effect of hyperglycemia on plasma arginase activity; 3) and increase of insulin level, restore some other metabolic factor(s) (i.e., elevated plasma free fatty acid levels) to normal level, results in reduced plasma arginase activity [59]. The ability of Ech to improve arginase activity was more pronounced in T1DM than T2DM, which may be due to its higher hypoglycemic activity in T1DM.
In the present study, administration of Ech caused a significant increase in hexokinase activity. The increased activity of hexokinase suggests that enhanced lipid metabolism during diabetes is shifted towards carbohydrate metabolism and it enhances the utilization of glucose at peripheral sites [60]. The improvement percentage of hexokinase was higher in T1DM than T2DM, which conjugated with the high improvement of glucose level in T1DM.
The liver G6PD activity of diabetic rats increased after the treatment with Ech. The higher activity of G6PD in the liver suggests the utilization of glucose by the pentose pathway [61]. The ability of Ech to improve G6PD was higher in T2DM than T1DM. This means that the cells in T1DM prefer pathway of glycolysis in glucose metabolism to compensate the severe reduction in energy. While, in T2DM the cells prefer pentose pathway to compensate the deficiency in glutathione reduced (GSH) as part of an antioxidant system where they have other source of energy (Fats accumulation from the high fat diet). This mechanism confirmed by measure the activity of GSH in liver, where the percentage of improvement was higher in T2DM.
The restorations of serum AST and ALT close to normal levels after treatment with Ech, further strengthen that it is antidiabetic. In addition, our results indicate that ability of Ech to improve aminotransferases activities was higher in T1DM as its hypoglycemic effect was higher than T1DM.
The treatment with Ech caused significant decreases in serum ALP activity of diabetic rats. Reduction in ALP activity shows its stability of biliary function against the damage caused by STZ [62]. As AST and ALT enzymes, the ability of Ech to improve ALP activity was higher in T1DM than T2DM.
In our study, administration of Ech significantly decreased the activity of GGT in diabetic rats. As Ech acted as antioxidant by scavenging free radicals [63], it can reduce the activity of GGT activity. The ability of Ech to improve GGT activity in T2DM was higher than T1DM. This improvement means inhibition the activity of enzyme in serum, which also mean enhance enzyme activity within tissues to receive the high amount of GSH from pentose pathway to transport it into the cells trough Meister’s γ -glutamyl cycle.
The treatment with Ech in the present showed decreases in concentrations of TG, TC, LDL-C and increase level of HDL-C, which may be due to proper stabilization of glucose level and increase in insulin level. Moreover, this effect may be due to decreased intestinal absorption or decreased cholesterol biosynthesis [64]. As expected, the improvement in lipids profile after Ech treatment was higher in T1DM than T2DM, due to the high improvement in glucose and insulin in T1DM.
Administration of Ech improves renal function by improvement glucose and lipid metabolism, enhancement of insulin sensitivity and inhibition of lipid peroxidation process. The ability of Ech to improve renal functions were higher in T1DM than T2DM confirming the high hypoglycemic and antioxidant activities of Ech in T1DM.
Oral administration of Ech caused significant decrease in the liver MDA level of the diabetic rats. Our results indicate that Ech can act through many antioxidant mechanisms, including the scavenging of active oxygen radicals [63] and inhibition of lipid peroxidation [65]. The ability of Ech to improve MDA level was higher in T1DM than T2DM, which could be related the high improvement in insulin and glucose in T1DM.
The results of the present study demonstrated that, the treatment of diabetic rats with Ech caused a significant increase in liver GSH level of the diabetic rats, which may due to regulation of the cell redox potential of Ech [66]. The improvement in GSH level in T2DM was more than T1DM where the cells prefer to use pentose pathway for glucose oxidation in T2DM.
On the other hand, the diabetic group that was administered Ech showed a significant increase in NO concentration. This increase in NO concentration could related to inhibition of arginase activity [67] and decrease hyperglycemia condition [68]. In addition, Ech induce production of acetylcholine [57], which stimulates NOS and increases NO production by vascular endothelial cells [69]. The ability of Ech to improve NO level was higher in T1DM than T2DM, as the improvement in arginase activity and glucose level were higher in T1DM.
The antidiabetic potency of Ech was more effect in T1DM. We recommended that Ech can be used as potential alternative antidiabetic agent to control diabetic complications in types 2 diabetes, but it can be used as complementary agent with insulin for treatment of type 1 diabetes. Also we noticed that the cells in T1DM prefer pathway of glycolysis, while in T2DM the cells prefer pentose pathway.
https://bluecruiseturkey.co
https://bestbluecruises.com
https://marmarisboatcharter.com
https://bodrumboatcharter.com
https://fethiyeboatcharter.com
https://gocekboatcharter.com
https://ssplusyachting.com