Research & Reviews: Journal of Pharmacology and Toxicological Studies
e-ISSN: 2322-0139 p-ISSN: 2322-0120
e-ISSN: 2322-0139 p-ISSN: 2322-0120
Janssen Research and Development, LLC, 1400 McKean Road, Spring House, PA 19477, USA
Received date: December 05, 2017; Accepted date: January 04, 2018; Published date: January 10, 2018
Visit for more related articles at Research & Reviews: Journal of Pharmacology and Toxicological Studies
The objective of the present study was to combine dried serum spot (DSS) and dried blood spot (DBS) techniques with enzyme-linked immunosorbent assay (ELISA) detection for the assessment of anticitrullinated peptide and protein antibodies (ACPA) in rheumatoid arthritis (RA) patients. Two new analytical DSS- ELISA-ACPA and DBS-ELISA-ACPA protocols were developed and validated by comparison to an established serum ELISA-ACPA protocol. Serum samples, from RA patients (n=24) and healthy adults (n=5), were tested. Assay performance in all three protocols was comparable over the ACPA concentration range 20- 1000 U/mL. Intra-assay and inter-assay precision (%CV) of the raw optical density (OD) data ranged from 0.8–4.5% and 13.7-27.3% for the ELISA-ACPA platform (a 10-month period), 5.6–15.3% and 31.0-61.7% for the DSS-ELISA-ACPA platform (a 10-month period), and 7.0-21.2% and 24.3-39.3% for the DBS-ELISA-ACPA platform (a 2-month period), respectively. The raw OD data was fitted using a symmetrical sigmoidal four parameter-logistic (4PL) curve technique. The inter- assay precision (%CV) and accuracy (%Recovery) of the calibration standards ranged from 0.2-12.5% and 85-113% for the ELISA-ACPA platform, 1-32% and 77-106% for the DSS-ELISA-ACPA platform, and 1-19% and 95-105% for the DBS- ELISA-ACPA platform, respectively. Correlation between the ELISA-ACPA and the DSS-ELISA-ACPA platform for 24 RA and 5 healthy control serum samples was high (r=0.9873, p<0.0001). The new DSS/DBS-ELISA-ACPA platforms may be an accurate and economical approach to assess the prevalence and early detection of RA in large-scale population studies.
Dried serum spot, Dried blood spot, ELISA, Rheumatoid arthritis, Biomarkers, Anticitrullinated peptide and protein antibodies, ACPA
The application of filter paper as a cumulative technique to collect and store dried physiological fluids (e.g., serum, plasma, blood, urine, etc.) as matrix spots followed by quantitative and qualitative analytical analysis of these matrix spots was discovered over a hundred years ago [1,2]. This filter paper technique continues to be highly utilized today for a broad range of clinical applications [3-10]. The dried serum spot (DSS) and the dried blood spot (DBS) [11-13] techniques consist of applying a drop (10-40 μL) of serum/blood and allowing it to spread and penetrate a porous filter paper with subsequent evaporation and drying creating a spot. By cutting out a small disc from the spot, the analytes contained in the disc can be extracted from the filter paper using a solvent and detected using an appropriate analytical technique. The selection of a solvent extraction procedure depends heavily on the physical properties of the analyte (e.g., small molecule or macromolecule) and the analytical detection method utilized. The detection of eluted analytes from DSS or DBS has primarily employed analytical techniques including polymerase chain reaction (PCR) DNA amplification assays [14], gas chromatography (GC)/liquid chromatography (LC) techniques combined off- or on-line with tandem mass spectrometry (MS/MS) assays [15], and enzyme-linked immunosorbent assays (ELISA) [16]. These methods are collectively referred to as hyphenated DSS-analytical or DBS-analytical techniques. Between the years 1990 to 2017, the number of publications containing the keyword “dried blood spot” in the SciFinder® database (American Chemical Society, Chemical Abstract Service: Columbus, Ohio, USA) was over five thousand with approximately four hundred publications occurring in 2016. The reasons for the successful application of hyphenated DSS- and DBS-analytical techniques include them being inexpensive and a convenient procedure that is less-invasive than intravenous sampling techniques. Other advantages include a straightforward preservation of blood/serum/plasma samples for short- and long-term storage, a simpler method to transfer samples from one location to another with minimal biohazard risks than liquid samples, a micro-volume sampling size that is widely used in modern analytical methods, and the ease to automate DSS and DBS techniques. DBS-analytical applications have been very successful in areas such as neonatal screening for inherited metabolic diseases [8,13,17,18], screening for drug abuse [19], therapeutic drug monitoring, clinical development programs and a range of bio analysis [5,6,9,10,20,21]. Unfortunately, DSS- or DBSanalytical techniques also have several technical challenges including blood hematocrit levels (i.e., the ratio of the volume of red cells to the volume of whole blood) affecting blood viscosity which in turn influences the formation of blood spots [22] different filter paper giving different quantitative results [23], analyte stability issues, the incomplete solvent elution of analytes from the filter paper which governs accurate quantitation, sensitivity, linearity, accuracy, and precision of analytes at physiologically relevant concentrations, and the incompatibility with analytical methods. Of all these drawbacks, the most important aspect effecting valid results are incomplete drying when creating a spot on the filter paper, and the non-uniformity within the sample spot which can lead to bias and imprecision in the quantitative results. Consequently, new implementations of hyphenated DSS- or DBS-analytical techniques need to be fully validated to provide meaningful physiological results.
Rheumatoid arthritis (RA) is an autoimmune disease affecting up to ~1% of the world’s population [24]. The disease arises when the immune system attacks the lining of the membrane that surrounds and lubricates joints (i.e., the synovium) [25]. While the precise pathogenesis of RA remains unclear, the disease is characterized by extensive synovitis resulting in chronic joint inflammation and loss of glycosaminoglycan lubrication fluids resulting in cartilage and bone damage. RA clinical manifestations such as pain, swelling, and stiffness in the feet, knees, hands, wrist, and elbows typically vary in severity from patient to patient. For patients with established RA, the disease leads to pro-inflammatory composition of cytokines and immune cells [26], the creation of unique serological autoantibodies [27], and changes in cell metabolism activity [28]. Proteomic and metabolomics studies have shown dramatic shifts in cell enzymatic activity and metabolism when comparing RA patients with healthy control volunteers [29,30]. Those with RA are typically prescribed nonsteroidal anti-inflammatory drugs (NSAIDs), corticosteroids, or diseasemodifying antirheumatic drugs (DMARDs), such as methotrexate (MTX) [31,32] which adds a layer of complications to proteomic and metabolomics interpretations. Thus, typical RA patients have unique autoantibodies, endogenous biomarker metabolites, and xenobiotics in their blood, serum, plasma, and synovial fluids that can be used as disease biomarkers [33].
Current data suggest that treating RA early in its course may improve response to therapy and thus, slow down the progression of the disease and prevent disabilities. Clinical symptoms, identification of RA-related autoantibodies, and endogenous biomarker metabolites [34] may assist in early diagnosis of the disease. Common serological turbidimetry and nephelometry assays include the detection of autoantibodies against rheumatoid factor (RF) of immunoglobulins (Ig) including IgG, IgA, and IgM isotypes, and the detection of C-reactive protein (CRP). Serological RA ELISA immunoassays include autoantibodies against the 14-3-3η protein, autoantibodies against carbamylated homo-citrulline containing proteins - a posttranslational modification of lysine in proteins, and levels of anti-perinuclear factors and anti-Sa antibodies which are collectively termed anticitrullinated peptides and protein antibodies (ACPA). RF and CRP are general protein biomarkers for inflammation and thus, may be in healthy individuals and patients with other autoimmune diseases other than RA (e.g., scleroderma, lupus, neuropathy and many others) [35-39]. To date, the citrullinated proteins have been studied extensively. While myelin basic protein, filaggrin, types I and II collagens, and several histone proteins normally contain citrulline peptide residues, proteins such as fibrin, fibrinogen, vimentin, and others are posttranslationally modified in RA patients to citrullinated proteins (Figure 1). It is these posttranslationally modified citrullinated proteins (i.e., antigens) that are created during tissue inflammation that stimulates the production of ACPA. Since ACPA are specific serological biomarkers for diagnosing RA, many citrullinated autoantigens have been identified that can be used in novel indirect immunoassays including autoantibodies against synthetic cyclic citrullinated peptides (CCP) derived from the sequence of human filaggrin (CCP, CCP2, and CCP3), autoantibodies against mutated citrullinated vimentin (MCV), and autoantibodies against citrullinated arginine residues in filament proteins. Studies have indicated that ACPA immunoassays are sensitive and prognostic of RA development since ACPA are present before the onset of RA symptoms [34-43]. The ACPA immunoassays have a high RA specificity to discriminate RA patients from other diseases that produce autoimmune inflammatory responses. Typically, ACPA sensitivities (the ability of the ELISA-APCA assay to correctly identify individuals with RA) range from 60-80% and specificities (the ability of the ELISA-APCA assay to correctly identify individuals without RA) from 85-99%.

Figure 1: Posttranslational modification occurs when the enzyme peptidylarginine deiminase (PAD) hydrolyzes the positively charged NH2-group of arginine amino acids to an oxygen group [39].
In the present article, we have developed analytical protocols for the use of the hyphenated DSS-ELISA and DBS-ELISA platforms with human serum and blood to quantify the RA biomarker ACPA. We have developed these new platforms to support RA community-based survey endeavors to estimate the prevalence and early detection of RA in large-scale population studies. Since the titer of ACPA in RA patients is an essential part of the American College of Rheumatology (ACR)/European League Against Rheumatism (EULAR) RA classification criteria [44,45], it would be more cost-effective, and the results would be more reliable if the epidemiological questionnaire were collected simultaneously with a DBS sample to establish ACPA autoantibody levels [46]. The DSS/DBS-ELISA-ACPA protocols have been developed to ensure accuracy, precision, linearity, reliability, and to establish detection limits. The performance of the new hyphenated techniques was assessed by comparison of matched serum samples from adult individuals with a history of RA (n=24) and healthy (n=5) control samples. While the DBS-ELISA platform is commonly used for clinical applications for several different types of autoantibody [9,10-12,15], the development of RA DSS-ELISA-ACPA and DBS-ELISAACPA platforms has not been reported in the literature to the best of our knowledge.
Chemicals
The following reagents were purchased as an ACPA ELISA kit (catalog number: KA1268) from Abnova (Taipei City, Taiwan): APCA captured antibody (i.e., antigen) bound to 96-well plate microwells; APCA calibrators (0,20,40,100, 300, and 1000 U/ mL) containing phosphate buffered saline (PBS), bovine serum albumin (BSA), detergents, and sodium azide (NaN3, 0.09%); sample buffer containing NaN3 (<0.09%), PBS, BSA, and detergents; detection antibody-horseradish peroxidase (HRP)-conjugate containing the preservative ProClin 300 (0.05%), 2-methyl-4-isothiazolin-3-one (<0.0015%), and 5-chloro-2-methyl-4-isothiazolin- 3-one (<0.0015%); detection substrate solution containing 3,3´,5,5´-tetramethylbenzidine (TMB, 0.04%), dimethyl sulfoxide (DMSO, <1.0 %), and 1,2,6-hexanetriol (<5.0%); stop solution containing hydrochloric acid (HCL, >1-5%) at a pH value <1 at 20°C; wash solution containing tris(hydroxymethyl)aminomethane, detergents, and NaN3 (<0.09%). Deionized water was obtained from an in-house Milli-Q Water purification system (Merck Millipore, Billerica, Massachusetts, USA). Common solvents and reagents were obtained from EMD Chemicals (Gibbstown, New Jersey, USA).
Samples
Human whole blood disodium ethylenediaminetetraacetate (EDTA) samples and the matched set of human serum samples were obtained from Biological Specialty Corporation (Colmar, Pennsylvania, USA). A pooled blood sample (PB01) was prepared by mixing equal volume (2.5 mL) of individual blood samples from four healthy male subjects without RA ranging in age from 25-47 years. Human RA serum samples (RA001 through RA024) were obtained from Janssen Research and Development, LLC (Spring House, Pennsylvania, USA) (Table 1). RA001-RA024 serum samples were collected from patients on a low dose of MTX (5-25 mg/week). The body mass index, height, and weight for each sample are given along with immunoassay RF and anti-CCP2 data. Briefly, the RA serum samples were from 4 male subjects (RA003, RA017, RA022, and RA023) ranging in age from 52-69 years and 20 female subjects ranging in age from 21-76 years. The immunoassay RF and anti-CCP2 data were collected for the RA001- RA024 serum samples by Covance Central Laboratory Services (http://www.covance.com/). The RF data was collected using a latex immunoturbidimetry method with an intra- and inter-assay precision of 2.2%-5.3% and 3.1%-5.8% coefficient of variation (%CV), respectively. The range of the assay was 10-600 U/mL with a value of <15 U/mL being considered negative for RF. The anti-CCP2 data was collected using a Roche Cobas e601 analyzer and a Roche anti-CCP kit (Roche Diagnostics, Indianapolis, Indiana). The intra- and inter-assay precision was 0.6%-1.0% and 1.3%-1.9%, respectively. The range of the assay was 9.0-500 U/mL with a value of <17 U/mL being considered negative for anti-CCP2. Using a negative RA cutoff values of <15 U/mL for the RF data and <17 U/mL for the anti-CCP2 data, samples RA005 and RA012 were both negative in the RF and anti-CCP2 immunoassays. The samples RA002, RA008, and RA020 produced positive or negative results depending on the assay used. The remaining nineteen RA samples were positive in both the RF and anti-CCP2 immunoassays. The RA0025 serum sample obtained from Bioreclamation IVT (Westbury, New York, USA, catalog number: HMSRM-RA) was a RA female subject age 67 years taking 15 mg of MTX daily. The RA0025 serum sample was determined to have an ACPA level of 2000 U/mL and was used in linearity studies. Healthy control human serum samples (HC026 through HC030) were obtained from Bioreclamation IVT (Westbury, New York, USA, catalog number: HMSRM). These serum samples were from healthy male subjects ranging in age from 38-54 years. A pooled serum sample (PS01) was prepared from these samples. The body mass index, height, weight, and anti-CCP2 data for RA025 and HC026-HC030 were not available from Bioreclamation IVT.
| Sample ID | Sample Type | Gender | Age | Body Mass Index (kg/m2) | Height (cm) | Weight (kg) | RF (U/mL) | Anti-CCP2 (U/mL) |
|---|---|---|---|---|---|---|---|---|
| RA001 | RA | F | 54 | 29.72 | 158 | 74.2 | 74 | >500 |
| RA002 | RA | F | 50 | 21.91 | 163 | 58.2 | <15 | >500 |
| RA003 | RA | M | 53 | 28.91 | 160 | 74 | 575 | 26 |
| RA004 | RA | F | 63 | 28.58 | 162 | 75 | 27 | 237 |
| RA005 | RA | F | 27 | 26.64 | 170 | 77 | <15 | <8 |
| RA006 | RA | F | 45 | 29.06 | 169 | 83 | 17 | 345 |
| RA007 | RA | F | 55 | 25.21 | 169 | 72 | 154 | 459 |
| RA008 | RA | F | 59 | 29.76 | 170 | 86 | 19 | <8 |
| RA009 | RA | F | 64 | 28.88 | 158 | 72.1 | 805 | 330 |
| RA010 | RA | F | 45 | 23.51 | 165 | 64 | 149 | 53 |
| RA011 | RA | F | 27 | 27.33 | 171.4 | 80.3 | 133 | 299 |
| RA012 | RA | F | 22 | 27.40 | 165 | 74.6 | <15 | <8 |
| RA013 | RA | F | 34 | 27.79 | 152 | 64.2 | 99 | >500 |
| RA014 | RA | F | 76 | 29.60 | 154 | 70.2 | 171 | 302 |
| RA015 | RA | F | 62 | 27.84 | 158 | 69.5 | 36 | 81 |
| RA016 | RA | F | 38 | 17.69 | 155 | 42.5 | 158 | 340 |
| RA017 | RA | M | 69 | 25.18 | 176 | 78 | 152 | >500 |
| RA018 | RA | F | 58 | 23.03 | 168 | 65 | 39 | >500 |
| RA019 | RA | F | 54 | 21.97 | 172 | 65 | 150 | 19 |
| RA020 | RA | F | 75 | 37.40 | 152 | 86.4 | <15 | >500 |
| RA021 | RA | F | 63 | 27.90 | 156 | 67.9 | 129 | >500 |
| RA022 | RA | M | 50 | 28.24 | 173.5 | 85 | 738 | 160 |
| RA023 | RA | M | 52 | 29.79 | 165 | 81.1 | 297 | 82 |
| RA024 | RA | F | 21 | 18.56 | 169 | 53 | 94 | 53 |
| RA025 | RA | F | 67 | NA* | NA | NA | <15 | NA |
| HC026 | Healthy Control | M | 38 | NA | NA | NA | <15 | NA |
| HC027 | Healthy Control | M | 43 | NA | NA | NA | <15 | NA |
| HC028 | Healthy Control | M | 54 | NA | NA | NA | <15 | NA |
| HC029 | Healthy Control | M | 42 | NA | NA | NA | <15 | NA |
| HC030 | Healthy Control | M | 51 | NA | NA | NA | <15 | NA |
Table 1: Demographics and immunoassay data of samples.
Dried blood spot cards and apparatus
The DSS/DBS cards (FTA-DMPK-C, catalog number: WB129243) were purchased from GE Healthcare Life Sciences (Piscataway Township, New Jersey, USA). Low protein binding tubes (Protein LoBind Tube, catalog number: 022431081) and low protein binding 96-well plates (Protein LoBind Plate, catalog number: 951032107) were purchased from Eppendorf (Hamburg, Germany). The specific apparatus used in the DSS/DBS-ELISA assay is described; however, any model of comparable capability can be easily substituted. The punch (Harris Uni-Core Punch, catalog number: WB100038) and the mat (Harris Cutting Mat, catalog number: WB100020) used to collect the 3.0 mm discs from the DSS/DBS cards were purchased from GE Healthcare Life Sciences. An ELx800 Microplate Reader and an ELx405 Microplate Washer were purchased from Bio-Tek Instruments Inc. (Winooski, Vermont, USA).
Preparation of serum samples from blood samples
After blood samples were allowed to clot, the serum was separated and collected by centrifugation [47]. The serum samples were clear and non-hemolyzed and stored at ≤ -80°C. Before an experiment, serum samples were thawed to room temperature (RT; 20-25°C).
ELISA-ACPA: Preparation of serum samples and the standard calibration serum curve using Abnova’s ACPA kit calibrators
For the ELISA-ACPA assay, all serum samples were diluted 1:100 in sample buffer. The concentrations of ACPA (U/mL) in serum samples were measured from a calibration curve using Abnova’s ACPA kit calibrators with no modifications (e.g. 20, 40, 100, 300, and 1000 U/mL). After performing the ELISA-ACPA, if the ACPA level in the sample was higher than the highest calibration standard (1000 U/mL) in the calibration curve, the serum sample was pre-diluted in pooled normal human serum (PS01) before the 1:100 sample buffer dilution steps to ensure the ACPA value fall within the calibration curve. In cases where a pre-dilution was not used, ACPA values were reported as greater than the highest calibration standard or lower that the lowest calibration standard. The volume of serum required for all calibration and quality control serum samples was 100 mL. All serum samples and calibrators followed the ELISA-ACPA procedure as outlined below.
DSS-ELISA-ACPA and DBS-ELISA-ACPA: Preparation of calibration standards for DSS and DBS
Since it was not possible to commercially obtain an authentic sample of the citrullinated antibody at a known concentration, the following procedure was used to generate DSS/DBS calibration standards. The serum samples RA009 (RF: 805 and anti- CCP2: 330 U/mL; see Table 1) was selected as the source of ACPA reference standard. The ACPA concentration level of RA009 was 1970 ± 355 U/mL using the ELISA-ACPA procedure as outlined below. Thus, RA serum sample RA009 was used as the ACPA master stock solution for all experiments. The RA009 serum stock solution was diluted with pooled normal human serum (PS01) to generate DSS serum calibrators (e.g. 31, 63, 125, 250, 500, 1000 U/mL and 20, 40, 100, 300, 1000 U/mL). Blood calibrators were prepared by taking normal human blood (PB01) and spiking it with the RA009 serum stock solutions to generate DBS blood calibrators (e.g., 20, 50, 100, 250, 500, 1000 U/mL). All blood/serum calibration samples followed the DSS/DBS-ELISA-ACPA procedure as outlined below.
DSS/DBS-ELISA-ACPA: Assay procedure
All reagents were at RT before the start of the experiment and 20 μL of the blood, serum, serum calibrator, blood calibrator and blank solutions were accurately applied into the center of the preprinted circle on the cards without touching the cards with the pipette tips. Care was taken to ensure that the biofluid solutions quickly and thoroughly saturated the circle (front and back) of the filter paper and to avoid not applying multiple drops of solution to the same spot. The DSS/DBS cards were undisturbed for approximately 5 minutes. After this time-period, the cards were air dried for approximately 2 hours at RT in the dark. The DSS/ DBS cards were immediately processed or stored at 4°C for short-term storage (i.e., a few weeks) or -20°C for long-term storage (i.e., a few months) in a sealed plastic bag with desiccant added to reduce humidity. For reliable data, it is extremely important that this procedure is accurately followed.
To process a DSS/DBS card, 3.0 mm discs were punched out from the center of the spot that contained the blanks, the blood/serum calibrators, and the individual blood/serum samples. The discs were placed into 96-well LoBind plates, and 200 μL sample buffer (per sample) was added to the wells. The sample buffer was from the ACPA ELISA kit (catalog number: KA1268) from Abnova (Taipei City, Taiwan) containing NaN3 (<0.09%), PBS, BSA, and detergents. The 96-well LoBind plates were gently shaken for 2 hours at RT for Ig antibody extraction. The extracts were removed from the 96-well LoBind plates and transferred to LoBind tubes. All blood/serum samples and calibration standards followed the ELISA-ACPA procedure as outlined below.
ELISA-ACPA: Assay procedure
The ELISA analyses were performed by Alliance Pharma (http://www.alliancepharmaco.com/quality-performance/expertise/). The quantitative ELISA-ACPA used in this assay was an indirect enzyme immunoassay detection system consisting of an antigen citrullinated protein bound to the wells of a plastic 96-well microtiter plate, positive and negative serum samples containing IgG against the citrullinated protein, anti-antibody-HRP-conjugate and a HPR enzyme substrate. All ELISA components were stored in the dark at 8°C prior to use. Before the start of an experiment, the ELISA components were allowed to warm to RT.
The serum samples, the DSS/DBS samples, the calibration standards and the wash solutions which were previously prepared were allowed to warm to RT. Serum samples (100 μL) and the appreciate calibration samples (100 μL) were added directly into a 96-wells plate containing the coated antigen. The plate was gently shaken at RT for 30 minutes to allow the IgG antibodies against the citrullinated protein present in the samples to bind to the antigen. After this time period, the contents of the microwells were discarded, and the microwells were washed three times with 300 μL of a wash solution. The anti-antibody-HRP-conjugate (100 μL) was added to each microwell, and the plate was gently shaken at RT for 15 minutes to allow the formation of the conjugate/ antibody/antigen complex. After this time period, the contents of the microwells were discarded, and the microwells were washed three times with 300 μL of the wash solution to remove any unbound conjugate. The HRP detection enzyme substrate (i.e., 100 μL, TMB solution) was added to each microwell and allowed with gentle shaking to incubate at RT for 15 minutes. After this time period, the addition of 100 μL of an acid solution was added to each well and allowed to incubate for 5 minutes with gentle shaking at RT. This acid solution process stops the enzyme reaction forming a yellow end-product. The optical density (OD) at 450 nm of this yellow color was measured. The intensity of the yellow color was directly proportional to the concentration of the ACPA present in the serum/blood sample.
ELISA-ACPA: Calibration curve calculations
After the ELISA-ACPA and/or the DSS/DBS-ELISA-ACPA procedures were completed, the OD at 450 nm of the yellow color in the 96-well plate was measured. The raw OD data were acquired using a Bio-Tek microplate reader and processed using Gen5 software (Winooski, Vermont, USA). Additional processing calculations were performed using Microsoft Excel (Redmond, Washington, USA) or GraphPad Prism 6 (La Jolla, California, USA). The mean of the blank OD replicates was measured and subtracted from the raw OD data measurements. Any specified dilution factors were applied to the data. A standard curve was constructed by plotting the concentrations of standards in a log-scale (x-axis) versus the corresponding OD absorbance (y-axis), and fitting with a symmetrical sigmoidal four parameter-logistic (4PL) curve using no weighting.
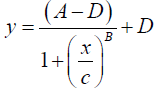 (1)
(1)
The following notation was used for this sigmoidal 4PL equation: y denotes the OD, the letter A denotes the lower asymptote value; B denotes the slope of the curve; C denotes the midpoint concentration value of the curve; D denotes the upper asymptote value; x denotes the concentration of ACPA in U/mL units. The concentrations of ACPA in samples were determined based on the standard curve and the following back-fit equation.
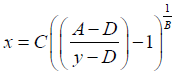 (2)
(2)
It is important to remember that the sigmoidal 4PL equation can only be used to calculate results for sample measurements within the lower asymptote value A and the upper asymptote value D. The equation should not be used to interpolate ACPA concentration outside this range. Also, the accuracy of the calculated ACPA concentration at the extreme range of the sigmoidal 4PL equation will be reduced as small changes in OD values result in a large change in the calculated concentration.
The concentrations of ACPA in DBS can be estimated from both the kit calibration curve and the DBS calibration curve. If a kit calibration curve was used for measuring ACPA concentration in DBS, a blank card disc was added to each kit standard (one 3.0 mm disc per 200 uL of the standard solution). The kit standards also went thought the same extraction procedure as the DBS samples.
Statistical analysis
Univariate data analyses were performed using Microsoft Excel (Redmond, Washington, USA) or GraphPad Prism 6 (La Jolla, California, USA) software for the statistical comparison of data. The mean, standard deviation (SD), the Pearson’s R correlation, %CV (SD/Mean), and %Recovery (Observed/Expected) were calculated. Values are reported as the mean±SD. Statistical significance analysis was performed using an unpaired Student’s t-test with p<0.05 indicating statistical significance.
ELISA-ACPA Kit Standards Intra/Interday precision and accuracy studies
For comparison and validation purposes, the precision and accuracy of the ELISA-ACPA, the DSS-ELISA-ACPA, and the DBS-ELISA-ACPS assays were determined. The intraday (within-run) and the interday (between-run) precision and accuracy were determined for the Abnova ELISA-ACPA kit by analyzing ACPA concentration standards supplied by the manufacturer, 24 RA serum samples (RA001 through RA024) and 5 healthy serum samples (HC026 through HC030). Linear-log coordinates were used to plot the raw OD data against the ACPA concentration (U/mL) standards supplied in the ELISA-ACPA kit as shown in Figure 2. The intraday precision which is defined as the %CV between replicate samples was assessed with 3 replicate samples and ranged from 0.8-4.5% with an average precision of 2.5 ± 1.6%. The interday precision was assessed with 6 replicate samples over a 10-month period and ranged from approximately 13.7-27.3% with an average precision of approximately 20.6 ± 4.9%.

Figure 2: Intraday and interday optical density (OD) data for ELISA-ACPA standards from the purchased Abnova ELISA-ACPA kit. The interday data were collected over a 10 month period. The mean and the standard deviation (SD) were calculated for each ACPA concentration. Precision was defined as the percent coefficient of variation (%CV=SD/Mean) between replicate samples.
The raw optical density data was fitted using the sigmoidal 4PL curve given in equation 1 and the results are shown in Table 2. The R-squared, the mean, and the standard deviation were calculated using standard statistical methods. The lower asymptote A value varied significantly while the other parameters were reasonably reproducible for the intra- and inter-assays. Using the individual 4PL parameters, the raw OD data was converted to ACPA concentration (U/mL) units using equation 2 and averaged (Table 3). Over the ACPA concentration range of 20 – 1000 U/mL, the ELISA-ACPA assay showed an average intraday precision (%CV) of approximately 3.1 ± 4.5% and an average intraday accuracy (%Recovery) of 99 ± 11%. Here accuracy was defined as the percent recovery of the observed mean value divided by the expected value. The ELISA-ACPA assay showed an average interday precision of approximately 5.0 ± 5.3% and an average interday accuracy of 99 ± 10%. These results were consistent with the manufactory’s reported intraday (5.7%) and interday precision (7.4%).
| Intraday Curve Statistics | A | B | C | D | R2 |
|---|---|---|---|---|---|
| Mean | 0.0692 | 0.969 | 698 | 4.51 | 0.9994 |
| SD | 0.0657 | 0.151 | 396 | 1.00 | 0.0002 |
| Precision (%CV) |
94.9 | 15.6 | 56.7 | 22.2 | 0.02 |
| Interday Curve Statistics | A | B | C | D | R2 |
| Mean | -0.0060 | 0.947 | 502 | 4.62 | 0.9992 |
| SD | 0.1760 | 0.197 | 271 | 0.677 | 0.0011 |
| Precision (%CV) |
-2933 | 20.8 | 54.0 | 14.7 | 0.1 |
Table 2: Average calibration curve fitting parameters for ELISA-ACPA Kit Standards: Intraday (n=3) and interday (n=6).
| Intraday Sample | Expected (U/mL) | Observed (U/mL) n=3 | Precision (%CV) | Accuracy (%Recovery) |
|---|---|---|---|---|
| 1 | 20 | 17 | 10.3 | 85 |
| 2 | 40 | 46 | 4.5 | 115 |
| 3 | 100 | 96 | 0.5 | 96 |
| 4 | 300 | 302 | 0.0 | 101 |
| 5 | 1000 | 999 | 0.0 | 100 |
| Interday Sample | Expected (U/mL) | Observed (U/mL) n=6 | Precision (%CV) | Accuracy (%Recovery) |
| 1 | 20 | 17 | 12.5 | 85 |
| 2 | 40 | 45 | 8.5 | 113 |
| 3 | 100 | 96 | 3.0 | 96 |
| 4 | 300 | 302 | 0.7 | 101 |
| 5 | 1000 | 998 | 0.2 | 100 |
Table 3: ELISA-ACPA Kit Standards: Intraday and interday calibration.
In Table 4, an intraday linearity study was performed on a RA serum sample (RA009; 1970 ± 355 U/mL). The linearity dynamic range was assessed using 3 replicate samples over a concentration range of 31-985 U/mL. RA009 serum sample was serially diluted in a pooled serum sample (PS01) to examine the intraday upper, median and lower end of the assays concentration range. The upper concentration range (985-493 U/mL) had a precision that ranged from 3-14% while the accuracy ranged from 106-146%. The median concentration range (246-123 U/mL) had a precision that ranged from 5-7% while the accuracy ranged from 86-109%. The lower concentration (62-31 U/mL) had a precision that ranged from 7-8% while the accuracy ranged from 81-89%. These results were consistent with reported linearity studies for this particular ELISA-ACPA assay. The manufacturer’s suggested negative RA cutoff value for this particular ELISA-ACPA assay was <20 U/mL.
| Dilution | Replicates | Expected (U/ml) | Observed (U/ml) | Mean (U/mL) |
SD (U/mL) |
Precision (%CV) |
Accuracy (%Recovery) |
|---|---|---|---|---|---|---|---|
| 1:2 | 1 | 985 | 1104 | 1042 | 149 | 14 | 106 |
| 2 | 985 | 1149 | |||||
| 3 | 985 | 872 | |||||
| 1:4 | 1 | 493 | 730 | 719 | 22 | 3 | 146 |
| 2 | 493 | 734 | |||||
| 3 | 493 | 693 | |||||
| 1:8 | 1 | 246 | 263 | 267 | 14 | 5 | 109 |
| 2 | 246 | 256 | |||||
| 3 | 246 | 283 | |||||
| 1:16 | 1 | 123 | 113 | 106 | 7 | 7 | 86 |
| 2 | 123 | 99 | |||||
| 3 | 123 | 108 | |||||
| 1:32 | 1 | 62 | 60 | 55 | 4 | 7 | 89 |
| 2 | 62 | 52 | |||||
| 3 | 62 | 52 | |||||
| 1:64 | 1 | 31 | 22 | 25 | 2 | 8 | 81 |
| 2 | 31 | 26 | |||||
| 3 | 31 | 26 |
Table 4: ELISA-ACPA Kit standards: Intraday linearity results for RA009 sample*.
ELISA-ACPA levels in RA human serum samples
The intraday precision of 24 RA serum samples (RA001 through RA024) and 5 healthy serum samples (HC026 through HC030) was measured using the ELISA-ACPA assay (Figure 3). For ACPA concentration levels, in the range of 20-200 U/mL the precision was on the average 28%, in the range of 200-500 U/mL the precision was on the average 17%, and in the range of 500- 1000 U/mL the precision was on the average 13%. Serum samples RA005, RA006, RA008, RA012, RA015, and RA019 had ACPA concentration levels <20 U/mL and thus, these samples were considered negative for RA according to the ELISA-ACPA assay. It is interesting to note that RA005 and RA012 both were negative for RA using the RF (i.e., cutoff <15 U/mL negative for RA) and anti- CCP2 ((i.e., cutoff <17 U/mL negative for RA) immunoassays (Table 1) and thus, consistent with the current results. The remaining 4 samples RA006, RA008, RA015, and RA019 produced mixed positive/negative results between the three assays. The 5 healthy control serum samples (HC026 through HC030) had ACPA concentration levels <20 U/mL (data not shown in Figure 3).

Figure 3: Interday ACPA results from a set of 24 human RA serum samples (RA001-RA 0024) using the ELISA-ACPA calibration curves described in Figure 2. The interday data for RA samples were collected over a 10-month period.
In summary, the three immunoassays (RF and anti-CCP2, Table 1 and ACPA, Figure 3) were consistent in predicting positive or negation RA cutoff values for all RA serum samples (RA001-RA024) except for RA002, RA006, RA008, RA009, RA019 and RA020 where mixed positive/negative results between the three immunoassays were observed. Comparing the anti-CCP2 and ELISA-ACPA immunoassay data, we observed that the two techniques were consistent in predicting positive or negation RA cutoff values for all RA serum samples (RA001-RA024) except for RA006 and RA015.
DSS-ELISA-ACPA Standards intra/interday precision and accuracy studies
The intraday and the interday precision and accuracy were determined for the DSS-ELISA-ACPA platform for the 24 RA serum samples (RA001 through RA024) and 5 healthy serum samples (HC026 through HC030). Linear-log coordinates were used to plot the raw OD data using serum standard RA009 as the ACPA stock solution to prepare calibration standards as shown in Figure 4. The intraday precision was assessed with 3 replicate samples and ranged from 5.6-15.3% with an average precision of 11.2 ± 4.0%. The interday precision was assessed with 4 replicate samples over a 10-month period and ranged from approximately 31.0-61.7% with an average precision of approximately 51.8 ± 12.1%. The raw OD data was fitted using the sigmoidal 4PL curve given in equation 1. Using the individual 4PL parameters (Table 5), the raw OD data was converted to ACPA concentration (U/mL) units using equation 2 and the averaged results are given in Table 6. Over the ACPA concentration range of 20-1000 U/mL, the DSS-ELISA-ACPA assay showed an average intraday precision of approximately 20.6 ± 20.6% and an average intraday accuracy of 92.2 ± 21.0%. Over the ACPA concentration range of 31-1000 U/mL, the DSS-ELISA-ACPA assay showed an average interday precision of approximately 13.5 ± 12.1% and an average interday accuracy of 95.0 ± 12.1%.
| Intraday Curve Statistics | A | B | C | D | R2 |
|---|---|---|---|---|---|
| Mean | 0.2127 | 1.092 | 12573.3 | 35.367 | 0.9987 |
| SD | 0.0361 | 0.146 | 6534.4 | 16.850 | 0.0015 |
| Precision (%CV) |
17.0 | 13.4 | 52.0 | 47.6 | 0.2 |
| Interday Curve Statistics | A | B | C | D | R2 |
| Mean | 0.1709 | 1.427* | 3377.7 | 6.787 | 0.9990 |
| SD | 0.1213 | 0.393 | 5300.9 | 6.650 | 0.0010 |
| Precision (%CV) |
71.0 | 27.5 | 156.9 | 98.0 | 0.1 |
Table 5: Average calibration curve fitting parameters for DSS-ELISA-ACPA Standards: Intraday (n=3) and interday results (n=4).
| Intraday Sample | Expected (U/mL) | Observed (U/mL) n=3 | Precision (%CV) | Accuracy (%Recovery) |
|---|---|---|---|---|
| 1 | 20 | 16 | 44 | 80 |
| 2 | 40 | 26 | 39 | 65 |
| 3 | 100 | 120 | 19 | 120 |
| 4 | 300 | 296 | 1 | 99 |
| 5 | 1000 | 1001 | 0 | 100 |
| Interday Sample | Expected (U/mL) | Observed (U/mL) n=4 | Precision (%CV) | Accuracy (%Recovery) |
| 1 | 31.3 | 24 | 32 | 77 |
| 2 | 62.5 | 52 | 23 | 83 |
| 3 | 125 | 131 | 15 | 105 |
| 4 | 250 | 266 | 6 | 106 |
| 5 | 500 | 490 | 4 | 98 |
| 6 | 1000 | 1005 | 1 | 101 |
Table 6: DSS-ELISA-ACPA Standards: Intraday (n=3) and Interday Results (n=4).

Figure 4: Intraday and interday optical density (OD) serum data for DSS-ELISA-ACPA using serum standard RA009 1970 ± 355 U/mL as the ACPA stock solution. The stock solution was arbitrarily set to 2000 U/mL. The interday data were collected over a 10 month period. The mean and the standard deviation (SD) were calculated for each ACPA concentration. Precision was defined as the percent coefficient of variation (%CV=SD/ Mean) between replicate samples.
In Table 7, a linearity study was performed on RA serum sample RA0025 using the DSS-ELISA-ACPA platform. This RA serum sample was serially diluted in a pooled serum sample (PS01) and applied to the DBS card to examine the upper, the median and the lower end of the assays concentration range. The linearity dynamic range was assessed using 3 replicate samples over a concentration range of 500-62.5 U/mL. The upper concentration 500 U/mL had a precision of 3% while the accuracy was 103%. The median concentration range (250-125 U/mL) had a precision that ranged from 1-4% while the accuracy ranged from 115- 126%. The lower concentration 62.5 U/mL had a precision of 21% while the accuracy was 93%.
| Dilution | Replicates | Expected (U/ml) | Observed (U/ml) | Mean | SD | Precision (%CV) |
Accuracy (%Recovery) |
|---|---|---|---|---|---|---|---|
| 1:4 | 1 | 500 | 533 | 516 | 16 | 3 | 103 |
| 2 | 500 | 511 | |||||
| 3 | 500 | 504 | |||||
| 1:8 | 1 | 250 | 292 | 288 | 4 | 1 | 115 |
| 2 | 250 | 284 | |||||
| 3 | 250 | 288 | |||||
| 1:16 | 1 | 125 | 151 | 157 | 6 | 4 | 126 |
| 2 | 125 | 158 | |||||
| 3 | 125 | 163 | |||||
| 1:32 | 1 | 62.5 | 64 | 58 | 12 | 21 | 93 |
| 2 | 62.5 | 45 | |||||
| 3 | 62.5 | 66 |
Table 7: DSS-ELISA-ACPA intraday linearity results for RA0025 sample*
DSS-ELISA-ACPA levels in RA human serum samples
The intraday precision of 24 RA serum samples (RA001 through RA024) and 5 healthy serum samples (HC026 through HC030) was measured using the DSS-ELISA-ACPA assay (Figure 5). For ACPA concentration levels in the range of 20-200 U/ mL the precision was on the average 27%, in the range of 200 – 500 U/mL the precision was on the average 25%, and in the range of 500-1000 U/mL the precision was on the average 26%. All 24 RA serum samples (RA001 through RA024) had ACPA concentrations >20 U/mL and thus, all samples were considered positive for RA. The 5 healthy serum samples (HC026 through HC030) had ACPA concentration levels <20 U/mL and were considered negative for RA (data not shown).

Figure 5: Interday DSS-ELISA-ACPA results from a set of 24 human RA serum samples (RA001-RA 0024) using the DSS-ELISA-ACPA calibration curves (RA009 1970 ± 355).
Comparing the ELISA-ACPA and DSS-ELISA-ACPAACPA immunoassay data, we observed that the two techniques were consistent in predicting positive cutoff values for 18 RA serum samples. Serum samples RA005, RA006, RA008, RA012, RA015 and RA019 produced mixed positive/negative results between the two techniques.
DBS-ELISA-ACPA Standards intra/interday precision and accuracy studies
DBS calibration standards were prepared using the human RA serum sample RA009 (1970 ± 355 U/mL) as an ACPA stock solution. Blood calibrators were prepared by taking pooled normal human blood (PB01) and spiking it with the RA serum stock solutions to generate DBS blood calibrators (e.g. 20, 50, 100, 250, 500, 1000 U/mL). The intraday and the interday precision and accuracy for each calibration standard were determined for the DBS-ELISA-ACPA platform where linear-log coordinates were used to plot the raw optical density data against the calibration standards as shown in Figure 6. The intraday precision was assessed with 3 replicate samples and ranged from 7.0-21.2% with an average precision of 13.1 ± 4.6%. The interday precision was assessed with 3 replicate samples over a 2-month period and ranged from 24.0-39.3% with an average precision of approximately 29.9 ± 6.0%. The raw OD data was fitted using the sigmoidal 4PL curve given in equation 1 (Table 8). Using the individual 4PL parameters, the raw OD data was converted to ACPA concentration (U/mL) units using equation 2 and averaged (Table 9). Over the ACPA concentration range of 20-1000 U/mL, the DBS-ELISA-ACPA assay showed an average intraday precision of approximately 4.8 ± 2.2% and an average intraday accuracy of 102.3 ± 5.9%. The DBS-ELISA-ACPA assay showed an average interday precision of approximately 5.2 ± 7.3% and an average interday accuracy of 99.7 ± 3.7%.
| Intraday Curve Statistics | A | B | C | D | R² |
|---|---|---|---|---|---|
| Mean | 0.1864 | 1.231* | 6073 | 10.31 | 0.9976 |
| SD | 0.0940 | 0.054 | 5259 | 5.909 | 0.0019 |
| Precision (%CV) | 50.5 | 4.4 | 86.6 | 57.3 | 0.2 |
| Interday Curve Statistics | A | B | C | D | R² |
| Mean | 0.202 | 1.283 | 10797 | 15.70 | 0.9983 |
| SD | 1.283 | 0.710 | 18102 | 20.18 | 0.0015 |
| Precision (%CV) | 635 | 55.3 | 167.7 | 128.6 | 0.2 |
Table 8: Average Calibration Curve Fitting Parameters for DBS-ELISA-ACPA Standards: Intraday (n=3) and Interday Results (n=3).
| Intraday Sample | Expected (U/mL) | Observed (U/mL) n=3 | Precision (%CV) | Accuracy (%Recovery) |
|---|---|---|---|---|
| 1 | 20 | 21 | 8 | 105 |
| 2 | 50 | 56 | 7 | 112 |
| 3 | 100 | 99 | 3 | 99 |
| 4 | 250 | 241 | 5 | 96 |
| 5 | 500 | 518 | 3 | 104 |
| 6 | 1000 | 984 | 3 | 98 |
| Interday Sample | Expected (U/mL) | Observed (U/mL) n=3 | Precision (%CV) | Accuracy (%Recovery) |
| 1 | 20 | 19 | 1 | 95 |
| 2 | 50 | 49 | 19 | 98 |
| 3 | 100 | 105 | 8 | 105 |
| 4 | 250 | 245 | 1 | 98 |
| 5 | 500 | 514 | 1 | 103 |
| 6 | 1000 | 989 | 1 | 99 |
Table 9: DBS-ELISA-ACPA Standards: Intraday (n=3) and Interday Results (n=3).

Figure 6: Intraday and interday optical density (OD) serum data for DBS-ELISA-ACPA using serum standard RA009 1970 ± 355 U/mL as the ACPA stock solution that was spiked into a blood sample (PB01). The stock solution was arbitrarily set to 2000 U/mL. The interday data were collected over a 2-month period. The mean and the standard deviation (SD) were calculated for each ACPA concentration. Precision was defined as the percent coefficient of variation (%CV=SD/Mean) between replicate samples.
In Table 10, a linearity intraday study was performed on RA serum sample RA009 using the DBS-ELISA-ACPA platform. This RA serum sample was spiked into a pooled blood sample (PB01) and then serially diluted using the same pooled blood sample. These samples were applied to the DBS card to examine the upper, median and lower end of the assays concentration range. The linearity dynamic range was assessed using 3 replicate samples over a concentration range of 62.5-500 U/mL. The upper concentration 500 U/mL had a precision of 7% while the accuracy was 103%. The median concentration range (250-100 U/mL) had a precision that ranged from 5-12% while the accuracy ranged from 96-105%. The lower concentration 62.5 U/mL had a precision of 11% while the accuracy was 90%.
| Dilution | Replicates | Expected (U/ml) | Observed (U/ml) | Mean | SD | Precision (%CV) | Accuracy (%Recovery) |
|---|---|---|---|---|---|---|---|
| 1:4 | 1 | 500 | 486 | 513 | 38 | 7 | 103 |
| 2 | 500 | 556 | |||||
| 3 | 500 | 496 | |||||
| 1:8 | 1 | 250 | 248 | 240 | 13 | 6 | 96 |
| 2 | 250 | 225 | |||||
| 3 | 250 | 248 | |||||
| 1:16 | 1 | 100 | 105 | 105 | 13 | 12 | 105 |
| 2 | 100 | 119 | |||||
| 3 | 100 | 93 | |||||
| 1:32 | 1 | 62.5 | 57 | 56 | 6 | 11 | 90 |
| 2 | 62.5 | 49 | |||||
| 3 | 62.5 | 61 |
Table 10: DBS-ELISA-ACPA Intraday Linearity Results for RA009 Sample*
Comparison of the ELISA-ACPA, DSS-ELISA-ACPA, and DBS-ELISA-ACPA platforms
For comparison purposes with the new DSS-ELISA-ACPA and DBS-ELISA-ACPA platforms, the intraday and interday precision and accuracy of the ELISA-ACPA platform was determined in Figure 2 and Tables 1-3. In this experiment, serum samples were directly analyzed in the ELISA. As expected, the precision of the intraday OD data was significantly better than the interday OD data (Figure 2). However, the calibration curve fitting parameters for the OD data as shown in Table 2 suggested that the overall sigmoidal shape of the intraday and interday curves were similar. The B parameter in Table 2 is equivalent to the Hill coefficient and gives information on the cooperative of ligand binding [48]. Note that both the intraday and interday B parameters were approximately one with good precision ranging from approximately 16-21%; this result suggests that the affinity of the antigen for the antibody is not dependent on whether or not another antigen is already bound to the antibody. Because the serum calibration standards and the serum samples were subjected to the same systematic experimental errors, the precision and the accuracy of the intraday and interday calibrated ACPA concentration levels were similar (Tables 3 and 4).
For the DSS-ELISA-ACPA platform, the serum samples were first applied to a filter paper, then extracted off the filter paper, and then analyzed in the ELISA. The intraday and interday precision and accuracy of the DSS-ELISA-ACPA platform was determined in Figure 4 and Tables 5 and 7. The precision of the intraday OD data was significantly better than the interday OD data (Figure 4). Comparing the OD precision data between the ELISA-ACPA and DSS-ELISA-ACPA platforms (Figures 2 and 4), there was about a 4-fold overall decrease in the precision of the intraday OD data and about a 3-fold decrease in precision of the interday OD data for the DSS-ELISA-ACPA platform. This decrease in OD precision between the ELISA-ACPA and DSS-ELISA-ACPA platforms was not unexpected and was presumably produced by the added subjected to the same systematic experiment errors for the DSS-ELISA-ACPA, the precision and the accuracy of the calibrated intraday and interday ACPA concentration levels between the ELISA-ACPA (Tables 3 and 4) and DSS-ELISA-ACPA (Tables 6 and 7) platforms were similar.
For the DBS-ELISA-ACPA platform, the serum samples were first spiked into blood, then applied to a filter paper, then extracted off the filter paper, and then analyzed in the ELISA. The intraday and interday precision and accuracy of the DBS-ELISAACPA platform was determined in Figure 6 and Tables 8-10. The precision of the intraday OD data was significantly better than the interday OD data (Figure 7). Comparing the OD precision data between the DSS-ELISA-ACPA and DBS-ELISA-ACPA platforms (Figures 2 and 4), the intraday precision was approximately the same while the interday precision was approximately 2-fold better for the DBS-ELISA-ACPA platform. It should be remembered that the DSS-ELISA-ACPA OD data was collected over a 10-month period while the DBS-ELISA-ACPA OD data was collected over a 2-month period. Thus, observed precision similarities and differences should be considered tentative. The calibration curve fitting parameters for the DBS-ELISA-ACPA OD data suggested that the overall sigmoidal shape of the intraday and interday curves were similar (Table 8). It was noted that the intraday B parameter (1.231) for the DBS-ELISA-ACPA platform was statistically greater (p<0.05) when compared to the intraday B parameter (0.969) for the ELISA-ACPA platform (Table 2). It is again inferred that there is a suggestion of positive cooperative binding for the intraday DSS-ELISA-ACPA platform [48]. Since the serum calibration standards and the serum samples are subjected to the same systematic experiment errors for the DBS-ELISA-ACPA, the calibrated intraday and interday precision and accuracy between the ELISA-ACPA (Tables 3 and 4), DSS-ELISA-ACPA (Tables 6 and 7), and DBS-ELISA-ACPA (Tables 9 and 10) platforms were all comparable.

Figure 7: Comparison of ELISA-ACPA and DSS-ELISA-ACPA data from a set of 24 human RA serum samples (RA001- RA 0024). The error bars are the standard deviation (SD) from three interday data set collected over a 10-month period (see Figures 2 and 4).
Experimental error in day-to-day extraction efficiencies of the antibody from the filter paper. The calibration curve fitting parameters for the DSS-ELISA-ACPA OD data suggested that the overall sigmoidal shape of the intraday and interday curves were again similar (Table 5). However, it was noted that the B parameters in Table 5 had slightly increased when compared to the B parameters for the ELISA-ACPA platform (Table 2). However, only the interday B parameter (1.427) for the DSS-ELISA-ACPA platform was statistically greater (p<0.05) when compared to the interday B parameter (0.947) for the ELISA-ACPA platform. This positive increase in the Hill coefficient may suggest a positive cooperative binding for the interday DSS-ELISA-ACPA platform; however, more data would be required to establish this point. Since the serum calibration standards and the serum samples are;
Comparison of the ELISA-ACPA and Anti-CCP2 for a set of 24 human RA serum samples
The correlation between the ACPA concentration levels determined by the ELISA-ACPA platform used in this study and the anti-CCP2 concentration levels provided in Table 1 for the 24 RA serum samples (RA001 through RA024) is shown in Figure 8. It is clear that there is a strong positive/negative correlation between the two datasets. Using a negative RA cutoff value of <20 U/mL for the ELISA-ACPA platform, samples RA005, RA006, RA008, RA012, RA015, and RA019 would be considered negative for RA. Using a negative RA cutoff value of <17 U/mL for the anti-CCP2 data [49], samples RA005, RA008, and RA012 would be considered negative for RA. Therefore, only 3 (i.e., RA006, RA015, and RA019) out of 24 samples produced mixed positive/ negative results. Since the assays used different antigens, the absolute antibody concentration could be considerably different between the assays.

Figure 8: Comparison of ELISA-ACPA (Figure 3) and anti-CCP2 (Table 1) data from a set of 24 human RA serum samples (RA001-RA 0024). The asterisk (*) represents anti-CCP2 values >500 U/mL and the cross (†) represents anti-CCP2 values <8 U/mL. The error bars for the ELISA-ACPA platform is the standard deviation (SD) from six interday data sets collected over a 10-month period.
Comparison of the DSS-ELISA-ACPA and Anti-CCP2 for a set of 24 human RA serum samples
There is a strong positive correlation between DSS-ELISA-ACPA platform and the anti-CCP2 immunoassay (Table 1) for the 24 RA serum samples (RA001 through RA024) used in this study. Using a positive RA cutoff value of >20 U/mL for the DSS-ELISAACPA assay and >17 U/mL for the anti-CCP2 assay, it was observed that 21 samples out of 24 samples were in agreement. The remaining 3 samples RA005, RA008, and RA012 produced mixed positive/negative results.
Comparison of the ELISA-ACPA and DSS-ELISA-ACPA platforms for a set of 24 human RA serum samples
The ACPA concentration levels were determined for the ELISA-ACPA and DSS-ELISA-ACPA platforms for 24 RA serum samples (RA001 through RA024) and 5 healthy serum samples (HC026 through HC030). As shown in Figure 7, the two platforms produced concentration data that were highly correlated. Correlation between the serum ELISA-ACPA and the DSS-ELISA-ACPA platform was high (r=0.97, p<0.0001). In general, the ACPA concentration levels for the 24 RA samples determined by the DSS-ELISAACPA platform were less that those determined by the ELISA-ACPA platform except for a few RA samples that contained low concentration levels of ACPA (i.e., RA003-RA006, RA008, and RA009). The sample RA012 was particularly interesting since the ACPA concentration level for this sample was significantly higher for unknown reasons - in the DSS-ELISA-ACPA platform when compared to the ELISA-ACPA platform. The 5 healthy serum samples (HC026 through HC030) showed ACPA concentration levels <20 U/mL (data not shown) for both platforms.
Since all RA samples came from patients that were confirmed to have RA and using >20 U/mL of ACPA as a positive cutoff for patients having RA, the ability of the ELISA-APCA assay to correctly identify individuals with RA (i.e., sensitivity) was 75% and the ability of the ELISA-APCA assay to correctly identify individuals without RA (i.e., specificity) was 100%.
In conclusion, the DSS-ELISA-ACPA or the DBS-ELISA-ACPA performed in a manner consistent with the ELISA-ACPA platform. Since only 24 RA samples were used to validate the DSS-ELISA-ACPA platform, a clinically relevant specificity and sensitivity of the new platforms cannot be determined in the present study. However, the data suggest that both the specificity and sensitivity of the DSS-ELISA-ACPA platform was similar to the ELISA-ACPA platform (i.e., sensitivity 60-80% and specificity 85-99%) and a negative RA cutoff value of <20 U/mL maybe reasonable for the DSS-ELISA-ACPA and the DBS-ELISA-ACPA platforms. Finally, there was a strong positive correlation between the ELISA-ACPA and DSS-ELISA-ACPA platforms (R=0.9873). The “gold standard” anti-CCP2 immunoassay for the 24 RA serum samples (RA001 through RA024) has the same high/low trend for the ELISA-ACPA and DSS-ELISA-ACPA platforms. The study suggests that a DSS- or DBS-ELISA-ACPA assay can be further developed as a reliable, economical and uncomplicated approach for clinical testing.