International Journal of Innovative Research in Science, Engineering and Technology
ISSN ONLINE(2319-8753)PRINT(2347-6710)
ISSN ONLINE(2319-8753)PRINT(2347-6710)
Ezeofor C. J.1, Ndinechi M.C.2
|
| Related article at Pubmed, Scholar Google |
Visit for more related articles at International Journal of Innovative Research in Science, Engineering and Technology
This paper presents Graphical User Interface (GUI) for simulating convolutional coding with Viterbi decoding in digital communication system using MATLAB. Digital transmission is not free from channel impairments such as noise, interference and fading which cause signal distortion and degradation in signal to noise ratio. These introduce a lot of errors on the information bits sent from one place to another. To address these problems, Convolutional coding is introduced at the transmitter side and Viterbi decoding at the receiver end to ensure consistent error free transmission. In order to visualize the effect and evaluate the performance of the coding and decoding used, simulation programs that encode and decode digital data were designed, written and tested in MATLAB. The generated bit error rate (BER) is plotted against Energy per bit to noise spectral density (Eb/No) for different digital input data. It is seen that as Eb/No increases, bit error rate decreases thereby increasing the performance of the convolutional code rate used in the transmission channel at both end. Further analysis and discussion were made based on the MATLAB graph results obtained.
Keywords |
| MATLAB, GUI, Convolutional coding, BER, SNR, Viterbi decoding |
I. INTRODUCTION |
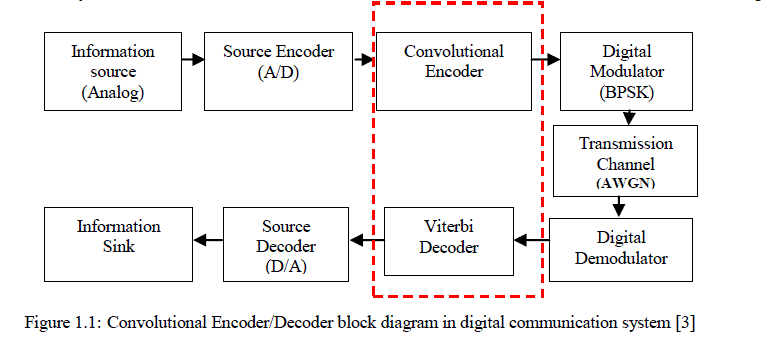
| The main aim of a digital communication system is to transmit information reliably over a channel [1]. The channel can be coaxial cables, microwave links, space, fiber optics etc. and each of them is subject to various types of noise, distortion and interference that lead to errors. Shannon proves that there exist channel-encoding methods which enable information to be transmitted reliably when source information rate R is less than channel capacity C. It is possible to design a communication system for that channel and with the help of error-control coding such as convolutional coding, one can achieve a very small probability of output error for that channel. As mentioned in [2], some forms of error control encoding that are used to recover some corrupted information are discussed. Convolutional coding is one of the channel coding extensively used for real time error detection and correction as shown in figure 1.1 [3]. |
 |
II. RELATED WORK |
| The related researched works are not limited to: |
| a. Performance Analysis of Convolutional Encoder Rate Change by Sw Bawane and W Gohoker (2014) which explained the modified FPGA scheme for the convolutional encoder in OFDM baseband processing systems. It shows convolutional encoder with constraint length of 9. |
| b. Design of a high speed parallel encoder for convolutional codes by A Msir, F Monteiro, and A Dandache (2004). In their paper, the design of high speed parallel architectures for convolutional encoders and its implementation on FPGA devices were done. |
| c. FPGA design and implementation of a convolutional encoder and a Viterbi decoder based on 802.11a for OFDM by Y Sun, and Z Ding (2012). They carried out a modified FPGA scheme for the convolutional encoder and Viterbi decoder based on the IEEE 802.11a standards of WLAN in OFDM based processing systems. |
III. METHODOLOGY |
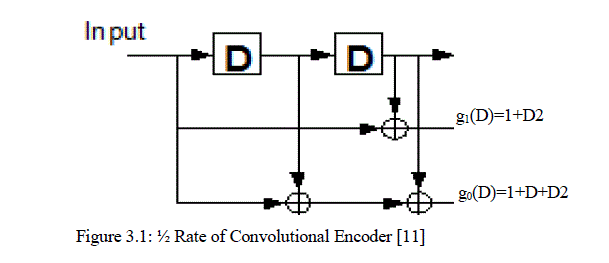
| This research work considered convolutional encoder of (n=2, k=1, K=3) as shown in figure 3.1. The generator polynomials for the chosen encoder are g0(D)= 1+D+D2 = 1112 or 78 and g1(D)=1+D2=1012 or 58. The generator polynomials that would be used depend on the convolutional encoder rate being considered |
 |
| 3.1. How convolutional coding is done |
| This can be understood using set of sequence of information bits sent serially into the ½ convolutional encoder diagram shown in figure 3.1. Let’s look at the digitized sample input information bits k = [1111010]2 = [172]8. This would be carried out into different stages at different clock input. The encoder first initializes its shift-register memory D=0 and D2=0 at clock input. |
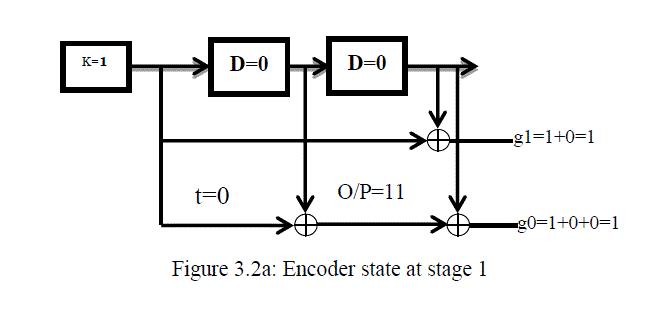 |
| At stage 1, t=0: encoder takes the first input bit k=1at first clock input (from the sequence of information bits, starting from the most significant bit) and Ex-OR it with the value found in the memory D2= 0 to get g1(D) = g(1)=1+0=1. At the same time, takes the same input bit k=1 and Ex-OR with the values found in the memory D=0, then uses the result and Ex-OR with the value found in memory D2=0 to get g0(D)= g(0)=1+0+0=1. The output code word would be 112 as shown in figure 3.2a. The encoder shifts k value into D and D value into D2. The new D=1 and D2=0. |
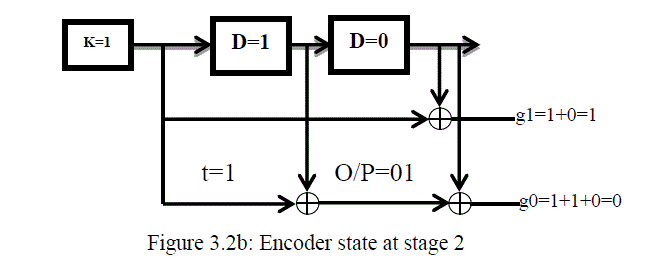 |
| At stage 2, t=1, encoder takes the second input bit k=1 at next clock input (from the sequence of information bits, starting from the most significant bit) and Ex-OR it with the value found in the memory D2= 0 to get g1(D) = g(1)=1+0=1. At the same time, takes the same input bit k=1 and Ex-OR with the values found in the memory D=1, then uses the result and Ex-OR with the value found in memory D2=0 to get g0(D)= g(0)=1+1+0=0. The output code word would be 012 as shown in figure 3.2b. The encoder shifts k value into D and D value into D2. The new D=1 and D2=1. |
 |
| At stage 3, t=2, encoder takes the second input bit k=1(from the sequence of information bits, starting from the most significant bit) and Ex-OR it with the value found in the memory D2= 1 to get g1(D) = g(1)=1+1=0. At the same time, takes the same input bit k=1 and Ex-OR with the values found in the memory D=1, then uses the result and Ex-OR with the value found in memory D2=1 to get g0(D)= g(0)=1+1+1=1 as shown in figure 3.2c. The output code word would be 102. The encoder shifts k value into D and D value into D2. The new D=1 and D2=1. |
| The process continues until stage 4 at t=3, stage 5 at t=4, stage 6 at t=5, and stage 7 at t=6 are done. After the sequence of bits has been encoded, the encoder needs to be flushed or reset to retain its 00 state. Stage 8 and stage 9 perform encoder reset process. The output code word would be 002. Thus the encoded output sequence for the 7-bits input sequence [1111010] is [11011010010010] plus flushing bits added as shown in table 3.1. This is done at the transmitter’s side before it would be sent to the channel. |
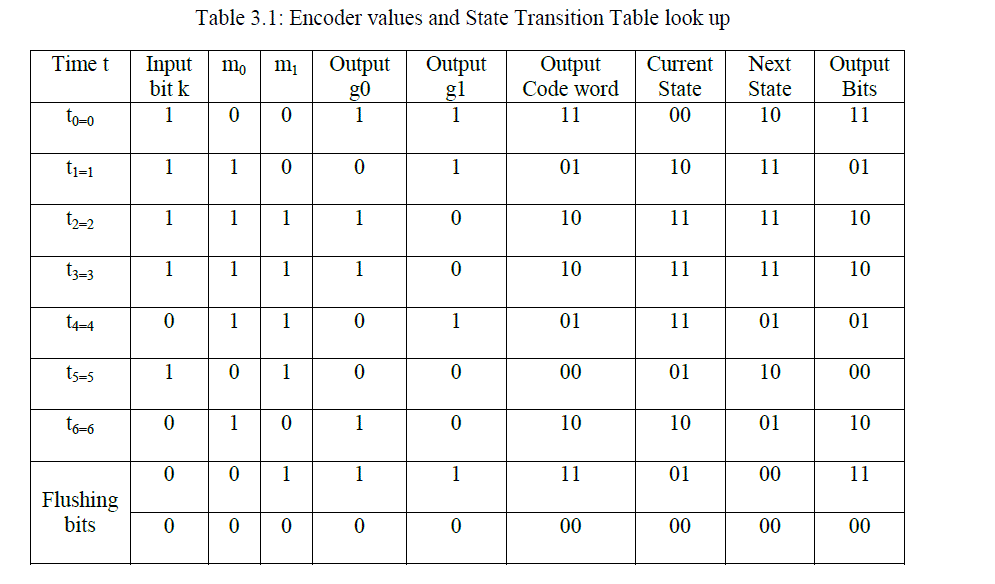 |
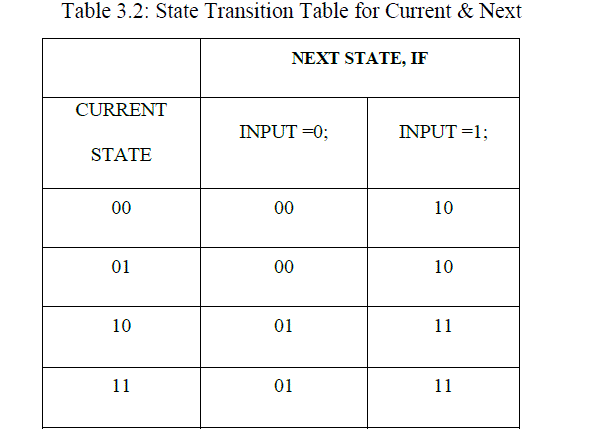
| The convolutional encoder uses look-up tables called state transition table to do the encoding which are shown in table 3.2. With this, the encoder knows the current and next states during operation |
 |
| 3.2 How Viterbi decoding is done |
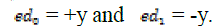
| Viterbi decoding uses trellis diagram to decode convolutional encoded data at the receiver’s end. It has the encoding knowledge of convolutional encoder and that enable it to perform its decoding. Two forms of Viterbi decoding are hard and soft decision Viterbi decoding. Hard decision Viterbi decoding also known as Soft Input Viterbi decoding technique (SIVD) uses a path metric called the hamming distance metric to determine the survivor path and the decoder output through the trellis. Soft decision Viterbi decoding calculates the distance between the received symbol and the probable transmitted symbol and determine its output. That is, if transmitted coded bit is 0, Euclidean distance is, |
 |
 |
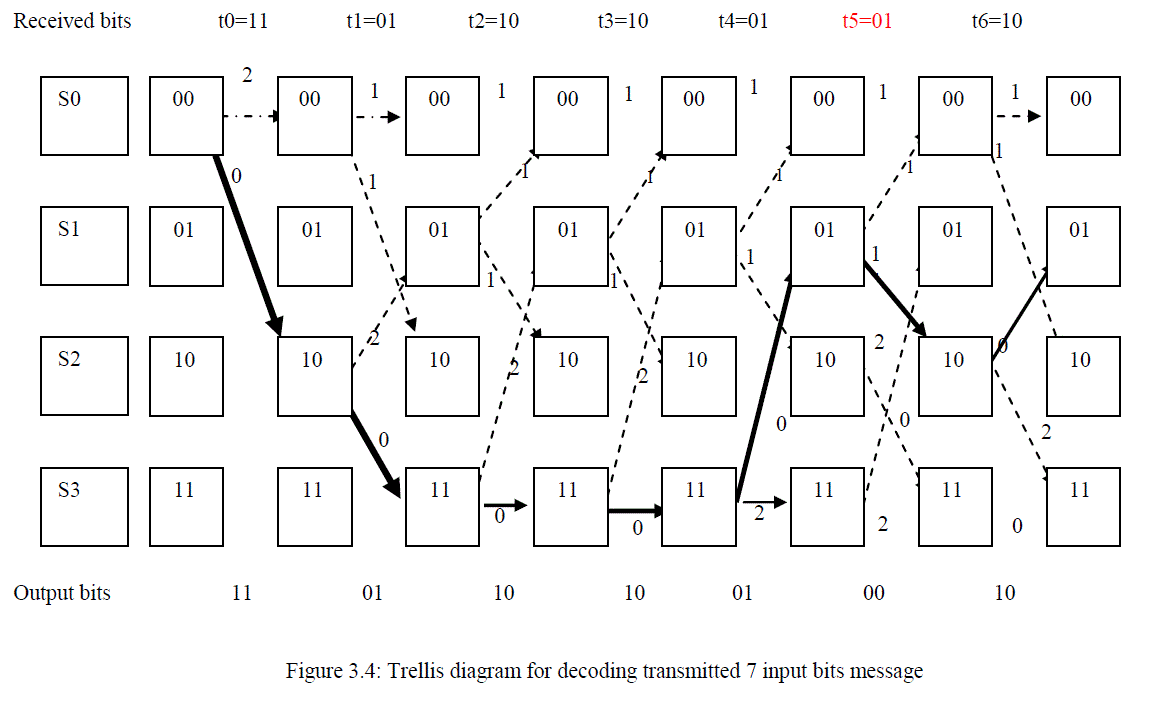
| Let’s assume that at the receiver, the bits were [11011010010110]. Error would be detected at t=5 as shown in the table 3.4. |
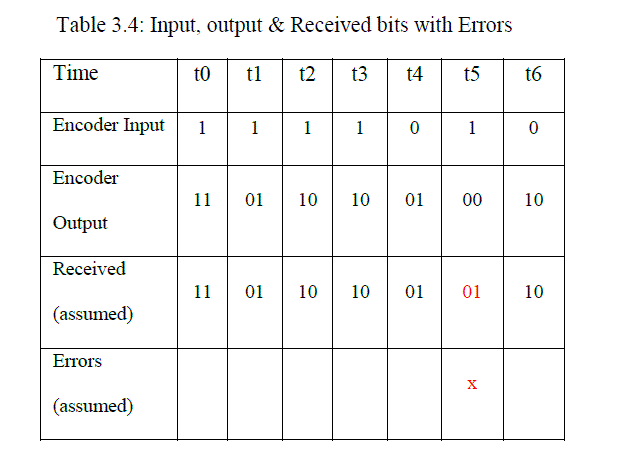 |
| The table 3.4 comprises of the encoder input, encoder output, and assumed received bits with error marked in red colour. The Trellis diagram drawn for the 7-bits input stream [1111010] is in figure 3.4 for each time tick based on the example considered. |
| From the trellis diagram in figure 3.4, S0 to S3 represents state of the encoder, the hamming distance of state 0 through state 3 are calculated thus: |
| At t0 |
| Moving from state 00 to state 00, the output = 00 and the received bits =11, the hamming distance = 2 Moving from state 00 to state 10, the output = 11 and the received bits =11, the hamming distance = 0. Therefore the shortest hamming distance is chosen and that is 0. At t0, HD=S2=0 |
| At t1 |
| Hamming distance S0= S0+S0 =2 +1 =3 |
| Hamming distance S1= S0-S2 +S2-S1= 0+2 =2 |
| Hamming distance S2= S0-S0 +S0-S2= 2+1 =3 |
| Hamming distance S3= S0-S2 +S2-S3= 0+0 =0 |
| At t1, HD=S3=0 |
| At t2 |
| Hamming distance S0=3+1=4 or 0+2+1=3; 3 (the highest is discarded while the least chosen) |
| Hamming distance S1= 2+1+0=3 or 0+0+2=2;2 |
| Hamming distance S2= 2+1+1=4 0r 0+2+1=3;3 |
| Hamming distance S3= 2+1+2=5 or 0+0+0=0;0 |
| At t2, HD=S3=0 |
| At t3 |
| Hamming distance S0=0+2+1+1=4 or 0+0+2+1=3;3 |
| Hamming distance S1= 0+2+1+0=3 or 0+0+0+2=2;2 |
| Hamming distance S2= 0+0+2+1=3 or 0+2+1+1=4;3 |
| Hamming distance S3= 0+2+1+2=5 or 0+0+0+0=0;0 |
| At t3, HD=S3=0 |
| At t4 |
| Hamming distance S0=0+0+2+1+1=4 or 0+0+0+2+1=3;3 |
| Hamming distance S1= 0+0+2+1+2=5 0r 0+0+0+0+0=0;0 |
| Hamming distance S2= 0+0+2+1+1=4 or 0+0+0+2+1=3;3 |
| Hamming distance S3= 0+0+2+1+0=3 or0+0+0+0+2=2;2 |
| At t4, HD=S1=0 |
| At t5 |
| Hamming distance S0=0+0+0+2+1+1=4 or 0+0+0+0+0+1=1;1 |
| Hamming distance S1= 0+0+0+0+2+0=2 or 0+0+0+2+1+2=5;2 |
| Hamming distance S2= 0+0+0+0+0+1=1 or 0+0+0+2+1+1=4;1 |
| Hamming distance S3= 0+0+0+2+1+0=3 or 0+0+0+0+2+2=4;3 |
| At t0, HD=S2=1 |
| At t6 |
| Hamming distance S0=0+0+0+0+0+1+1=2 or 0+0+0+0+2+0+1=3;2 |
| Hamming distance S1= 0+0+0+0+0+1+0=1 or 0+0+0+2+1+0+2=5;1 |
| Hamming distance S2= 0+0+0+0+2+0+1=3 or 0+0+0+0+0+1+1=2;2 |
| Hamming distance S3= 0+0+0+0+0+1+2=3 or 0+0+0+2+1+0+0=3;3 |
| At t0, HD=S1=1 |
| At this stage, the decoder would detect that error occurred at state 1 at time t=5. |
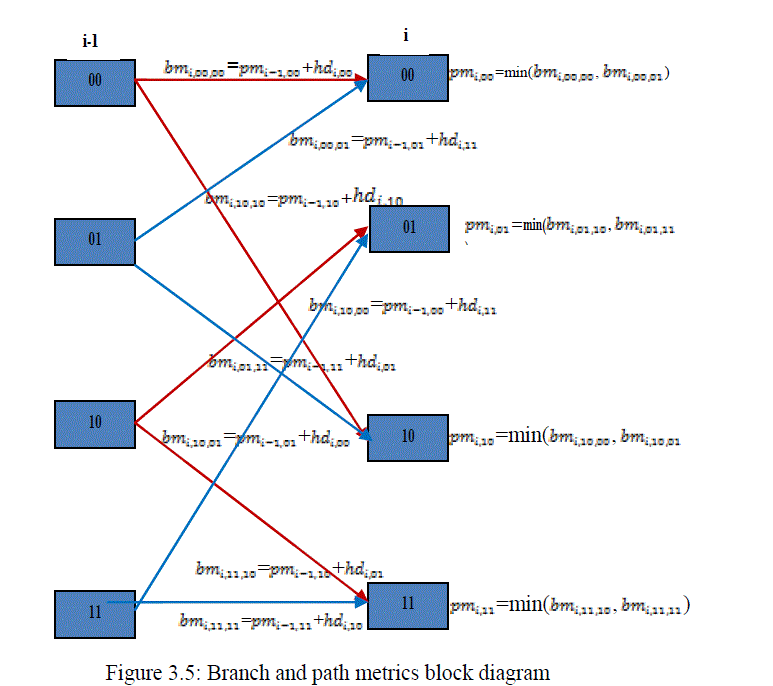 |
| 3.3 Branch and Path Metrics Computation |
| The path and branch metrics for all the states from 0 to 3 can be calculated as shown in equation 3.1 through equation 3.12. The movement from one state to another is clearly stated in indicated in figure 3.5. |
 |
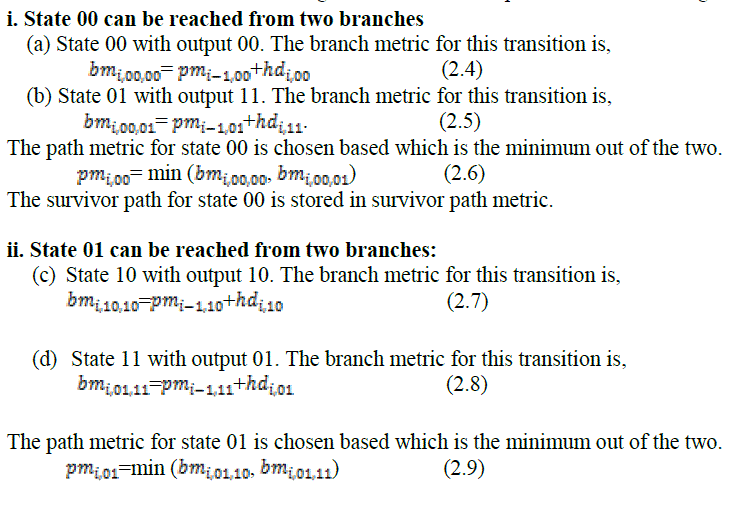
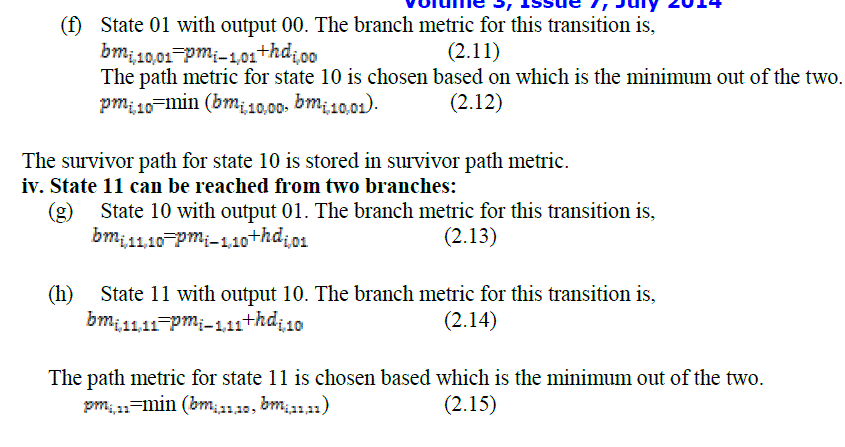
i. State 00 can be reached from two branches |
 |
 |
| The survivor path for state 11 is stored in survivor path metric. |
| 3.4 How does Viterbi detect error and correct them during decoding |
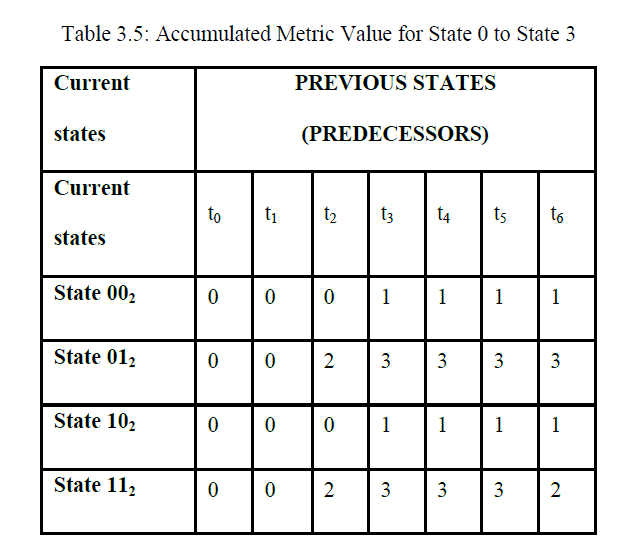
| Viterbi decoder always has knowledge of coding tactics used by the convolutional encoder before it can decode any information bits. The encoder detects error by comparing the output symbol from the received bits at the receiver’s side. When the bits symbol is the same, it detects no error but when they are not the same, it detects error. It corrects the error based on the coding information values stored and that makes it intelligent. The accumulated metrics for the full 7-bit message at each time t (plus two flushing bits) are listed in table 3.5. |
 |
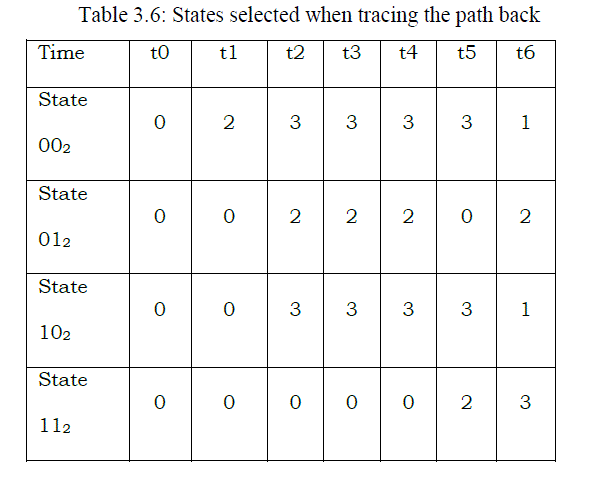 |
| 3.5. Traceback Unit |
 |
IV. RESULT AND DISCUSSION |
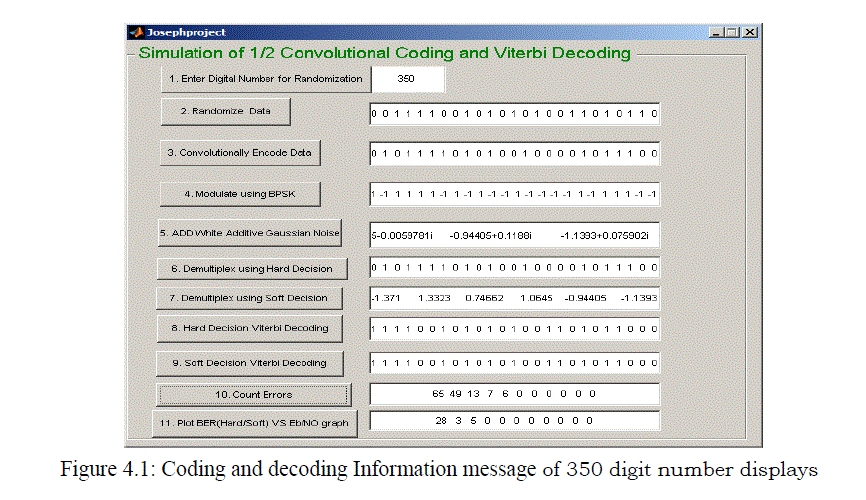
| The graphical user interface designed in MATLAB is as shown in figure 4.1. Simulation was run for ½ Convolutional codes with different input messages. Error performance analysis is checked by plotting bit error-rate versus energy per bit to noise power spectral density (Eb/No) for AWGN channel. Soft decision Viterbi decoding offers better performance results than hard decision Viterbi decoding. As the number of input message increases, Convolutional coding and decoding performs better. BER of 10-5 was taken for both hard and soft decision and the transmitting power for soft decision is 6dB while that of hard is 8dB. Also the coding gain of soft decision decoding is greater than hard decision decoding which proved that soft decision decoding is always at least 2dB better responses as to compare to hard decision decoding. Thus to achieve the same BER; the soft decision decoding will require a lower signal to noise ratio, that is, lower transmitter power compared to its counterpart. More explanations were done on each of the plotted graph. |
| Now using the simulation GUI interface, different digit numbers were entered but only 350 bits information is shown in figure 4.1. |
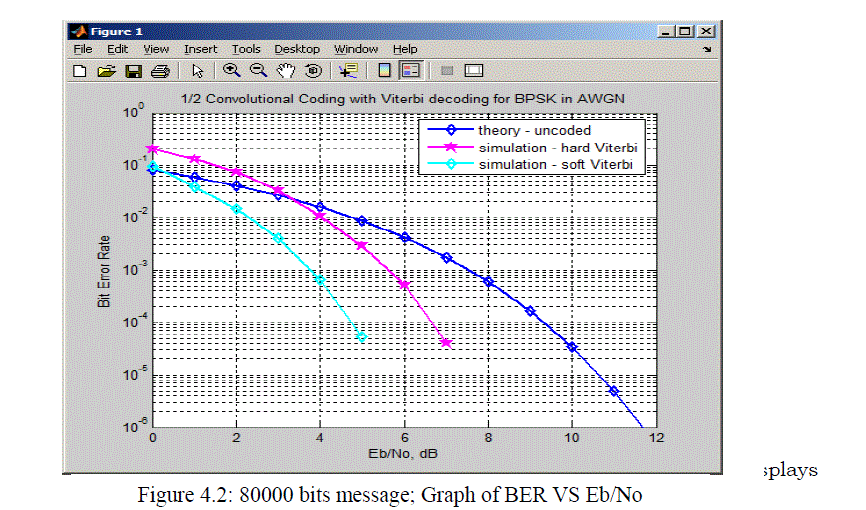 |
| The 80000 bits message was encoded and decoded in MATLAB and the graph of BER ranging from 100 to 10-6 versus Eb/No ranging from 0dB to 12dB plotted as shown in figure 4.2. |
 |
 |
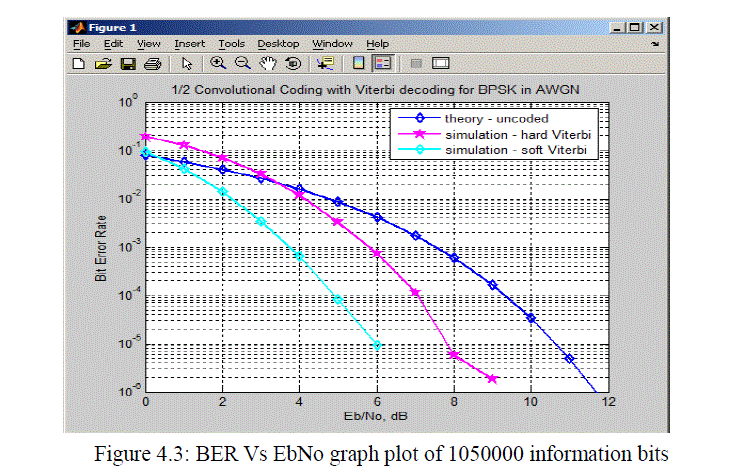
| From the graph shown in figure 4.3, it is seen that as the Eb/No is increased from 0 to 12dB, the BER of Soft Viterbi decoding (SDVD) decreases faster than Hard Viterbi decoding (HDVD) during decoding . This means that increase in Eb/No reduces the bit error rate of the signal thereby introduces less error in the transmission systems. Take a look at Eb/No equal to 9.5dB in figure 4.3, the coding gain of both of hard and soft Viterbi decoding can be calculated thus; Taking measurement at BER =10-5 |
| Coding gain for HDVD = SNRuncoded - SNRhdvd = 9.5dB – 6.8dB= 2.7dB |
| Coding gain for SDVD = SNRuncoded - SNRsdvd = 9.5dB – 4.8dB = 4.7dB |
| Therefore Coding gain of SDVD – Coding gain of HDVD = 4.7dB - 2.7dB = 2dB |
| Therefore, the soft Viterbi decoding performs better than the Hard Viterbi decoding in decoding convolutional coded bits. |
V. CONCLUSION |
| The objective of this paper work is to design and program MATLAB graphical User Interface for simulating ½ rate convolutional encoder with Viterbi decoder. The encoding process was demonstrated using a (2, 1, 3) convolutional encoder and decoding process demonstrated also using a hard decision Viterbi decoder and a soft decision Viterbi decoder. Different graphs of BER against Eb/No were plotted to check the number of errors that would be reduced within the transmitting powers ranging from 0dB to12dB. As was seen from the simulation graph results obtained in figure 4.2 and figure 4.3, the performance of convolutional coding with Viterbi decoding was greatly improved by the smaller code rate used. |