ISSN ONLINE(2319-8753)PRINT(2347-6710)
ISSN ONLINE(2319-8753)PRINT(2347-6710)
T.Suneel kumar, S.Nagamythi
|
| Related article at Pubmed, Scholar Google |
Visit for more related articles at International Journal of Innovative Research in Science, Engineering and Technology
This paper proposes a multiresolution AHB on-chip bus tracer named SYS-HMRBT (AHB multiresolution bus tracer) for versatile system-on-chip (SoC) debugging and monitoring. The bus tracer is with the provision of capturing the bus trace with different resolutions, efficient built-in compression mechanisms, to meet a diverse range of d e b u g g i n g a n a l y s i s needs. In addition, it allows users to switch the trace resolution dynamically so that appropriate resolution levels can be applied to different segments of the trace. On the other hand, SYS-HMRBT supports tracing after/before an event triggering, named post-triggering trace/pre-triggering trace, respectively. SYSHMRBT runs at 500 MHz and costs 42 K gates in TSMC 0.13 micro m technology, indicating that it is capable of real time tracing and is very small in modern SoCs. Experiments show that the bus tracer achieves very good compression ratios of 79%–96%, depending on the selected resolution mode. As a case study, it has been integrated into a 3-D graphics SoC to facilitate the debugging and monitoring of the system behaviors. The SoC has been successfully verified both in field-programmable gate array and a test chip.
Keywords |
| AMBA, AHB Bus Tracer, Real Time Compression and Dynamic Multiresolution |
INTRODUCTION |
| On Chip bus is an important system-on-chip (SoC) infrastructure that connecting major hardware components. Monitoring the on-chip bus signals is crucial to the SoC debugging and performance analysis/optimization. Unfortunately, such signals are difficult to observe since they are deeply embedded in a SoC and there are often no sufficient I/O pins to access these signals. Therefore, a straightforward approach is to embed a bus tracer in SoC to capture the bus signal trace and store the trace in an on chip storage such as the trace memory which could then be off loaded to outside world (the trace analyzer software) for analysis. Unfortunately, the size of the bus trace grows rapidly. For example, to capture AMBA AHB bus signals running at 200 MHz, the trace grows at 2 to 3 GB/s. Therefore, it is highly desirable to compress the trace on the fly in order to reduce the trace size. However, simply capturing/compressing bus signals is not sufficient for SoC debugging. Since the de- bugging/analysis needs are versatile: some designers need all signals at cycle-level, while some others only care about the transactions. For the latter case, tracing all signals at cycle level wastes a lot of trace memory. Thus, there must be a way to capture traces at different abstraction levels based on the specific debugging/analysis need. As we cannot increase the on chip memory at this rate so we will compress the trace accordingly without any loss of trace as that when reconstructed at the analyser the trace remains the same. And along with this different abstraction levels are adopted depending on the designers needs some require all signals at cycle level, while others require only transactions. Thus, there must be a way for capturing traces at different abstraction levels based on the debugging and analysis needs. If the given Trace memory is fixed then the user can trade off between the trace granularities and trace length. This feature provides a more flexible tracing. |
RELATED WORK |
| The lossy trace compression approach achieves high compression ratio by sacrificing the accuracy. The lossless compression approaches are more appropriate for real time on chip bus tracing. Existing on chip bus tracers mostly adopt lossless compression approaches. ARM provides the AMBA AHB trace macro cell (HTM) that is capable of tracing AHB bus signals, including the instruction address, data address, and control signals. The instruction address and control signals are compressed with a slice compression approach (to be explained shortly). On the other hand, the data address is recorded by simply removing the leading zeros. The HTM supports a limited level of trace abstraction by removing bus signals that are in IDLE or BUSY state. The AMBA navigator traces all AHB bus signals without compression. In the bus transfer mode, it also has a limited level of trace abstraction by removing bus signals which are in IDLE, BUSY, or non ready state. The AHBTRACE in GRLIB IP library captures the AMBA AHB signals in the uncompressed form. In addition, it does not have trace abstraction ability. |
| There are many research works related to the bus signal compression. We characterize the bus signals into three categories: program address, data address/data and control signals. We then review appropriate compression techniques for each category. For program addresses, since they are mostly sequential, a straightforward way is to discard the continuous instruction addresses and retain only the discontinuous ones, so called branch/ target filtering. This approach has been used in some commercial tracers, such as the TC1775 trace module in Tri Core and ARM’s Embedded Trace Macro cell (ETM). The hard ware overhead of these works is usually small since the filtering mechanism is simple to be implemented in hardware. The effectiveness of these techniques, however, is mainly limited by the average basic block size, which is roughly around four or five instructions per basic block. Other technique such as the slice compression approach targets at the spatial locality of the program address. This approach partitions a binary data into several slices and then records all the slices of the first data and then only part of the slices of the succeeding data that are different from the corresponding slices of the previous one (usually the lower bit positions of the data). For data address/value, the most popular method is the differential approach which records the difference between consecutive data. Since the difference usually could be represented with less number of bits than the original value, the information size is reduced. Hopkins and Mc- Donald Maier showed that the differential method can reduce the data address and the data value by about 40% and 14%, respectively. For control signals, ARM HTM encodes them with the slice compression approach: the control signal is recorded only when the value changes. As mentioned, compressing all signals at the cycle-accurate level does not always meet the debugging needs. As SoCs become more complex, the transaction level debugging becomes increasingly important, since it helps designers focus on the functional behaviors, instead of interpreting complex signals. Tabbara and Hashmi propose the transaction level SoC modeling and debugging method. The proposed transactors, attaching to the on chip bus, recognize/monitor signals and abstract the signals into transactions. The transactions, bridging the gap between algorithm level and the signal level, enable easy design exploration/ debugging/monitoring. |
OVERVIEW |
| This section presents the architecture of our bus tracer. We first provide an overview of the architecture for the post-T trace. We then discuss the three major compression methods in this architecture. |
A. Post-T Tracer Architecture Overview |
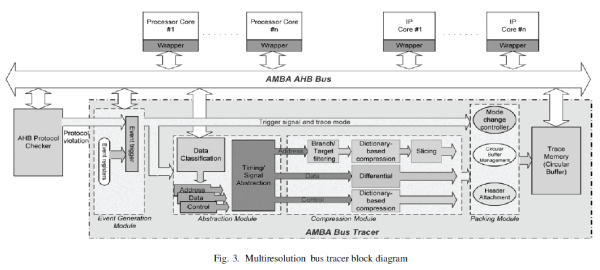
| Fig.3 is the bus tracer overview. It mainly contains four parts: Event Generation Module, Abstraction Module, Compression Modules, and Packing Module. The Event Generation Module controls the start/stop time, the trace mode, and the trace depth of traces. This information is sent to the following modules. Based on the trace mode, the Abstraction Module abstracts the signals in both timing dimension and signal dimension. The abstracted data are further compressed by the Compression Module to reduce the data size. Finally, the compressed results are packed with proper headers and written to the trace memory by the Packing Module. |
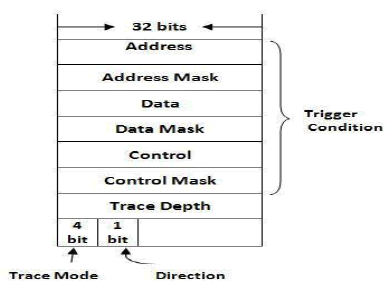
| 1) Event Generation Module: The Event Generation Module decides the starting and stopping of a trace and its trace mode. The module has configurable event registers which specify the triggering events on the bus and a corresponding matching circuit to compare the bus activity with the events specified in the event registers, this module can also accept events from external modules. For example, we can connect an AHB bus protocol checker (HP Checker) to the Event Generation Module, as to capture the bus protocol related trace . Fig. 4 is the format of an event register. It contains four parameters: the trigger conditions, the trace mode, the trace direction, and the trace depth. The trigger conditions can be any combination of the address value, the data value, and the control signal values. Each of the value has a mask field for enabling partial match. For each trigger condition, designers can assign a desired trace mode, e.g., |
 |
| Fig. 4. Event Register |
| Mode FC, Mode FT, etc., which allows the trace mode to be dynamically switched between events. The trace direction determines the pre-T/post-T trace. The trace depth field specifies the length of trace to be captured. |
| 2) Abstraction Module: The Abstraction Module monitors the AMBA bus and selects/filters signals based on the abstraction mode. The bus signals are classified into four groups as mentioned in Table 1. |
 |
| Depending on the abstraction mode, some signals are ignored, and some signals are reduced to states. Finally, the results are forwarded to the Compression Module. |
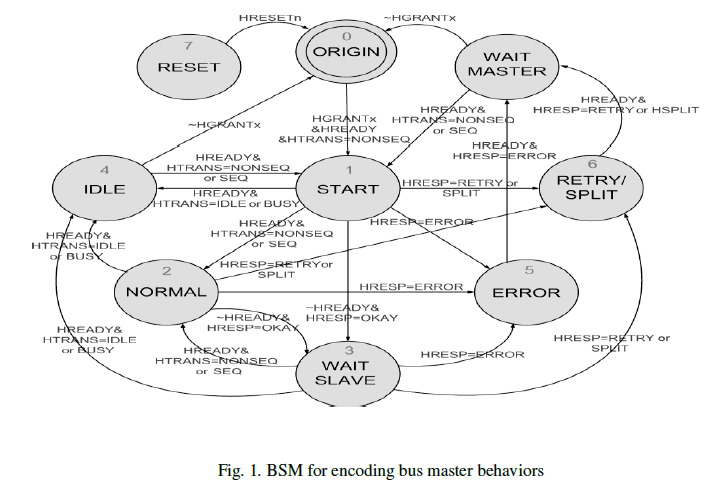 |
| The BSM is designed based on the AMBA AHB 2.0 protocol to represent the key bus handshaking activities within a transaction. The transitions between BSM states follow the AMBA protocol control signals. For example, in the beginning (state0), if the master is granted the bus (HGRANT = true), it enters start state (state 1). After, the master begins to transfer by first acknowledging the transfer type, which is a sequential transfer(HTRANS = SEQ) or a non sequential transfer (HTRANS =NONSEQ). If it is a successful transfer, the BSM goes to the normal state (state 2). After it is in state 2, if the slave is busy, the BSM enters to the wait states (HREADY = false and HRESP is OK). Later on, if the slave can finish the transfer, the BSM changes from state 3 to state 4. (HREADY = true and HRESP indicates OK). |
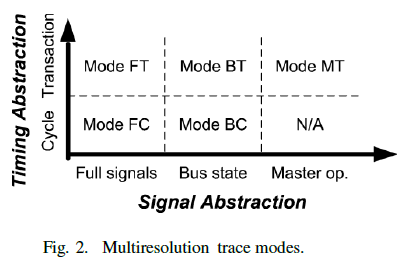 |
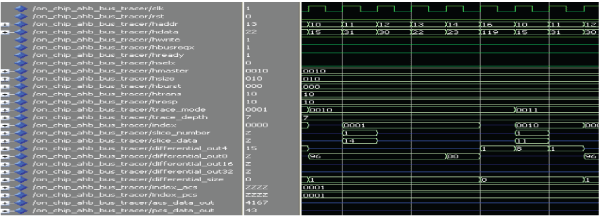
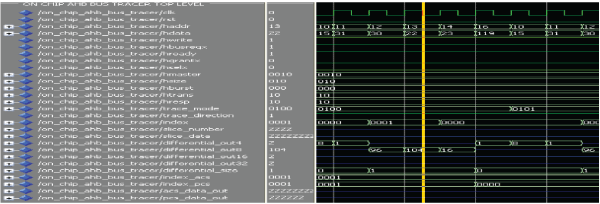
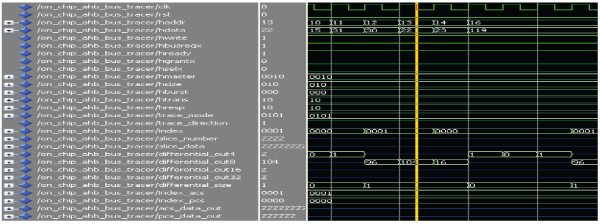
| The different modes for tracing are Full cycle, Full transaction, Bus cycle, Bus transaction, Master transaction. At Mode FC, the tracer traces all bus signals cycle by cycle so that designers can observe the most detailed bus activities. This mode is very useful to diagnose the cause of error by looking at the detail signals. At Mode FT, the tracer traces all signals only when their values are change. when designers want to skim the behaviors of all signals instead of looking at them cycle by cycle. Another benefit of this mode is that the space can be saved without losing meaningful information. Thus, the trace depth increases At Mode BC, the tracer uses the BSM, such as NORMAL, IDLE, ERROR, and so on, to represent bus transfer activities in cycle accurate level. At Mode BT, the tracer uses bus state to represent bus transfer activities in transaction level. The traced data is abstracted in both timing level and signal level; it is a combination of Mode BC and Mode BT. At Mode MT, the tracer only records the master behaviors, such as read, write, or burst transfer. It is the highest abstraction level. This feature is very suitable for analyzing the masters’ transactions. 3) Compression Module: The purpose of the Compression Module is to reduce the trace size. It accepts the signals from the abstraction module. To achieve real time compression, the Compression Module is pipelined to increase the performance. Every signal type has an appropriate compression method. The program address is compressed by a combination of the branch/target filtering, the dictionary based compression, and the slicing. The data address and the data value are compressed by a combination of the differential and encoding methods. The ACS and PCS signals are compressed by the dictionary based compression. |
| 4) Packing Module: It is the last phase. It receives the compressed data from the compression module, processes them, and writes them to the trace memory. It is responsible for three jobs: packet management, circular buffer management, and mode change control. For packet management, since the compressed data length and type are variable, every compressed data needs a header for interpretation. There- fore, this step generates a proper header and attaches it to each compressed datum. In this paper, we call a compressed data with a header as a packet. Since the header generation takes time, to avoid long cycle time, the header generation is implemented in one pipeline stage. For circular buffer management, it man ages the accesses to the trace memory. Since the size of a packet is variable but the data width of the trace memory is fixed, this module collects the trace data in a first input, first output (FIFO) buffer and outputs them to the trace memory until the data size in the FIFO buffer is equal/larger than the data width. |
 |
| B. Compression Mechanism |
| Although the Abstraction Module can reduce the trace size, the remaining trace volume is still very large. To reduce the size, the data compression approaches are necessary. Since the signal characteristics of the address value, the data value, and the control signals are quite different, we propose different compression approaches for them. |
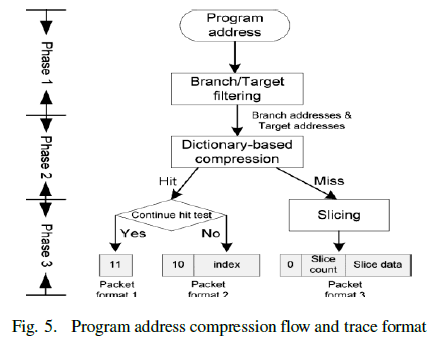
| 1) Program Address Compression: We divide the program address compression into three phases for the spatial locality and the temporal locality. Fig. 5 shows the compression flow. There are three approaches: branch/target filter, dictionary based compression, and slicing. |
 |
 |
| 2) Branch/Target Filtering: This technique aims at the spatial locality of the program address. Spatial locality exists since the program addresses are sequential mostly. Software programs (in assembly level) are composed by a number of basic blocks and the instructions in each basic block are sequential. Because of these characteristics, Branch/target filtering can records only the first instruction’s address (Target) and the last instruction’s address (Branch) of a basic block. The rest of the instructions are filtered since they are sequential and predictable. |
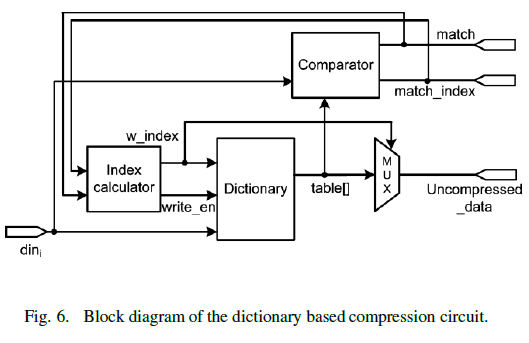
| 3) Dictionary Based Compression: To further reduce the size, we take the advantage of the temporal locality. Temporal locality exists since the basic blocks repeat frequently, which implies the branch and target addresses after Phase 1 repeat frequently. The idea is to map the data to a table keeping frequently appeared data, and record the table index instead of the data to reduce size. Fig.6 shows the hardware architecture. The dictionary keeps the frequently appeared branch/target addresses. To keep the hardware cost reasonable, the proposed dictionary is implemented with a CAM based FIFO. When it is full, the new address will replace the address at the first entry of FIFO. For each input datum (dini) the comparator compares the datum with the data in the dictionary (table[]) If the datum is not in the table (Miss) the datum is written into the table and also recorded in a trace. Otherwise (Hit) the index of the hit table entry is recorded instead of the datum. The hit index can be further compressed. As we know, a basic block is composed by a target address and a branch address, and the branch instruction address appears right after target instruction address. By the fact that basic blocks repeat frequently, if the target address is hit at the table entry i, the branch address will hit at the table entry (i+1) since these entries are stored in the dictionary in a FIFO way. |
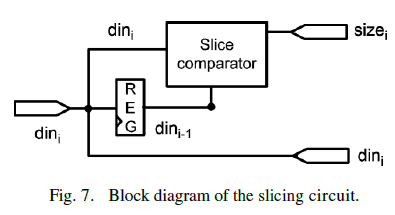
| 4)Slicing: The miss address can also be compressed with the Slicing approach. Because of the spatial locality, the basic blocks are often near each other, which mean the high order bits of branch/target addresses nearly have no change. Therefore, the concept of the Slicing is to reduce the data size by recording only the different digits of two consecutive miss addresses. Fig. 7 shows the hardware architecture. It has the register REG storing the previous data (dini-1 ). The slice comparator compares the slices of the current datum (dini) and the previous datum and produces the identical slice number (sizei). This information is forwarded to the packing module to generate the proper header. This is the packet format 3 . |
 |
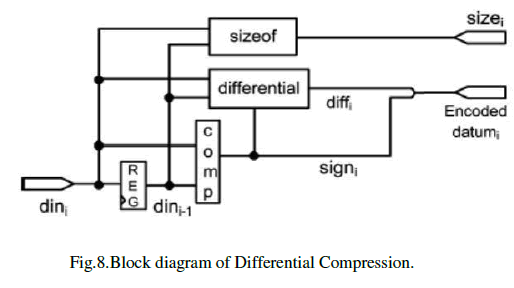
| 2) Data Bus Trace Compression: Since the signal variations on the data bus are not regular that compared with program address bus. Using the differential approach based on subtraction is the convenience way to reduce the data bus trace size and the hardware cost of subtraction is small but the compression ratio is low (about 20%-30%). Fig.8 shows hardware compressor. The register REG saves the current datum dini and outputs the previous datum dini-1 .By comparing the current datum with the previous data value, the three modules comp, differential, and sizeof output theencoded results. The comp module computes the sign bit (signed_bit) of the difference value. The differential module calculates the absolute difference value (value). Since the absolute difference between two data value may be small, we can neglect the leading zeros and use fewer digits to record it. Therefore, the sizeof module calculates the nonzero digit number (sizei) of the difference. Finally, the encoded datum is sent to the packing module along with sizei. |
 |
| 3) Control Signal Trace Compression: When a bus master is performing a bus transfer, the control signals, such as read/write, width of the transfer, transfer size, etc. don’t change their value during a complete bus transfer. we can use few bits to encode the combinations of these control signals, and record the encoded value instead of record all control signals value. For example, in an AMBA platform, the control signals, e.g. HWRITE, HBURST [2:0], HSIZE[2:0], HPROT[3:0], and HMASTER[3:0] don’t change their value during a bus transfer. Therefore the original trace size of these control signals isn15bits. If we use 3bits to encode the combination of these control signals, we can reduce trace size by about (1 - 3/15) x 100% =80%. In an AMBA system, the combinations of control signals are more than 8 (23), the control signals trace compression module provides a CAM based dictionary table. The concept is similar to compress the address bus (phase 2). If the current combination of control signals is appeared in the table, the index value (3- bit) would be recorded. On the other hand, we will record the 15-bits control signals when the table miss occurred. |
D. Packing Module |
| The Packing Module is the last phase. It receives the compressed data from the compression module, processes them, and writes them to the trace memory. It is responsible for three jobs: packet management, circular buffer management, and mode change control. For packet management, since the compressed data length and type are variable, every compressed data needs a header for interpretation. Therefore, this step generates a proper header and attaches it to each compressed datum. In this paper, we call a compressed data with a header as a packet. Since the header generation takes time, to avoid long cycle time, the header generation is implemented in one pipeline stage. For circular buffer management, it manages the accesses to the trace memory. Since the size of a packet is variable but the data width of the trace memory is fixed, this module collects the trace data in a first-input, first-output (FIFO) buffer and outputs them to the trace memory until the data size in the FIFO buffer is equal/larger than the data width. If the tracing stops and the data size in the FIFO buffer is smaller than the data width, one additional cycle is required to output the remaining data to the trace memory. |
EXPERIMENTAL RESULTS |
| Simulation and synthesis results of the implemented On-Chip AHB Bus Tracer with Real-Time Compression and Multi-resolution. Here Modelsim tool is used in order to simulate the design and checks the functionality of the design. Once the functional verification is done, the design will be taken to the Xilinx tool for Synthesis process and the netlist generation. |
Simulation Results |
1.MODE FC: |
 |
| 2. MODE FT: |
 |
| 3. MODE BC: |
 |
| 4. MODE BT: |
 |
| 5. MODE MT: |
 |
CONCLUSION |
| The Real-time Compression and Dynamic Multi-Resolution AHB bus tracer in SoC was designed successfully and the coding was done in VHDL. The RTL simulations were performed using Modelsim from Mentor Graphics. The synthesis was done using Xilinx ISE. It works at a frequency of 198.515MHz. The Designed Tracer works properly for all the Modes such as Mode FC, Mode FT, Mode BC, Mode BT, Mode MT . Tracer design is verified for all test cases. The specification of the implemented bus tracer has been implemented, RTL, FPGA,. The bus tracer costs only about 2144 slice registers which uses 2144 flip-flops , which is relatively small in a typical SoC. The reason is that this paper optimizes the ping-pong architecture by sharing most of the data path instead of duplicating all the hardware components. |
References |
|