ISSN ONLINE(2319-8753)PRINT(2347-6710)
ISSN ONLINE(2319-8753)PRINT(2347-6710)
Prathapanayaka.R1, Vinod Kumar.N2, Santhosh Kumar.S3, Krishnamurthy.S.J.4, Narendra Sharma5
|
| Related article at Pubmed, Scholar Google |
Visit for more related articles at International Journal of Innovative Research in Science, Engineering and Technology
Propulsive efficiencies of Micro Air Vehicle propellers over operating range is playing very important role in enhancing the endurance of the MAVs. These propellers are powered by brushless mini motors whose efficiencies are low in comparison to bigger size motors and are varying over a range of operation. Generally propulsive efficiencies are evaluated by measuring the input power of drive motor and its efficiencies from commercial catalogue. Uncertainty in propulsive efficiency estimation results from the uncertainty in motor efficiencies which vary with load, speed; local heating of the miniature motors, and also compounded by uncertainty in low velocity air flow measurements. To alleviate this, novel method of simultaneous measurement of propellers shaft torque, thrust and rotational speed is configured by CSIR-NAL and procured from M/s MAGTROL SA, Switzerland along with the computer controlled data acquisition system. Wind tunnel testing in uninstalled condition, measurement techniques and data analysis method adapted has yielded realistic assessment of propulsive efficiencies of mini propellers used in micro air vehicles. Maximum propulsive efficiencies of 70% are measured at advance ratio of 0.65 in comparison to 58% from earlier method for 6inch 3bladed mini propeller and computed values of 3D steady state CFD analysis using ANSYS FLUENT are closer to measured values.
Keywords |
| Propeller aerodynamics, Propeller testing, Wind tunnel, Fixed wing MAVs. |
INTRODUCTION |
| Fixed wing MAV’s are powered by brushless DC motors and mini propellers. The performance of propellers of MAV’s in particular propulsive efficiency is playing very important role in enhancing the endurance of the MAV’s. Many researchers have contributed immensely to increase the propulsive efficiencies of propellers by studying airfoil [1,2], twist and chord distribution along the span [3], improvement in hub and tip geometry to reduce aerodynamic losses [3], materials [4,5], application to type of MAVs and flight envelopes. Propellers are powered by small internal combustion engines or small electric motors. In the present case, the propellers are powered by brushless mini motors whose efficiencies are low in comparison to bigger size motors and are varying over a range of operation. However not many information’s available in literature on effect of small electric motor efficiencies on propulsive efficiencies of propellers in a systematic study. Due to complexities and cost involved in simultaneous measurement of propeller shaft torque, thrust, rotational speed and input power; generally propulsive efficiencies are evaluated by measuring the thrust, input power of drive motor and its efficiencies from commercial catalogue at different advance ratios. Uncertainty in propulsive efficiency estimation resulted from the uncertainty in motor efficiencies which vary with load, speed; local heating of the miniature motors, and also compounded by uncertainty in low velocity air flow measurements. To alleviate this, CSIR-NAL has designed novel test rig to measure the propellers shaft torque, thrust, motor input power and rotational speed simultaneously and procured from M/s MAGTROL SA, Switzerland along with the computer controlled data acquisition system. Using this improved test rig; wind tunnel testing of mini propellers in uninstalled condition, yielded realistic assessment of propulsive efficiencies of mini propellers used in micro air vehicles. |
 |
II. METHODOLOGY |
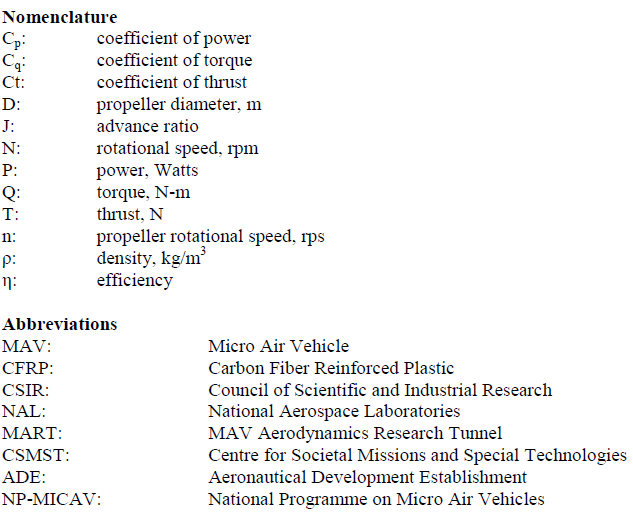
| Two different approaches are followed in evaluating the efficiencies of the propellers. First, in general, (Test bench 1), the motor efficiencies are taken from the catalogue corresponding to measured voltage, current and speed of the motor independently. The propulsive efficiencies are evaluated from the motor torque derived from measured power. Thrust is measured using beam type load cell. Second, the propulsive efficiencies are evaluated (Test bench 2) using direct measurement of propeller shaft torque and thrust from combined torque-force sensor and, rotational speed through optical pick up simultaneously. This is to minimize the uncertainty in measurement of propulsive efficiencies of mini propellers. Non-dimensional parameters such as coefficient of thrust, torque and power are calculated from the measured values [5], |
 |
III. PROCEDURE |
| CSIR-NAL has been developing mini propellers for MAV’s. In the present study a three bladed, 6” diameter, 5” pitch propeller designed [6,7 and 8] by CSIR-NAL is considered to compare the testing methodologies developed using two different test benches namely Test bench 1 and Test bench 2. In test bench 1 there is no provision to measure shaft torque directly and also simultaneous measurement of thrust and speed. This led to uncertainties in evaluating propulsive efficiencies of the propellers. To overcome this difficulty, CSIR-NAL has configured test bench 2 with a novel method of direct measuring propeller shaft torque, thrust and rotational speed simultaneously. Test bench 2 has a combined reaction type (in terms of twist angle measurement) torque-force sensor which would measure the shaft torque and thrust simultaneously. Optical sensor measure the shaft speed. Data acquired and analyzed are more realistic and closer to real time measurement. Test bench 2 is built and procured from M/s MAGTROL SA, Switzerland. Both the test benches were used in MAV Aerodynamic Research Tunnel (MART) of CSIR-NAL and tested for various operating range of MAV propellers. |
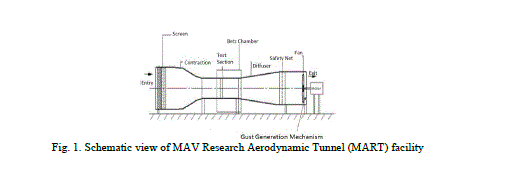
| MAV Research Aerodynamic Tunnel (MART): The propellers are tested using Test bench 1 and Test bench 2 in MART. The schematic view of MART is shown in Fig. 1. MART is a suction type open circuit wind tunnel with 0.8m x 1.2m test section. It can be operated both closed jet mode as well as open jet mode wind tunnel with maximum wind velocity of 45 m/s in closed jet mode and 25 m/s in open jet mode. The mean flow velocity variation is less than 0.1% and flow angularity of less than 0.1 degree. The turbulence intensity of the tunnel is less than 0.08% [9]. |
 |
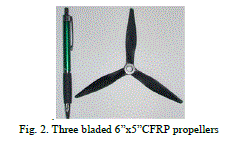
| Propeller: Fig. 2 shows three bladed, 6 inch diameter, 5 inch fixed pitch, CFRP mini propellers was designed using Eppler-193 airfoil and fabricated using precision molding process to generate 60 grams of thrust (cruise) at rotational speed of around 8000 rpm at CSIR-NAL[6, 8]. Given the thin section of the propeller blade profile and geometry, machining of the blade using metal or any other material is impractical. Rapid Prototype (RPT) fabrication using poly carbonate, poly urethane or ABS material has failed to meet the desired structural integrity, surface finish and accuracy. In view of this, effort is being made to fabricate the mini propeller using the metal mould with CFRP material through injection moulding process under controlled environment to contain the blowholes. CFRP propellers fabricated using this method gave satisfactory geometric accuracy, surface finish, structural integrity and aerodynamic performance [10]. The propeller weight is 6.0 grams. The detailed work carried out on design and development of this propeller is reported in references 6, 7, 8 and 10. Static balancing of the propeller is performed using magnetic balancer [11] in order to protect the combined torque force sensor from the imbalance loads and to minimize vibrations. |
 |
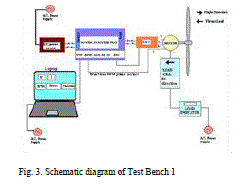
| Test Bench 1 Experimental procedure: Fig.3 shows schematic diagram of the propeller test bench 1 with electrical and electronic circuits [12]. It consists of a Aplab DC power source with 0 – 32V, 20 Amps, computer, beam type load cell of 600 gram capacity, load indicator, electronic speed controller (ESC) 5 amps, Medusa Power Analyzer Pro DAQ system, brushless DC (BLDC) motor and propeller. The propeller is run by a BLDC motor and the parameters such as voltage, current, speed and thrust are measured. The speed of the motor is controlled by the ESC which is powered by DC power source. Medusa Power Analyzer PRODAQ system (Make: Medusa Research Inc) along with Power PRO view software will provide the interface between PC and hardware. Command to the ESC, to control the speed of the motor is provided by varying the throttle position in the computer. Voltage and current to the motor, throttle position in turn rotational speed of the propeller are acquired and displayed on the computer through USB port connectors. Speed of the motor measured based on the number of poles in the motor. However the thrust produced is measured by beam type load cell and is displayed in load indicator. |
 |
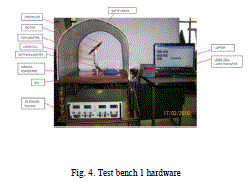 |
| Fig. 4 shows the hardware of the test bench 1. The parts are named in the picture. The safety mesh is used for static testing outside the wind tunnel, will be removed while testing in wind tunnel. |
 |
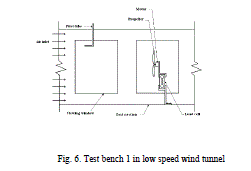 |
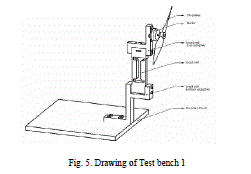
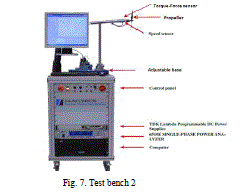
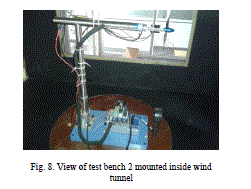
| Fig. 5 shows miniature motor and propeller assembly mounted on the load cell adapter. The load cell assembly was rigidly fixed to table for static tests. The same test setup was fixed to low speed wind tunnel test section base plate for conducting wind tunnel tests as shown in Fig. 6. Test Bench 2 Experimental procedure: In the test bench 2, the propeller test setup is capable of measuring thrust, torque, rotational speed simultaneously and acquires data close to real time frame of reference. The propeller test stand can be placed inside the MART tunnel and the tunnel can be operated as open jet tunnel with inbuilt Betz chamber. This would results in accurate measurement of propulsive efficiencies of the mini propellers at uninstalled conditions. The test bench 2 is shown in Fig. 7 consists of combined torque-force sensor mounted coaxially to motor shaft which measures the torque and thrust simultaneously [13]. The torque-force sensor is of reaction type and maximum measuring range of torque is 0.5 N-m and thrust is 50 N with accuracy class 1, 0.2 % v.E (Excitation voltage).The propeller is driven by an out runner brushless motor. Propeller is rigidly fixed to the drive motor shaft with locknut and washers, this sub-assembly is fixed to the torque-force sensor and, to the overhang horizontal bar and then to the vertical bar of the test stand carefully. An electronic speed controller (ESC) is used to control the speed of the motor. An optical infrared speed sensor is mounted on the horizontal bar in parallel to the propeller axis and the sensor facing the propeller approximately 35mm away and parallel to the main axis as well as 5mm away from the propeller plane of rotation. The measured data are acquired by a NI DAQ system. The control panel unit consists of programmable DC power supply, single phase power analyzer, GPIB interface, computer, monitor, keyboard and its controls, to operate the test setup. During wind tunnel testing the adjustable base along with the DAQ cards and sensors is mounted inside the test section as shown in Fig. 8 and the cablings are routed out of the tunnel to the control panel unit. Test cycle for various propeller rotational speeds is defined by time steps and throttle percentage. Throttle control depends on the pulse width modulation of electronic speed controller (ESC). The specified ESC has a clock frequency of 32 kHz. The brushless motor is having 12 poles with 6 pairs of windings; the controllers are based on 54 Hz PWM where the offset and gain is 8.2 and 1.8 percentage of duty cycle. By changing the test cycle set limit, the speed of the propeller could be increased further. |
 |
 |
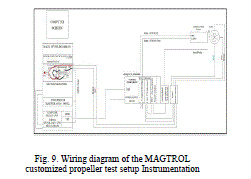
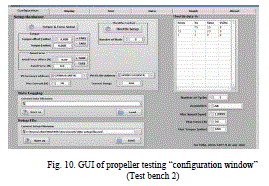
| Fig. 9 shows the schematic view of the instrumentation wiring diagram as well as external wiring diagram. Motor, RPM Sensor, ESC, torque-force sensors, DAQ system are connected to power source with appropriate interface cables as shown in Fig. 9. Switch on the power supply of the MAGTROL system and software is executed to operate the test setup. Fig. 10 shows the screen shot of “configuration window” tab. Enter the number of blades of propeller, test cycle in terms of time and throttle percentage, file name and location to save the test data. Threshold values for maximum speed, maximum force, maximum torque, and maximum current have to be entered for safety reason. There will be some residual values after each test and need to tare these values to set the rig values to zero. Select the “display” tab and enter current, axial force, torque, rpm to be displayed in graph during testing. Selecting the “test” tab to test the propeller for different rpm based on the defined test cycle. During testing, all the selected parameters such as axial force, torque, rpm, current, voltage will be acquired and displayed in graphical format. All the data acquired is further processed and plotted in standard format of propeller performance charts. |
 |
 |
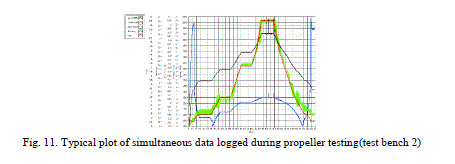
| Wind tunnel testing: Both the test benches are placed individually in the dedicated MART wind tunnel in uninstalled conditions. Tests are carried out at wind speed varying from 2m/s to 12m/s in steps of 2m/s and rotational speed varying from 2000 to 10000 rpm. These accounts for micro air vehicle take off (hand launch) and advance ratios range from 0.1 to 1.0. Cruise advance ratio of MAV is close to 0.595. Atmospheric pressure and temperature are recorded and data accounted for correction. Wind velocity is measured and monitored using calibrated Pitot-Static probe mounted in the test section. Fig. 11 shows the typical logged data obtained from the propeller test bench 2 for wind speed of 12m/s at MART wind tunnel. Other than steady state data, few noise signals appeared are from fluctuations in wind velocities and also could be from overall structural system. Initially five parameters, input voltage, rotational speed; propeller shaft torque, axial force and motor efficiency are selected for the data acquisition. Except motor efficiency all other parameters are direct measurement and acquired by the data acquisition system of the computer. The selection of test cycle is decided by the rotational speed and time step, in the present case, maximum speed of 9000rpm (black colour – Fig. 11) of 3 bladed propellers, and the time step works out to be 7seconds over the test cycle close to 45% of throttle. The rise portion of the speed signal (lag) and a flat portion covering 7 second is the time step duration where measured parameters are reflected. Once the test cycle is completed then all the parametric curves drops steeply. All the parametric curves like torque (red), axial force (green), motor efficiency (blue) follow the same trend except the voltage (magenta) which is constant. The data is acquired at the rate of 100 samples per second. Measured maximum torque is close to 27.5 mN-m, maximum axial force close to 1.5N and maximum motor efficiency is close to 68.09 percentages. Digital values of these parameters are averaged off-line, over a time step using MATLAB code and the data is used for plotting the standard propeller performance curves. |
 |
IV. RESULTS AND DISCUSSIONS |
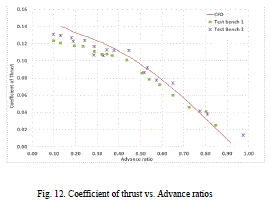
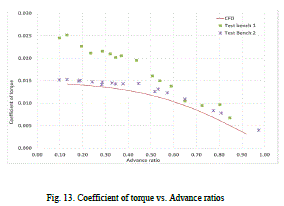
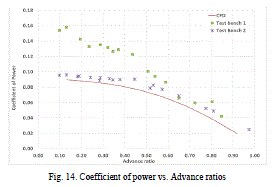
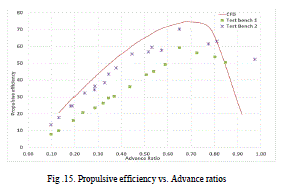
| In test bench 1, motor input voltage, input current, thrust and wind velocities are measured and acquired through data acquisition system. Propulsive efficiencies are evaluated using motor power, thrust at different advance ratios. The maximum motor efficiencies from catalogue are more than 75% for the current rating of 8A to 12A. In the present case, the motor draws a current in the range of 1.36A to 5.92A for the propellers speed range of 7255 rpm to 10250rpm covering the design speed of 8000rpm. In view of this, motor efficiencies are extrapolated for the propeller operating range and it varies from 63% to 71%, generating the thrust of 51.grams to 158.6 grams. In test bench 2, propellers shaft torque, power, thrust, rotational speed and wind velocities are acquired through computer controlled data acquisition system simultaneously is nearer to real time values. Propulsive efficiencies are evaluated using shaft torque, thrust, and rotational speed at different wind velocities. Figs. 12 to 15 shows the comparison of coefficients of thrust, torque, and power, propulsive efficiencies vs. advance ratios of test bench 1, test bench 2 and Steady state 3D CFD analysis results using ANSYS FLUENT. Green colour data points indicates the results of test bench 1, magenta colour data points indicates the results of test bench 2 and red colour continuous line indicate the computed values from 3D CFD. Fig. 12 shows the comparison of measured coefficient of thrust versus the advance ratios for both the test benches along with the computed values [6, 8]. It is observed that the measured thrust coefficient from test bench 2 is higher than the test bench 1, at all advance ratios. This could be due to uncertainty in measurement of air velocities at lower level and also could be compounded by the uncertainty in measurement of thrust by the beam type load cell in view of its resolution in test bench 1. Computed values of thrust coefficients are in fair agreement with the test bench 2 results. Fig. 13 shows the comparison of measured coefficient of torque versus advance ratios for both the test benches along with the computed values. Test bench 1 measures higher torque in comparison to test bench 2.The difference in measured torque is more predominant at lower advance ratios in comparison to higher advance ratios. In test bench 1, torque is not measured directly and is derived from the measured motor input power with extrapolated values of motor efficiencies. Since the uncertainty in the efficiencies of the motor input power, derived torque is not representing the true shaft torque of the propeller. Test bench 2 measures directly the propeller shaft torque and is more realistic. The measured coefficient of torque from test bench 2 is in close agreement with the computed values. |
 |
 |
| Fig. 14 shows the comparison of measured coefficient of power versus advance ratios of both test benches along with the computed values. Indicative power of the test bench 1 motor is higher than the test bench 2 motor, for the given torque and advance ratios, which is unrealistic. This directly reflects the uncertainties of the method adapted in the test bench 1. Fig. 15 shows the comparison of measured propulsive efficiencies versus the advance ratios of the two test benches. Measured efficiencies by the test bench 2 is always far higher than the test bench 1 at all advance ratios. Maximum propulsive efficiency measured from the test bench 2 is closer to 70%, whereas test bench 1 is closer to 59% at advance ratio of 0.65. Computed propulsive efficiency is higher than the measured values, however it is closer to test bench 2 results. |
 |
 |
V. CONCLUSIONS |
| The novel method and systematic study adapted by CSIR-NAL in evaluating the propulsive efficiencies of mini propellers by measuring the propellers shaft torque, thrust, rotational speed and wind tunnel air speed simultaneously using sophisticated measuring and data acquisition system procured from M/s MAGTROL, Switzerland have substantially improved accuracy of evaluation of propulsive efficiencies and are more realistic particularly for mini propellers. This in turn got evaluated the small brushless motor efficiencies also in the operating range. Without measuring the propellers input shaft torque could lead to unrealistic estimate of propulsive efficiencies. Computed values of 3D CFD steady state analysis using ANSYS – FLUENT, are closer to measured results from test bench 2. The technical effort in configuring the test bench 2 and prohibitive cost involved in development of the test rig is a herculean task and realizing this is an achievement. |
ACKNOWLEDGEMENTS |
| The authors wish to acknowledge NPMICAV-ADE for sponsoring this project. Authors also wish to acknowledge the support given by Director, CSIR-NAL, Head, Propulsion, MAV Division, Propulsion workshop and CSMST Division for completing this work. |
References |
|