ISSN ONLINE(2319-8753)PRINT(2347-6710)
ISSN ONLINE(2319-8753)PRINT(2347-6710)
A.Balakrishnan1, Dr.A.Ramu2 and A.Murugesan3
|
| Related article at Pubmed, Scholar Google |
Visit for more related articles at International Journal of Innovative Research in Science, Engineering and Technology
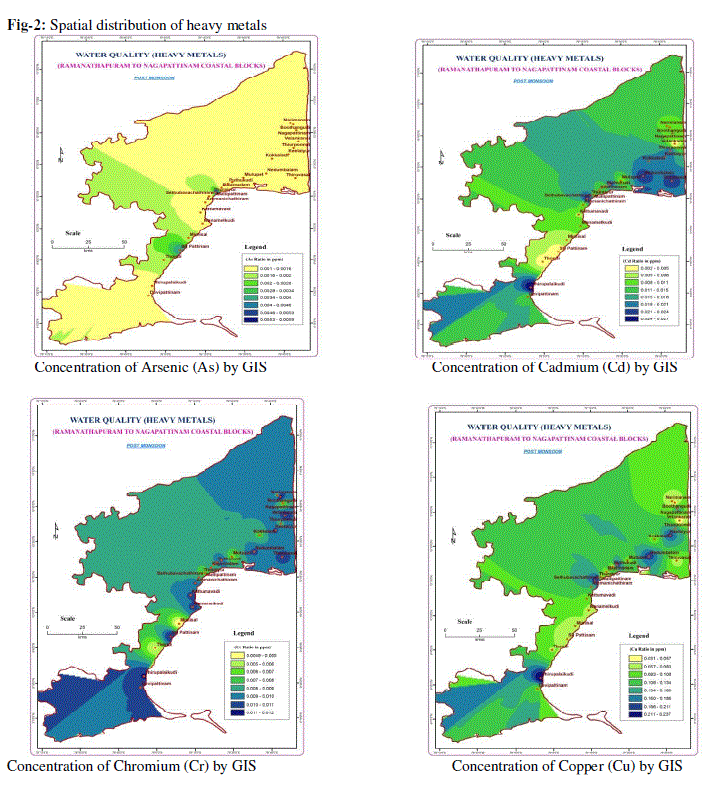
metal pollution is one of the common and important problem of water bodies and responsible for causing serious health effects to humans and animals. The aim of present study was to assess the heavy metal concentration in groundwater in Palk Strait sea shore area during the post –monsoon season. Heavy metals like Arsenic Heavy (As), Manganese (Mn), Zinc (Zn), Cadmium (Cd), Chromium (Cr), Copper (Cu), Mercury (Hg) and Lead (Pb) present in ground water were determined by Atomic absorption spectrometer. The concentrations of heavy metals were compared with drinking water standard prescribed by WHO, BIS, ICMR and FAO. The spatial distributions of heavy metal in ground water were taken to Geological Information System (GIS). In Arc GIS, spatial distribution maps were prepared for the above analyzed heavy metals.
Keywords |
| Ground water, Palk Strait, Heavy metal, Arc GIS. |
I. INTRODUCTION |
| Water is the most important substance in our daily life. Without it, life would not have been possible.[1] Several factors such as climate, characteristics of soil, circulation of ground water through rock types, topography of the area, intrusion of saline water in coastal areas, human activities on the ground etc. posses several effects on the quality of water[2]. One of the most hazardous trace metal found in drinking water is arsenic (As) being both toxic and carcinogenic[3]. GIS is an effective tool for storing large volumes of data that can be correlated spatially and retrieved for the spatial analysis. GIS has been used by scientists of various disciplines for spatial queries, analysis and integration for the last three decades [4]. The purpose of the study is to understand the groundwater quality based on heavy metal concentration, pictorially represent it using Geological Information System (GIS). |
II. MATERIALS AND METHODS |
Study area: |
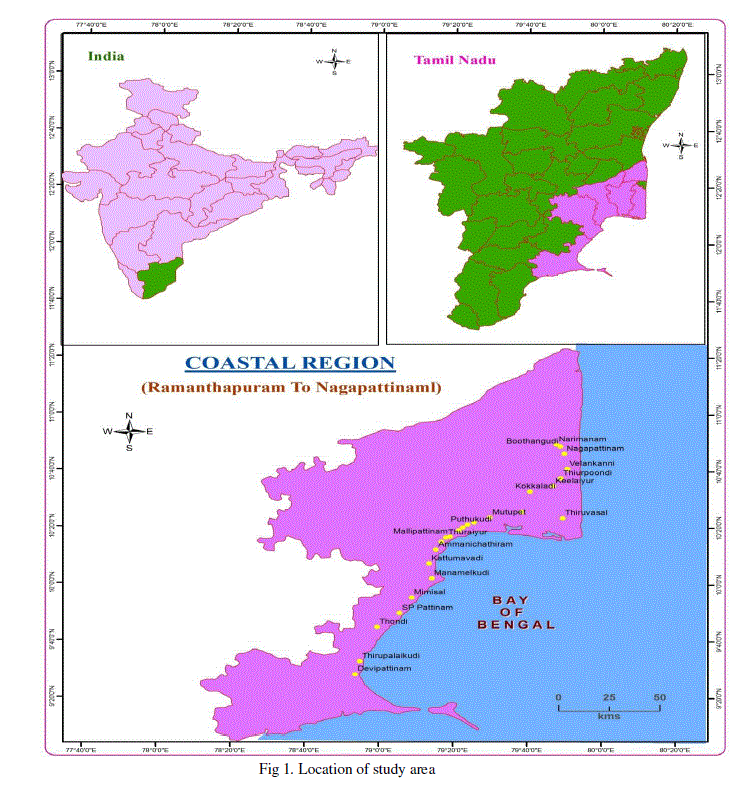
| Study area is located between latitude 9 42’ 0 275” and longitude 79 53’, 13.583”as shown in fig (1) This study area has important mangrove forest namely muthupet located in Thiruvarur district and important pilgrimages like Devipattinam, Thondi and Velanganni. This study area covers five districts like Ramanathapuram, Thiruvarur, Pudukottai, Tanjore and Nagapattinam. In this study area three rivers and one canal are open to the sea by a narrow mouth. These three rivers are tributaries of river Cauvery such Vettar, Uppanar and Vellar, which run through a large agriculture belt before they enter the sea. The Vettar river flows into the Thiruvarur districts and drains in Nagore located in the northern part of the study area. The river Uppanar and Vedaranyam canal were joined at the Akkaraipatti village before entering the sea and is located in the southern side of Nagapattinam city. Furthermore, some tourism sites, such as Velanganni and Nagore are located in this area. |
| With the rapid development of these tourism sites and cities, a lot of domestic solid waste and waste water was discharged into the river (or) into the sea directly and also the December 2004, tsunami hit along the coastal belt of the Velanganni, Nagapattinam coast with resulted in very large economic loses[5]. |
Field sampling: |
| Ground water samples were collected in 5L polythene container from 25 different localities (Fig 1) in Palk strait sea shore (From Ramanathapuram to Nagapattinam) area. Before collecting the sample, polythene containers cleaned by soaking it in 10% nitric acid over night washed and rinsed with distilled water on the day of sampling. At the sampling site, the bottles were rinsed twice with the water being sampled, prior to the filling. One ml of con.HNO3 is added to each sample. The samples are filtered immediately upon arrival at the laboratory, using a 0.45μm Millipore membrane filter [6] and the water samples are stored in the laboratory at 4ºC. An aliquot sample is taken into beaker, further it is digested on a hot plate and reduced to a volume less than 50ml. The digested sample is poured into a 50ml volumetric flask and made up by distilled water, which is used before to rinse the digested sample beaker. The prepared sample is kept in the dark place and the trace elements were analyzed by using Atomic Absorption Spectrometer [7] using air –acetylene flame. Operational conditions were adjusted in accordance with the manufacturer’s guidelines to yield optimal determination. Quantification of metals was based upon calibration curves were determined several times during the period of analysis. The detection limits for manganese, copper, chromium, lead, cadmium, zinc are 0.001, 0.001, 0.004, 0.002, 0.01, 0.005, 0.008mg/litr respectively. |
 |
III. RESULT AND DISCUSSION |
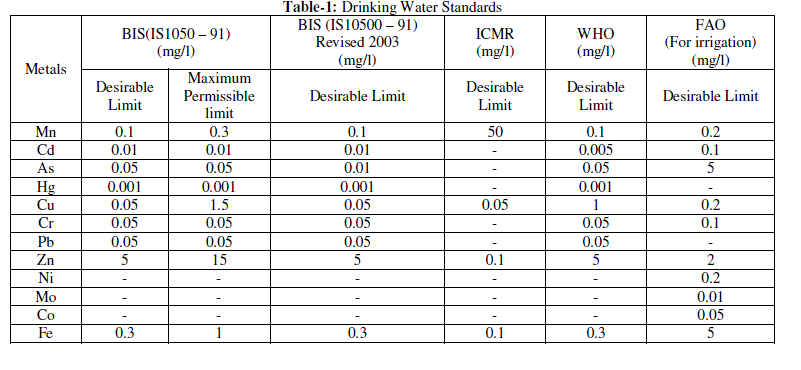
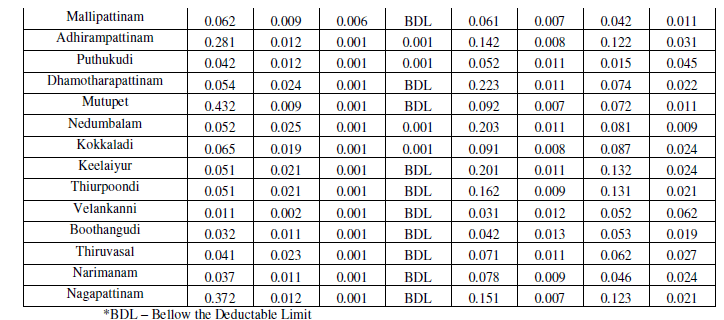
| The variation in the concentration of trace metal (Mn, Cd, As, Hg, Cu, Cr, Pb and Zn) in the groundwater during post monsoon of study area was evaluated. The obtained results of heavy metal analysis are reported in table 2. The concentrations of heavy metals were compared with drinking water standard prescribed by WHO, BIS, ICMR and FAO (Table 1). |
 |
 |
| Manganese is an essential, which does not occur naturally as a metal, however, it is found in various salts and minerals frequently in association with Iron compounds. In our study area some samples has tha concentration of Manganese has above the permissible limit prescribed by WHO, BIS, ICMR and FAO. The presence of manganese above the permissible limit of drinking water leads to alter the taste of water.Long term intake of arsenic may give rise to skin lesions at concentration 50mg/litr. Cadmium (Cd) and lead (Pb) are heavy metals more critical for human health also. Cd may be cause the diseases; hypertension, arteriosclerosis, cancer etc [8]. Mercury is a toxic element and serves no physiological function in man ie., non essential element. Mercury is generated and naturally in the environment from degassing of the earth crust, forms volcanic emission. In our study area some samples has tha concentration of Mercury has bellow the permissible limit prescribed by WHO, BIS, ICMR and FAO. In our study area found almost all samples has the heavy metal concentration bellow its permissible limit prescribed by WHO, BIS, ICMR and FAO. |
 |
IV. CONCLUSION |
| The concentrations of heavy metals like Mn, Cd, As, Hg, Cu, Cr, Pb and Zn have been determined by using Atomic Absorption Spectroscopy. Based on the experimental data, this study shows that, most of the groundwater samples have high content of Hg, Mn, Pb, Cd and Cu. The heavy metal concentration has been displayed by mapping during post monsoon. On the basis of above discussion it may conclude that the underground drinking water at almost all sites in Palk Strait Sea shore is highly contaminated. Therfore the use of ordinary hand pump and borewell should be discouraged. People dependants on this water are often prone to health hazards due to contaminated potable water. Therefore indigenous technologies should be adopted to make water fit for purpose [8]. The safe drinking water in quality affected areas could also provided by sanctioning schemes based on surface water sources. |
ACKNOWLEDGEMENT |
| Author is thankful to the Management of Mohamed Sathak A.J College of Engineering, Chennai, Dr.A.Murugesan, Dept of Chemistry, Sriram Engineering College, Veppampattu RS, Chennai, and special thanks to Dr.A.Ramu, Professor, Inorganic Chemistry, Madurai Kamaraj University, Madurai for his kind advice and suggestion to improve the quality of this work. |
References |
|