Tian-Xiao He* and Tung Nguyen
Illinois Wesleyan University, Bloomington, IL 61702-2900, USA
Received: 26/06/2015 Accepted: 06/10/2015 Published: 16/10/2015
Visit for more related articles at Research & Reviews: Journal of Statistics and Mathematical Sciences
In this paper, we examine the applications of wavelet analysis on finance and related fields. We go over some relevant wavelet transforms and discuss their potency in dealing with financial data. Then, we consider the issues with the choice of wavelet and practical implementation. Finally, several applications on finance and economics are discussed in details with provided examples for the demonstration.
Wavelet analysis, Financial time series.
Wavelet Analysis is a powerful tool for compressing, processing, and analyzing data. It can be applied to extract useful information from numerous types of data, including images and audio signals in Physics, Chemistry and Biology, and highfrequency time series in Economics and Finance.
The history of Wavelet Analysis can be traced back to several school of thoughts that were in isolation originally but then converged into a complete field as of now. The earliest work related to Wavelet Analysis is from Alfred Haar in the beginning of the century. He found an orthogonal system of functions on, which is known nowadays as the simplest basis of the family of wavelet and named after him, the Haar wavelet.
Since the appearance of Haar’s work, many other important contributions have been made in the field of Wavelet Analysis. Some of them are the discovery of continuous wavelet transform (CWT) in 1975 by Zweig followed by a more detailed formulation by Goupillaud, Grossmann and Morlet in 1982; the construction orthogonal wavelets with compact support by Daubechies in 1988; the introduction of multiresolution framework by Mallat in 1989; the time-frequency interpretation of CWT by Delprat in 1991 and many others. More details and theoretical backgrounds of these important concepts are discussed in Theoretical background (Figure 1).

Figure 1: The first and simplest mother wavelet function.
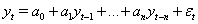
With the intensive development and expansion of the theories, recently Wavelet Analysis’s applications have reached a wide range of fields, particularly Economics and Finance which are the main interest of this paper. The last few decades have been an era of big data, especially for the field of Finance, as many financial variables such as stock prices now can be measured in very high frequency - on minute-basis or even second-basis. Financial data sets become huge, featuring large volume as well as high variability and complexity. More than ever, this increasing sophistication calls for the need of data processing tools. Scholars and experts in the field yearn for mathematical theories and applications that can help them make sense of all the information presented in the data, and use that information to improve their understanding about financial systems or just simply to make wise decisions.
With the development of data analysis tools, some traditional ones such as time-series analysis, which focuses on timedomain and spectral analysis, which focuses on frequency-domain, are reevaluated due to their limitations. The first limitation is that these traditional techniques usually require a very strong assumption that the data is based on some underlying process; in particular the data must be stationary (i.e. its mean and variance do not change over time and do not follow any trends). However, this is hardly true for many economic and financial time series. Usually, variance or volatility of these series follows a complicated trends and patterns such as structural breaks, clustering and long memory. Another limitation of spectral analysis is that the frequency decomposition only makes sense when the market activity is stable across the whole period. This may not be the case, for example market activity can be especially high during several months of the year and relatively quiet during some others.
Unlike traditional methods, Wavelet Analysis, which has only been adapted to Economics and Finance recently, possesses several advantages that help to overcome the limitations discussed above and provide useful information that traditional methods fail to deliver (Figure 2).

Figure 2: Example of financial data - Apple stock market returns.
In this paper, we focus on three main advantages of Wavelet Analysis over traditional data analysis tools.
Wavelet Analysis is flexible and do not require strong assumption about the data generating process: To its core, Wavelet Analysis has the ability to represent highly complex data without the need to know its underlying functional form. This is of great benefit to Economics and Finance as the underlying process of a data set is not always known precisely. As discussed above, many economic and financial time series are not stationary, which makes traditional methods ineffective to deal with these series. However, Wavelet Analysis overcomes this challenge as it does not require the assumption of stationarity of the data.
Wavelet Analysis provides information from both time-domain and frequency-domain: Different from time-series analysis and spectral analysis which only provide information on time-domain and frequency domain respectively, Wavelet Analysis has the ability to decompose the original time series with respect to both time and frequency domains simultaneously. This is of crucial importance to Economics and Finance, as many of these variables may operate and interact differently according to dissimilar time scales. For example, two stock prices may behave in a very similar way on the long term, but diverge significantly in the short run. Therefore, Wavelet Analysis can be a great asset, as it can decompose economic and financial time series into multiple time scales and researchers can study the relationships of these series at each scale.
Wavelet Analysis is equipped with the ability to locate discontinuities in the data: Wavelet Analysis also possesses the ability to locate precisely the discontinuities in the system. This could potentially help experts and scholars in the field of Economics and Finance to determine the exact points of time regime-shifts reflected in the actual market data. They can also locate isolated shocks to the dynamic system.
Due to the restriction of the space, we do not survey much result of the applications of wavelet analysis to economics and finance. Instead, we use examples to demonstrate the actual applications. For those readers who need more materials besides the results mentioned above, they may find many interesting references enlisted comprehensively at the end of our paper, such as [1-52].
The rest of the paper is organized as follows. Section 2 provides theoretical background on important concepts of Wavelet Analysis, including scaling and wavelet function, continuous and discrete wavelet transforms, and multiresolution analysis. Section 3 discusses implementation and practical issues such as the choice of appropriate wavelets and mathematical packages that incorporate wavelet analysis tools. Section 4 goes into details of Wavelet Analysis applications on Economics and Finance using examples from actual market data. Section 5 summarizes the paper and provides some concluding thoughts.
We start off with Multiresolution Analysis (MRA), a design framework for scaling functions and wavelet functions.
Definition: A Multiresolution Analysis (MRA) generated by function φ consists of a sequence of closed subspaces  of
of  satisfying
(nested) for all
  ;
;
(density)
(separation)
(scaling)
(Basis) There exists a function  such that
  is an orthonormal
basis or a Riesz basis for
is an orthonormal
basis or a Riesz basis for 
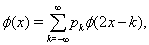
The function whose existence asserted in (v) is called a scaling function of the MRA.
A scaling function φ must be a function in with  .
Also, since is also in
.
Also, since is also in  and is
  a Riesz basis of ,there exists a unique sequence
  that describe the two-scale relation of the
scaling function
that describe the two-scale relation of the
scaling function
 (1)
(1)
i.e., φ is of a two-scale refinable property.
From the scaling function, we also have the corresponding wavelets
 (2)
(2)
Here, the scaling functions act as a filter for low-frequency signal (which is sometimes called approximation coefficients) and the wavelet functions act as a filter for high-frequency signal (which is called detailed coefficients).
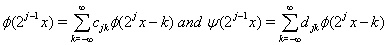
Let x(t) be a function in  ,
then the CWT of
,
then the CWT of  at a scale
  and translational value
  is
is
More details on CWT can be found in Chapter 4 Section 6 of Introduction to Wavelet Analysis[26]. Here we just want to focus on the aspect of its application: how suitable it is in processing and analyzing financial time series data.
The advantage of CWT is that it can extract components with simpler structure from a very complicated function. Then instead of studying the original function as a whole, we can study each small components.
However, CWT is not suitable for financial data due to its several weaknesses. First of all, as financial time series are discrete data with huge number of data points, it is very costly or even impossible to calculate all wavelet coefficients. Secondly, as CWT introduces two parameters, it is likely to add redundant information into the data[37]. We turn to a simpler type of wavelet transformation in the next subsection
Suppose we have the scaling and wavelet functions which satisfy the following refinement relation
Let  be the original data. In
the case that the scaling functions and wavelet functions are orthogonal, then the lowfrequency or the approximation coefficients can be found by
be the original data. In
the case that the scaling functions and wavelet functions are orthogonal, then the lowfrequency or the approximation coefficients can be found by
and the high-frequency or the detailed coefficients can be found by
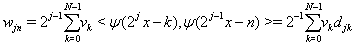
Again, more details on the DWT can be found in Chapter 2 Section 4 of Introduction to Wavelet Analysis [26]. We would like to discuss the advantages and disadvantages of DWT as well.
The main advantage of DWT is that it inherits the same benefit of CWT but uses a limited numbers of translated and dilated versions of the original wavelet[37]. Therefore it is much easier to calculate all the coefficients, and especially when the scaling and wavelet functions are orthogonal.
However, it suffers from 3 major disadvantages[37].
• First of all, DWT requires the number of data points to be 2n .
• Secondly, it is not shift-invariant
• And lastly, it may shift the peak or trough of the original series, making the approximation coefficients not coherent with the original data
In order to overcome these disadvantages, in the next section one particular modification of DWT is discussed, which acts as much as possible like the DWT, but does not suffer from the above disadvantages.
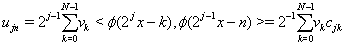
In order to implement the MODWT, the filters  and
and  must be rescale as follows
Then the 1approximation and detailed coefficients can be calculated by
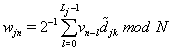
where N is the length of the time series and Lj is the width of the filters: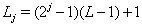 , where L is the width of the
  base filter. More details on the theoretical background of MODWT can be obtained from Cornish et.al.
[16].
base filter. More details on the theoretical background of MODWT can be obtained from Cornish et.al.
[16].
Except for the fact that MODWT is not orthonormal like DWT and thus is highly redundant, it has several desirable characteristics that are suitable for examining financial time series data[37].
• Firstly, unlike DWT, it can be applied to a time series with arbitrary length n (i.e. n needs not to be  )
)
• Secondly, unlike DWT, it is shift-invariant.
• Thirdly, its approximation and detailed coefficients shift along with the original data (i.e. they have the same peaks and troughs as the original data).
Besides the types of wavelet transformation that are appropriate to financial time series, the next issue that we would like to consider here is the choice of scaling and wavelet functions. Certainly, the choice of scaling and wavelet functions are not unique; there are numerous wavelets such as Haar wavelet, Daubechies wavelet, Shearlet, Curvelet, Shannon wavelet, Meyer wavelet, Battle-Lemarié spline wavelet, Strömberg spline wavelet, Mexican hat wavelet with different characteristics, etc. Some researchers in the field suggest that Daubechies wavelet may be one of the most popular wavelets for analyzing financial data[37]. Still as there could potentially be different types of data and different contexts, the choice of wavelet is not definite.
Instead of determining on one or several suitable wavelets for finance, it is more useful to discuss the properties of wavelets that should be taken into consideration when choosing appropriate wavelets. Based on the work of Masset[37],here we list some of the most important properties and criteria
Symmetry: The symmetry property is important in the sense that a symmetric scaling function and wavelet would ensure the approximation and detailed coefficients to align with the original data (i.e. there is no phase shift). However, except for Haar wavelet, almost all other ones are not symmetric. In order to deal with the asymmetric characteristics, MODWT can be used instead, to align the coefficients with the data.
Orthogonality: The orthogonal property is also very important as orthogonality gives the wavelets and scaling functions certain advantages. Among these the most desirable benefit of orthogonality is that it allows for a fast and efficient way to decompose the signals into coefficients as well as to reconstruct the signal from its coefficients. As a result, this property can help speed up and reduce the cost of data processing. In addition, wavelet decomposition using orthogonal system would preserve the variance of the original series.
Undoubtedly, not all wavelets are orthogonal. A strategy to construct a class of orthogonal scaling and wavelet functions from cardinal B-spline functions can be found in Nguyen[38]. Example of such scaling functions can be found in Figure 3.

Figure 3: Examples of orthogonal scaling functions based on third and fourth order B-spline.
Smoothness: The smoothness of the wavelet is defined as its number of continuous derivatives. Depending on the nature of the data we work with, we can choose a corresponding wavelet with certain degrees of smoothness. For example, with smooth data like annual stock price, we may use smoother wavelet functions and with disjoint data like stock return we may use less smooth wavelet functions like the Haar and Daubechies wavelet.
Length of wavelet filters: It is of critical importance to determine the appropriate length for the filters. Several strategies for choosing optimal length are listed in Masset[37].
In this section we will present an example to illustrate the process of using Mathematica package to perform wavelet analysis. The procedure follows the three steps: extract data, import data and process data using Mathematica
Extract data from public source: First of all, we extract the data of interest from public or private sources. In this case, I use the website Yahoo! Finance as the source for stock price of Apple Inc.
• Go to Yahoo! Finance
• Look up Apple Inc with the symbol AAPL
• Go to Historical Prices
• Choose the period and frequency (here I choose the period from Jan 2nd 2015 to Feb 11th 2015, daily stock price)
• Click Get Prices
• Click Download to Spreadsheet
Now we should get Apple stock price since the beginning of year 2015. Next, we can sort the data by date, transform it into growth rate (or return in Finance), copy the data into a new excel file (here I name it apple.xlsx) and transpose it from column form to row form, which is more convenient later on.
Import the data into Mathematica notebook: After obtaining the data from Yahoo Finance, we will continue with importing the data into Mathematica and assign a specific variable to the data.
• Open Mathematica directory, then open Documentation/English/System/ExampleData
• Copy the file apple.xlsx to this location
• Open Mathematica notebook
• Use the command x=Import["ExampleData/apple.xlsx","Data",1,1] to import and assign the data to a new variable x. Hit Shift + Enter/Return to run the command. (you can change apple.xlsx to the name of your file, and the second number to the column that contains the data. For example, if I store my data in the 2nd column, then I will change the last part of the command into Data,1,2)
For Mac, instead of using Example Data folder as the directory, you can go to the file and find the directory, and replace ExampleData with the directory of the excel file
• Enter x and hit Shift + Enter/Return to see the data in Mathematica. We can also plot the data by using the command ListLinePlot[x]
Process data using Wavelet package: The next step would be to use the built-in Wavelet package of Mathematica to process the data. Note that there are a lot of commands in the package, which can be found in the document center of Mathematica (open Help/Document Center and use the key word â€oeWavelet†to find related documents). In this manual, I will use the most basic Wavelet Transformation, which uses Haar Wavelet to illustrate the process.
• Use the command DiscreteWaveletTransform[x,HaarWavelet[],1] to perform the transformation on x. (you can change x to the variable that is assigned to the data, change HaarWavelet[] to the wavelet of your choice, and change 1 to the number of levels of refinement. For more details, go to Document Center and search for DiscreteWaveletTransform.)
• Use the command Normal[%] to view all the coefficients. The series preceded by 0 is the coefficient of the Haar scaling function for the first level of refinement (the signal). The series preceded by 1 is the coefficient of the Haar wavelet function for the first level of refinement (the noise). We will mainly pay attention to these series for now.
• Mathematica can also perform inverse wavelet transform; that is from the coefficients, Mathematica can reconstruct the original data. In order to perform the inverse transformation, we need to know the type of wavelet and transformation used. In this case we use Haar wavelet and Discrete Wavelet Transform. Next, we use the command
y=DiscreteWaveletData[Index Coefficients,Index Coefficients,HaarWavelet[],
DiscreteWaveletTransform]
• Finally, we use the command InverseWaveletTransform[y] to find the original data.
Finally, in this chapter, we discuss several applications of wavelet analysis in economics and finance. Each of the applications below is put into consideration thanks to the advantages of wavelet analysis discussed in Section 1. In each of the applications, we first restate the advantages of wavelet analysis and link them with specific financial usage. Then we explain the implementation and provide examples to illustrate the processes.
The majority of applications in economics and finance of wavelet analysis comes from its ability to provide information from both time-domain and frequency- domain. This is of crucial importance to Economics and Finance, as many of these variables may operate and interact differently according to dissimilar time scales. Therefore, wavelet analysis can act as a tool to decompose the data into signals of different time scales before we can apply econometric techniques to analyze them. Indeed, this section presents several cases when wavelet transformation can be applied to financial time series as a preliminary transformation.
In finance, there are numerous circumstances when we need to evaluate the correlation between two more more variables. For instance, it is very useful to know the correlation between individual equities in order to establish a diversification investment strategy. From finance theory, investors can improve their return and reduce risk by diversifying in different stocks with low correlation. On the other hand, stocks with high correlation do not add much value to a portfolio. As a result, investors often want to know the correlation among stocks that they are interested in so that they can construct an optimal portfolio.
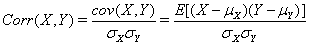
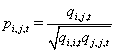
Regarding this problem, statistics provides investors with a simple way to find the correlation between two variables, which is called the Pearson’s product-moment coefficient. This correlation coefficients is defined as the ratio of the covariance of two variables X, Y and the product of their standard deviation
Although this coefficient is very easily understandable and calculated, one problem remains as the correlation takes into consideration all the information presented in the equities’ prices, including the main signals and the noises. This could be a disadvantage since investors may want to focus more on the long-term correlation and ignore the short-term noises. Fortunately, wavelet transformation allows us to extract the main signals, or the approximation coefficients from the original data. Therefore, using wavelet transformation as a preliminary transformation before actually perform the correlation analysis would assure that the calculated correlation does not take into consideration all the noises which may reflect unwanted information.
Here we illustrate the process by examining the correlation between two stock returns of: Apple Inc. and Microsoft Corp in the period from January 2nd 2015 to April 20th 2015 (Figure 4).

Figure 4: Apple Inc and Microsoft Corp stock returns from January 2nd 2015 to April 20th 2015.
First we calculate the correlation coefficient of the two original time series. Then we try the wavelet approach: we use DWT with Daubechies wavelet to obtain the approximation coefficients of the 2 series before actually computing the correlation. The result can be found in Table 1.

Table 1: Apple Inc and Microsoft Corp stock returns from January 2nd 2015 to April 20th 2015.
Although this coefficient is very easily understandable and calculated, one problem remains as the correlation takes into consideration all the information presented in the equities’ prices, including the main signals and the noises. This could be a disadvantage since investors may want to focus more on the long-term correlation and ignore the short-term noises. Fortunately, wavelet transformation allows us to extract the main signals, or the approximation coefficients from the original data. Therefore, using wavelet transformation as a preliminary transformation before actually perform the correlation analysis would assure that the calculated correlation does not take into consideration all the noises which may reflect unwanted information.
Here we illustrate the process by examining the correlation between two stock returns of: Apple Inc. and Microsoft Corp in the period from January 2nd 2015 to April 20th 2015 (Figure 4).
First we calculate the correlation coefficient of the two original time series. Then we try the wavelet approach: we use DWT with Daubechies wavelet to obtain the approximation coefficients of the 2 series before actually computing the correlation. The result can be found in Table 1.
Source: Authors’ calculation From this result, we observe that by using wavelet transformation approach, we do find a higher correlation between two stock returns compared to the normal approach. This can be explained by the fact that the noises in the original time series may lower the actual long-run correlation between two stock returns.
While in some cases, the static correlation analysis is adequate, some time financial research requires a time-varying measure of the correlation. For example, one may be interested in finding how the correlations of stock markets has changed over time to investigate the evolution of financial integration among stock markets. Again, in such case, the application of wavelet transformation before actually processing with econometrics techniques is useful in removing the noise and focus on the main signals only.
Same as the previous section, the first step is to use DWT to decompose time series into approximation coefficients (the main signals) and detailed coefficients (the noise).
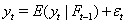
Then in the second step, we can apply the model DCC-MGARCH from Engle[19] as follows
First, consider the original Bollerslev model[13]:
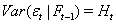

where  is a sequence of return
vectors,
is a sequence of return
vectors,  is the information
available to time t
is the information
available to time t  and R is the
correlation matrix containing the conditional correlations.
and R is the
correlation matrix containing the conditional correlations.
Engle[19] modifies the model by allowing the correlation matrix R to vary over time

One specification for the correlation matrix is suggested by the model GARCH(1, 1)

where  is the unconditional
correlation between
is the unconditional
correlation between  and
and  (Engle [19]). The above equation can be written as follows
Then the c,o,rrelation estimator will be calculated as
which is always positive and represents the correlation level over time.
In order to illustrate the process, we use an example here from one of the authors independent research in finance. In his project, T. Nguyen[38] investigates the financial integration between China and ASEAN stock markets in the last decade (from 2004 to 2014) using dynamic conditional correlation measure with DWT approach. The stock market indexes and graph of the timevarying correlation between China and ASEAN stock markets is shown below Table 2.

Table 2: Stock market indexes of China and the ASEAN countries.
At a glance, the correlations range from less than 0.1 to at most 0.5 and fluctuate around 0.3 for the majority of time. According to the categorization by Dancey and Reidy, the correlations between China and the four ASEAN countries are at weak to moderate levels. This implies China stock market is not highly integrated with the four ASEAN countries, indicating that there are potentially diversification benefits when investors include equities from the four ASEAN countries to their portfolios.
The correlations between China and the four ASEAN countries also follow a similar pattern. They rose sharply in the period from 2006 to 2009, which is right before and during the financial crisis, and reached a peak in 2009. After 2009, the correlations leveled off and had two smaller peaks in 2012 and 2013-2014. It implies that the diversification benefits to be especially low at these three points of time. Altogether, the wavelet approach as the preliminary analysis sharpens the result, ensuring that all the interpretations above are not subjected to the effects of short-run noises in the original data (Figure 5 and 6).

Figure 5: National stock market index returns of China and the ASEAN countries.

Figure 6: Dynamic conditional correlation between China and the ASEAN countries.
Sometimes in the field of finance and economics, instead of just examining the correlation between two variables, we would like to study the causality between them. Take the stock market returns case as an example. In the previous section, we have studied the dynamic correlation between the stock market returns of China and ASEAN nations. However, if we want to know more about the underlying process, that is if the stock market return of the big country like China indeed causes the movement of the smaller markets such as the ASEAN ones, then correlation is not adequate.
Regarding this goal, another econometric model - the Granger causality model - could be employed. As causality is a rather complex and indeterminable concept, Granger[22] proposes a definition of his own version of causality that is more applicable to real life situation.
He defines the causality according to 2 principles
1. The cause happens prior to its effect
2. The cause has unique information about the future values of its effect
Then Granger[22] establish the mathematical interpretation of his principles as follows. If X has causal relationship on Y, then

where A is an arbitrary non-empty set and  and
and  are the
information of Y in which X is included and X is excluded respectively. If the condition is satisfied, then X is said to have Granger causality on Y in the sense
that X contributes to the prediction of future value of Y.
are the
information of Y in which X is included and X is excluded respectively. If the condition is satisfied, then X is said to have Granger causality on Y in the sense
that X contributes to the prediction of future value of Y.
The statistical implementation is rather simple. Let y and x be stationary time series. Then to test empirically if x Granger causes y, we run a 2-step regression equation. First of all, we run an autoregressive (AR) model, in which the current value of y is the function of its past values. The appropriate length of the AR terms can be determined by information criteria.
After that, we modify the equations by including the lagged values of x

Here  and
and  are the first and last lags of x that causes some
effects on y. The hypothesis that x Granger cause y is true when at least one of the coefficients of x is significant.
are the first and last lags of x that causes some
effects on y. The hypothesis that x Granger cause y is true when at least one of the coefficients of x is significant.
To illustrate the process, again we make use of the stock market index returns of China and ASEAN countries as described in the previous section. Again, we use DWT before running the 2-step regression. This would remove the unwanted effect of the noises in the original data.
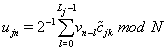
In this example, we examine the causal effect of China stock market index on Indonesia stock market index. By running the AR model with max lag of 3 and comparing the information criteria (we choose the model with the lowest information criteria as it allows for least amount of information loss) we end up with the model AR(1) (there is only 1 lag in the independent variable) as the best fitted model for Indonesia stock market return (Table 3).

Table 3: Regression result for AR model of Indonesia stock market return.
Next, we add the lagged terms of Chinese stock market index return as independent variables. We try adding 1, 2, and up to 6 lagged terms. The results are presented below (Table 4).

Table 4: Granger causality test of Chinese stock market return on Indonesian stock market return.


From the results, it seems that the forth lagged term of Chinese market index has significant effect in predicting Indonesian stock market index return. This effect is observed consistently in the case with 4, 5 or 6 lagged terms. This indicates that the Chinese stock market index indeed Granger causes the Indonesian stock market index.
Another application that we discuss in this paper is the forecast power of DWT approach when it is paired with time series forecast techniques.
In the finance and economics, forecasting is also one of the important applications with wide range of usage. Investors can use the forecasted stock prices to make decision regarding buying, selling or holding the stock or to change their portfolio accordingly. Economists and policymakers also benefit greatly from the forecast of economic variables such as GDP, inflation, housing price, etc. The forecast can be served as a piece of quantitative evidence to inform decision on policy making.
With the importance of forecasting, economists have developed several techniques such as the forecasting by the ARMA model. Here we would modify the traditional ARMA forecast by using an additional DWT before the actual forecast process. We will use the stock return of Apple Inc. in Section 4.1 as an example. We attempt to use DWT and ARMA model to project the return forwards by 4 observations into the future. The scheme of the approach is given in Figure 7 below.

Figure 7: Scheme for incorporating DWT into econometric forecast.
In order to implement this scheme, we follow several steps. First of all, similar to Section 4.1, we use DWT with Daubechies wavelet to decompose Apple stock return into approximation and detailed coefficients
Then we fit an ARMA model for both the signal and the noise. Again, using information criteria, we can find the optimal ARMA model for both series. The results are presented in Tables 5 and 6. The optimal ARMA model for the approximation coefficient is ARMA(2,2) while the optimal model for the detail coefficient is ARMA(0,1).
Next, we use the ARMA model to forecast 4 data points forwards into the future. The forecasts are shown in Figures 8 and 9.

Figure 8: Forecast of approximation coefficients.

Figure 9: Forecast of detailed coefficients.
Finally, from the forecasted values of the approximations and detailed coefficients, we apply the inverse DWT to obtain the forecast of the original series. The forecast is presented in Figure 10 below.

Figure 10: Forecast of Apple Inc stock return.
So from the forecast, we observe a positive return for the next four days, but the return seems to decline. This piece of information may inform investors’ decisions. Again, DWT sharpens the forecast as it decompose the original series into signals and noises and forecast each series independently.
In this section we discuss an aproach to measure and present visually the co-movement between financial or economic variables in time-frequency space using a technique called Wavelet Coherence. We follow the procedure established by Grinsted et al. for the construction of the Wavelet Coherence concept.
First of all, the selection of the wavelet used is of importance, since we would like to balance between the time and frequency localization. Grinsted et al. pointed out one particular wavelet with the desired property:
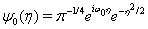
where  is dimentionless
frequency and η is dimentionless time. is chosen to be 6 to balance out the time and frequency localization.
is dimentionless
frequency and η is dimentionless time. is chosen to be 6 to balance out the time and frequency localization.
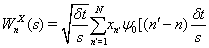
Then the continuous wavelet transform (CWT) of a discrete time series  with uniform time steps
  is defined as the convolution of
  with the scaled and normalized wavelet as follows
Finally, according to Torrence and Webster, the wavelet coherence of two time series X and Y is defined as
where S is the smoothing parameter in both time and scale. As this definition resembles the traditional correlation definition, wavelet coherence can be thought as localized correlation in time-frequency space. Next, we will use an example to illustrate the usage of wavelet coherence in finding and presenting the correlation of two stock market indexes on time-frequency space. We calculate the localized correlation between China stock market index and Malaysia stock market index from 2004 to 2013. The wavelet coherence is presented in Figure 11.

Figure 11: Wavelet Coherence analysis between China and Malaysia stock market indexes.
From the figure, we can observe that for most of the frequencies, except for the highest frequencies (64 and 128 weeks), the correlation between China and Malaysia stock market indexes is not high. From investor perspective, this indicates that as the correlation is not high in the short-to-medium term, there is diversification benefit by investing in a portfolio which consists of China and Malaysia stock market indexes. Very long term investment into these 2 indexes yields no significant benefit.
We have presented numerous applications of wavelet analysis in Finance and Economics fields. Wavelet transformation indeed proves to be an effective tool to decompose time series into different level of frequency. From this decomposition, researcher can study the interaction of financial and economic variables at different level: from the very short-run or high frequency level to the very long-run or low frequency level.
The potential of wavelet is not limited to these applications only. Some of the advantages of wavelet analysis are not addressed in this paper. For example:
• Wavelet Analysis is flexible and do not require strong assumption about the data generating process
• Wavelet Analysis is equipped with the ability to locate discontinuities in the data
These benefits can lead to many different applications. Wavelet analysis can be used to locate the discontinuities or regime changes in financial and economic time series. It can also be used in the model that do not require strong assumption about the underlying process of the time series. In this light, I do believe that the incorporation of wavelet analysis into Finance and Economics will continue to be developed and expanded in the future.
We would like to express our gratitude to the anonymous referees for their helpful comments and remarks that led to an improved/revised version of the original manuscript.