ISSN ONLINE(2319-8753)PRINT(2347-6710)
ISSN ONLINE(2319-8753)PRINT(2347-6710)
Prabhu C1, Aravindha balaji S2
|
| Related article at Pubmed, Scholar Google |
Visit for more related articles at International Journal of Innovative Research in Science, Engineering and Technology
Implementation of lean principles like six sigma level of production in Indian pump manufacturing industry faces various roadblocks which makes them losing market share to the low cost Chinese pump imports. The only way to survive in market for Indian pump manufactures is to reduce the cost of pump and also increase the quality value of the pump, which can be done by reducing cost of production and profit margins. This project aims in reducing total cost of production of Indian pump manufacturing companies by introducing latest technologies of manufacturing in the Indian context of Pump industries. This project mainly aims in reducing the cost of production of centrifugal pump to a tune of about 20% of the existing cost of production. This project utilizes the lean principles like Kanban system and process optimization techniques like process remodeling and line balancing using computational methods by Arena software to achieve the above said cost reduction methodology. This project also try to eliminate or reduce the impact of Non value added (NVA) activity by using time-Motion study conducted in shop floor of an industry using “gemba” way of time –Motion chart preparation on the assembly line and using timer pro software to access and assist in optimization of division of work between multi workers of the pump assembly, where by the effective operator utilization rate is increased which results in creating more value added benefits to the pump manufacturing apart from cost reduction alone.
Keywords |
| lean, Kanban, pump and Non value added activity (NVA) |
INTRODUCTION |
| Lean operating principles began in manufacturing environments and are known by a variety of synonyms; Lean Manufacturing, Lean Production, Toyota Production System, etc. It is commonly believed that Lean started in Japan (Toyota, specifically), but Henry Ford had been using parts of Lean as early as 1920âÂÂs, as evidenced by the following quote: “One of the most noteworthy accomplishments in keeping the price of Ford products low is the gradual shortening of the production cycle. The longer an article is in the process of manufacture and the more it is moved about, the greater is its ultimate cost.” [Roberto Panizzolo]. In order to set the groundwork for this paper, let we begin with the definition of Lean, as developed by the National Institute of Standards and Technology Manufacturing Extension Partnership Lean Network. |
| A systematic approach of identifying and eliminating waste through continuous improvement, flow the product at organization operations, where waste is viewed as any use or loss of resources that does not lead directly to creating the product or service a customer wants when they want it. In many industrial processes, such non-value added activity can comprise more than 90 percent of a factory total activity. The objective is to make the production flow through the system quicker and in more predictable manner. The intent is to eliminate waste thereby permitting better wages for workers, higher profit for owners and better quality for customer. Value stream mapping is a set of methods to visually display the flow of materials and information through the production process. The objective of value stream mapping is to identify valueadded activities and non-value-added activities. Value stream maps should reflect what actually happens rather than what is supposed to happen so that opportunities for improvement can be identified. Value Stream Mapping is often used in process cycle time improvement projects since it demonstrates exactly how a process operates with detailed timing of step-by-step activities. It is also used for process analysis and improvement by identifying and eliminating time spent on non- value-added activities. Lean Manufacturing is a buzzword. More often it is used with the terms like benefits, cost reduction, leadtime reduction etc. but if you have not started implementing lean manufacturing yet and if you have not started benefiting from lean manufacturing yet, you will need some numbers to be motivated. We shall look into some quantified benefits of lean manufacturing where the principles of lean are implemented successfully. |
| The Objective of this research was to: |
| ï· Understand the current state of the pump manufacturing. ï· Identify the key area of waste, problem and opportunities across the process. ï· Develop of future state vision of each process. ï· Increase the productivity. ï· Develop an action plan to achieve the higher production and lead time reduction. |
II. LITERATURE REVIEW |
| The value stream mapping is used to identify the current process of motor manufacturing industry. The current state map is used to identify the wastes and non-value added activities in the production process. The Witness and VIP-PLAN out software is used to improve the process (S. P. Vendan , K. Sakthidhasan (2010)). R.M. Belokar, Sandeep Singh Kharb, Vikas Kumar (2012) drawn current state map for automobile industry. The inner wheel housing is taken for the case study. The cycle time of the welding process exceeds the takt time of the current state. By modifying the layout and welding operation the improvement has been made in the future state map is drawn with improvement. The production is improved by 44%.P.S.Senthil Kumar, Dr.S.Balasubramanian, Dr.R.K.Suresh (2009) introduced a Value stream Mapping (VSMADSP) approach that, unlike Value Stream Mapping (VSM), is able to map value streams that have multiple flows that merge. VSM utilizes a variety of stages and product grouping tools that can be executed. Advanced dual stage performance phase helps to merge flows whereby it becomes easier to visualize multiple flows in the value stream for a product that has a better stage performance to continue with the product development phases. A current state map with added dual performance phase and lessen lead time for product development is arrived at with a future state map with intelligent systems and functions.Yang-HuaLian, Hendrik Van Landeghem (2002) investigate some relevant lean manufacturing literature where lean principles and tools are presented or utilized. Two simulation models are built for two respective scenarios, push and pull (kanban) systems. Model templates are explained and the key measurements such as lead times, throughput rates, and value-added ratios are compared as well as evaluated. The effects of lean are clearly demonstrated by the simulation. This paper considers the implementation of value stream mapping technique in manufacturing helical springs by railway spring manufacturing company. It focuses on product family, current state map improvements and the future state map. |
| The aim is to identify waste in the form of nonvalue added activities & processes and then removing them to improve the performance of the company. Current state map is prepared to describe the existing position and various problem areas.. Future state map is prepared to show the proposed improvement action plans. The achievements of value stream implementation are reduction in lead time, cycle time and inventory level. It was found that even a small company can make significant improvements by adopting VSM technology. It was concluded that if we adopt the VSM technique the company could reduce the manufacturing lead time from 36.86 days to 34.06 days (RenuYadav, AshishShastri, MithleshRathore (2012)). |
METHODOLOGY |
| To start improving productivity by identifying waste and then removing it by implementing lean principle in the Industry there is no other tool better than VSM. The Value Stream Mapping method (VSM) is a visualization and streamline work processes using the tools and techniques of Lean Manufacturing. The goal of VSM is to identify, demonstrate and decrease waste in the process. |
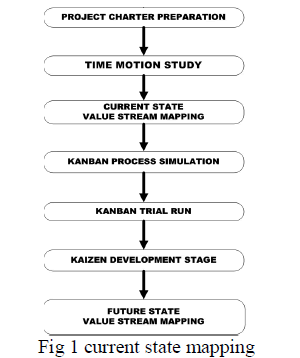
Project chart preparation |
| The time motion study is prepared by using gantt chart in excel sheet. This chart give information about past work and future work of the project. Time motion study The time study is taken by using timer pro software. To make the time study value of operation first take the video of working environment then accurate time is measured by using timer pro software . Current state value stream mapping The current state value stream mapping are used to make the current process and product flow diagram of industry. This CSVSM is used create the future state value stream mapping. Kanban process simulation Kanban (signboard or billboard) is a scheduling system or lean and just-in-time (JIT) production. Kanban is a system to control the logistical chain from a production point of view, and is not an inventory control system |
Advantages of the Kanban System. |
| ï· Minimal planning and control costs ï· Low stocks of each production stage ï· Controlled inventory ï· Increase of the materials availability |
Kaizen development stage |
| The major kaizen activities are always carried-out in the industry through different kaizen sheets. Kaizen updating sheet will keep track of everyday customer requirements and will notify immediately if there is any changes in the part no. this will eliminate the wrong assembly of parts. |
Future state value stream mapping |
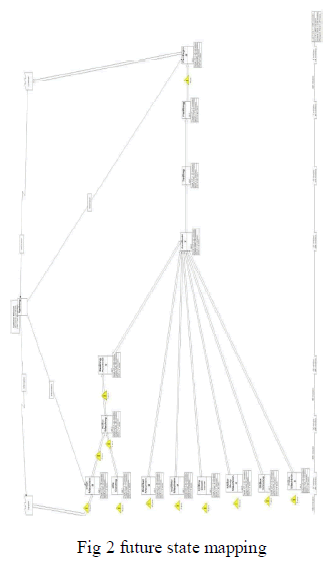
| After collecting the value the future state values stream mapping is draw by using MS-visio or Igrafix. |
 |
IV VALUE STREAM MAPPING |
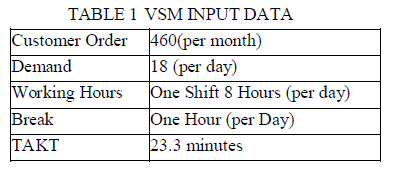
| Preparation of current state map Interaction with the industry the information of the customerâÂÂs requirement per month is obtained. The company has a wide range of customer requesting for a wide range of product from (induction motor). Requirement of motors are 460 motors / month. |
 |
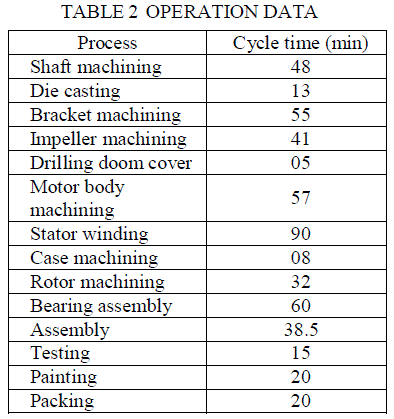
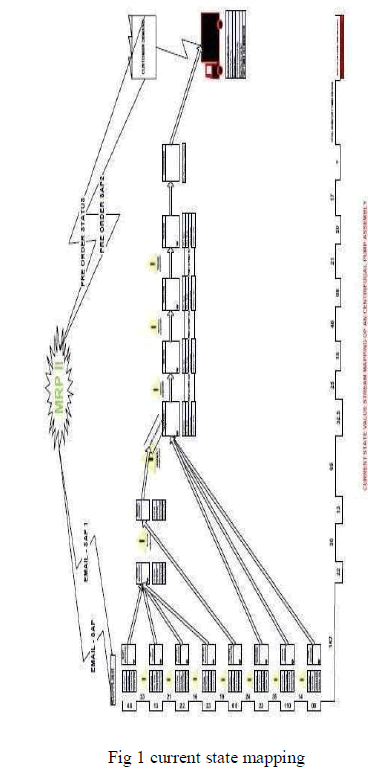
| The main processes are identified first. The main Processes are Shaft machining, Die casting, Bracket machining, Impeller machining, Drilling doom cover, Motor body machining, Stator winding, Case machining, Rotor machining, Bearing assembly, Assembly, Testing, Painting and Packing. The data box envelopes the following data like cycle time, change over time and number of operator. The inventory triangle envelopes two data work in process between each process and respective inventory. |
 |
| Takt demonstrates the rate at which the customer buys the product. TAKT reflects the frequency at which the product has to come out of the manufacturer to meet the customer demand. From Table 1 Takt time is calculated by dividing available working time per shift (in min) with the customer demand per shift. Available Time =Working hours – Breaks = (8 x 60) – (1 x 60) = 420 mins. Takt time Takt time = Available working time per shift / Customer demand per shift |
| 420/7 =60 minsTAKT Time of 60mins represents, every motor has to be completed in every 60mins. Fig |
 |
| Preparation of future state map Process improvement |
| ï· Add additional resources to increase capacity of the bottleneck (an additional machine can be added in parallel or automate the operation to increase the capacity). |
| ï· Minimize non-value adding activities (decrease cost, reduce lead time).(induction |
| Requirement of motors are 460 motors / month |
Requirement of motors are 460 motors / month |
| The main processes are identified first. The main Processes are Shaft machining, Die casting,When cycle time for each process is compared with takt time it is found that cycle time of Stator winding exceeds the takt time, so there is need to improve the process capability of stator winding process to meet the demand of customer within the time. So it can be improved by using various lean tools but here we are improving the cycle time of the process in the following area such as Stator winding, Shaft machining and assembly section. Here we suggested a advanced machining technology for improving the cycle time. |
| The suggested alternatives are: ï· Automating using Windamatics ID 120H coil placer ï· Machining using CNC |
 |
| ï· Movable table for assembly to reduce the transportation distance and time ï· Heat air blower to dry the paint. |
| These improvements are made to reduce the lead time of the motor manufacturing |
V. RESULTS |
| production lead time has been reduced from 1896 mins to 1838 mins and production capacity increased from 121 to 182 respectively. |
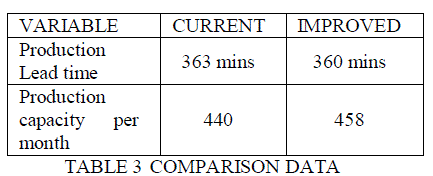 |
| The above table shows the comparison of the existing system and the improved system. The Production Capacity per month =Total available time per month / maximum cycle time = (26*1685)/90 = 458 Improvement in Production = ((458-440)/458)*100 =5% The production is increased by 5%. |
V. CONCLUSION |
| By using Value Stream Mapping the process time and value added and non-value added activities are identified. Lead time is reduced by improvement made in the pump industry. The suggested improvements lead to reduction of production lead time from 363 mins to 360 mins and increased the production capacity from 440 to 458 per month. Production per month can be improved upto 5%. So the customer demand is easily satisfied with this production rate. If the demand exceeds we can plan for further improvements. Lean production means continuous improvement, we must keep on changing future state into current state that will not end during our life. VSM have been proven to be a greatly useful tool to eliminate some waste in a cycle and find there are more waste for you to eliminate in next cycle, during which lean becomes a habit or culture.s |
VI. FUTURE WORK |
| This paper gives only cycle time and inventory data of the pump industry. The Value Stream Mapping is used to identify the waste. Future work of this paper is collecting the distance travelled by the WIP and layout of the plant. From this we can use VIPPLANOPT software to optimise the plant layout. The unnecessary movements and non-value added activities are eliminated. |
References |
|