ISSN ONLINE(2320-9801) PRINT (2320-9798)
ISSN ONLINE(2320-9801) PRINT (2320-9798)
| Laveena C D’Costa, Shilpashri, Sherol Manisha |
| Related article at Pubmed, Scholar Google |
Visit for more related articles at International Journal of Innovative Research in Computer and Communication Engineering
Discrete event simulation is a very important technique used in decision making over a long period of time. There has been a slow down in the growth of use of simulation due to the expensive software’s and also due to the complexity involved in the usage of these software’s. It is not easy for the person’s other than an IT professional’s to use the software’s. GPSS software can be used in simulating any real time system. There are two versions available, the GPSS world student version and the WEBGPSS. This paper discusses the version of GPSS known as WEBGPSS which has overcome the problem of complexity in usage. WEBGPSS allows anyone from any field to use simulation as a technique for their analysis in order to get better results
Keywords |
| Business Simulation, WebGPSS, Decision making. |
INTRODUCTION |
| Discrete event simulation is a very important technique used in decision making over a long period of time. Simulation is a tool for managing change. In business process to know the critical importance of carefully leading the organization simulating is one way to accelerate the change. There has been a slow down in the growth of use of simulation due to the expensive software’s and also due to the complexity involved in the usage of these software’s.[3] GPSS software can be used in simulating any real time system. This paper discusses the version of GPSS known as WebGPSS which has overcome the problem of complexity in usage, is one of the simulation tool used in decision making. It is designed to overcome these problems as well as satisfy the special interests and needs of the business student[2]. This paper covers one representative of simulation model in business with detail explanation on how to use the blocks in WebGPSS and the interpretation of the results which plays a vital role in business simulation [1]. This can be applied to any real world problem to gain insights on the working of the existing system as well to introduce a new system or study the changes in the existing system. |
II. A SELF SERVICE CAFETERIA |
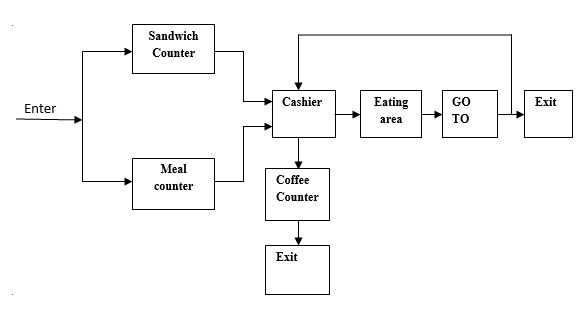
| People arrive at the self cafeteria at the rate of one every 30+20 seconds. The cafeteria has two separate counters for meals and sandwich. The customers can avail the services from both the counters. The sandwich counter is manned by one worker who makes a sandwich in 35+25 seconds. The meal counter is also manned by one server who servers the prepared meal on to the plate in 35+25 seconds. All the customer must pay a single cashier (provision for additional cashier is on consideration), which takes 25+10 seconds. For all customer eating takes 20+10 minutes. After eating, 40 percent of the people return to buy a coffee and pay the cashier for this.. Driking cofee takes 10+2 minutes. Simulate a day of five hours. The output should include data on average time spent in the cafeteria,maximum number of people at any time and average waiting time infront of casheir. The flow chart is as follows. |
 |
| Block diagram is constructed by clicking blocks in the blocks menu to the left and placing them on the block layout. This example consist of three block segment. First block is cafeteria block ,second block is timer and third block is graph block. Blocks can be placed in the block layout by double clicking the blocks in blocks menu. |
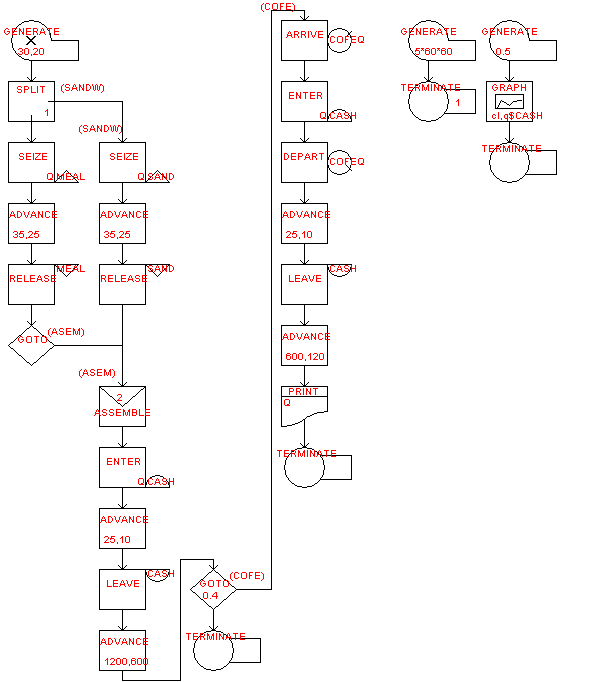 |
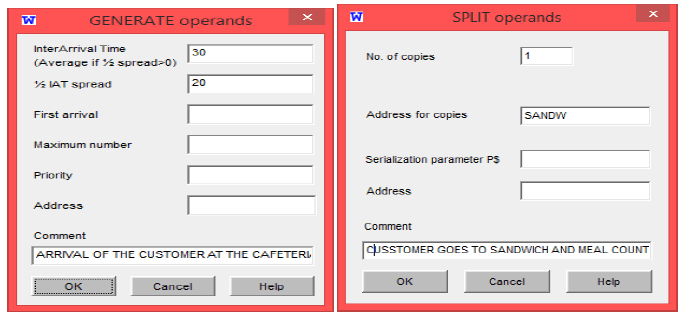
| These blocks are also called as opernads. Each operand has set of properties. In this example cafeteria block segment contains set of Operands. First Operand is GENERATE. Customer arrive at the CAFETERIA at the rate of 30 ± 20 which is represented using GENERATE. GENERATE block is used starts the transaction. Properties of the GENERATE operand is specified in the Figure 1. Once the customer arrives into the cafeteria they will get the serivice from the meal and sandwich counter concurrently so SPLIT Operand is used. This operand specifies number of copies and address of the operand |
 |
| Since there is only one server in the meal counter to serve the meal customer need to SEIZE the server. When server is captured he can provide the service i.e ADVANCE operand. ADVANCE operand cause the delay in the transction by executing the transction. |
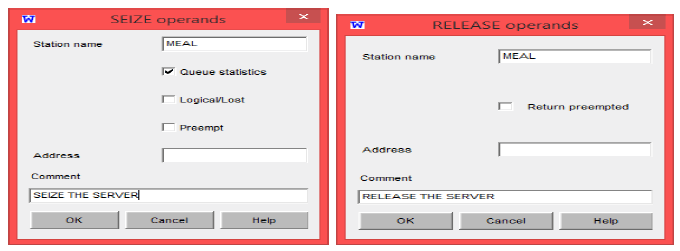 |
| Once the service is provided customer RELEASE the server. In the sandwich counter also there is only one server, the customer need to SEIZE the server then sanwich is prepared by the server which is represented using the ADVANCE. Then customer RELEASE the server. There is only one cash counter, hence meal and sandwich transaction is assembled into one. GOTO is used to transfer the control to the ASSEMBLE. Here GOTO is an unconditional transfer. ASSEMBLE is used to combine the multiple transaction. |
 |
| Once the transaction is assembled the customers ENTER into cash counter. ENTER operand has 1 capacity at present it can be increased in future. Then customer pays the bill. It is represented using the ADVANCE. Once the customer pays the bill he will LEAVE the cash counter |
 |
| Eating the sandwich and/or meals takes 20 ± 10 which is shown in the advance block. After eating 40% of the customer GOTO drink coffee remaining customer (leave the cafeteria) TERMINATE. TERMINATE operand removes the customer from the system. 40% (0.4) of customer enter into the queue since there are many customers. This transfer is referred to as statistical transfer since a percentage of them GOTO have coffee whereas others leave the system. There are three types of GOTO statements conditional, unconditional and statistical. Conditional transfer takes place when we say if the server1 is busy GOTO server 2. Unconditional is one that is depicted in the problem discussed here that is the ones who take the meal and/ or sandwich have to pay the cashier. It is represented using ARRIVE operand. This block collects the data on the waiting line. Then the customers move to pay the cashier. In coffee counter there is only one server so the customer SEIZES the server. Once the server is captured customer DEPART the queue |
 |
| The server serves the coffee and the customers RELEASE the server. Drinking coffee takes 10±2 minutes. ADVANCE operand is used indicate this. Print output is used to print the result. Second block segment contains the GENERATE operand it specifies the simulation clock time and TERMINATE operand end the transaction. This is a timer which runs for 5hrs a day which is converted to seconds 5*60*60 =18000 seconds. The terminate blocks decrements the token by 1 |
 |
| Third block segment contains graph generation .In order to generate the histograms queue tables are used. Here depending on the level of accuracy one needs to set the operands of the GENERATE block. Only the A operand is used as which require the graph for the various intervals of time. We have used the medium accuracy level that is the graph is plotted for every 5th second (A = 0.5). If one needs to improve the accuracy then the value of A in the generate block can be decremented. In the graph the X axis represents time and the Y axis represents the number of units in the cafeteria. Hence at a glance we are able to find out what is the extent to which the cafeteria is being utilized. We have also opted for the histogram which again gives us a clear picture on the waiting time of the customers at various counters. |
 |
| OUTPUT |
| The result window includes Program list, Block Statistics, Print Output, Stations, Tables, Queue Id, Graph and Histogram |
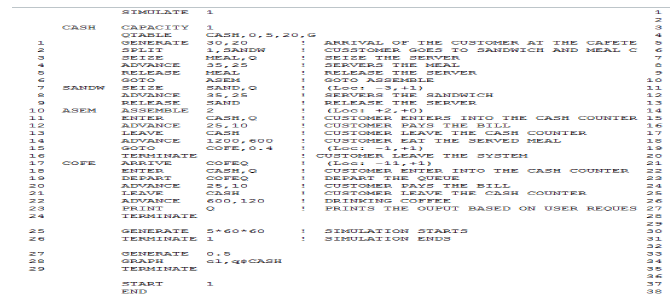 |
| Program List includes the code generated by the webGPSS. It describes working of model. It includes block no, address given to each block, station name and value passed to particular operand. Comments have been used liberally to document the model. The simulation starts the system when it finds the START in the model. END appears after the START. END instructs the processor to return the control to the operating system. |
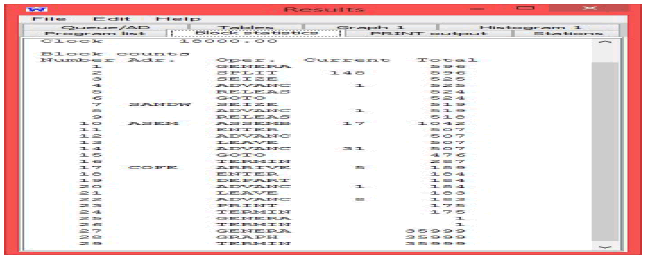 |
| Block statistics gives the information about the total entries into the each block. Total label contain this information. Current label contains the information about total customer received the service |
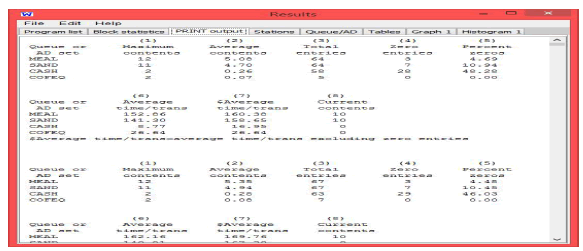 |
| Print Output contains information about Maximum Contents ,Average Contents, Total Entries, Zero Entries , Percent Zeroes, Average Time/Trans, $Average Time/Trans, Current contents labels at each clock time. Average Content label is the maximum numbers of customer waited in the queue. Average Content is the average number of customer waited in the. Total Entries label is the number customer got service. Zero entries label is the number of customer who directly got service which implies that the customer does did not waited in the queue to get the service Average Time/Trans label is the average time taken to complete the transaction with zero entries. $Average Time/Trans label is the average time taken to complete the transaction without Zero Entries. Current content label is the current value of the queue content. |
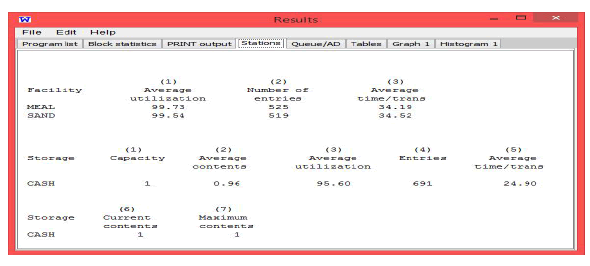 |
| Station field in the output includes the different stations that are used in the block. In this example we have stations called meal, sand and cash. Meal and Sand stations are also called facility, because these stations provide facility to the customer. Cash station is called as capacity because it has storage capacity. In this example we had taken capacity as 1 it can be increased based on user requirements. Average utilization label is the average utilization of each counter. In this example Average utilization of the meal counter is 99.92%. This implies that ideal time of the meal counter is very less. Similarly average utilization of the cash counter is 96.35 %. This implies that when compare to the meal and sandwich ideal time of cash counter is more. It also contains Average Time/Trans, Average Content, Number of Entries (also called Total Entries), Current Content, Maximum Content Label (Discussed Earlier). Entries Label includes total entry. |
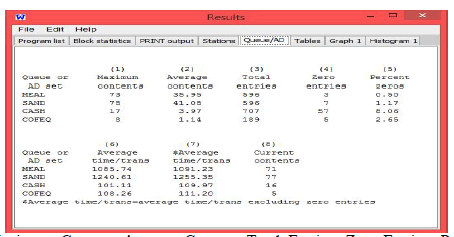 |
| Queue/AD Includes Maximum Content, Average Content ,Total Entries, Zero Entries, Percent Zeroes, Average Time/Trans,$Average Time/Trans, Currents content label which gives the information with respect to the queue. |
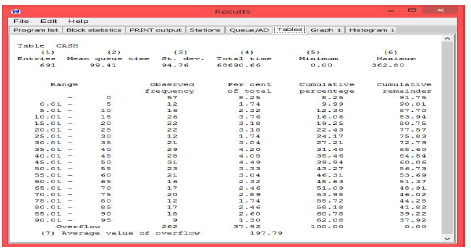 |
| Table field in the output contains the Entries, Mean queue time (i.e. Average time spent in the queue), Standard Deviation, Total Time, Minimum, Maximum Label. |
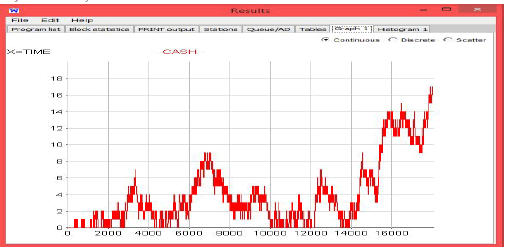 |
| Graph indicates the number of customers at particular time entering in to the cash counter. This information can used by the owner of the cafeteria in the decision making regarding the space and service provisions |
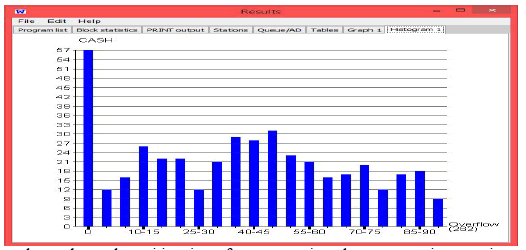 |
| The graph at a glance lets us know the waiting time of a customer in order to get service at various counters. Here this depicts the waiting time of customers at the cash counter. This implies that around 57 customers are waiting for 0 minutes in the cash counter. Around 26 customers are waiting for 10-5 minutes. 12 customers are waiting for 25-30 minutes. Around 28 customers are waiting for 40-45 minutes and so on. This will help the owner of the cafeteria to reduce the waiting time of the customer either by increasing number of cashier or by finding some alternative method. |
III. CONCLUSION |
| WebGPSS is a simple tool that can be used by a common person to study the system in existence or a completely new system. It gives us a bird’s eye view of every detail of the study under study. The best use of using webGPSS is to study the ‘what if’ and ‘wait and see’ scenarios which in reality would be highly costly. There many more blocks that can be used to make the study more informative. Our further aim is to make use of the remaining blocks and study how they can be used to improve the analysis of the system under study |
References |
|