Research & Reviews: Research Journal of Biology
ISSN: 2322-0066
ISSN: 2322-0066
Department of Environmental and Natural Resources, Presbyterian University College, Ghana, P. O. Box 393, Akropong-Akuapem, Ghana
Received: 10/02/2014 Accepted: 27/02/2014 Published: 15/03/2014
Visit for more related articles at Research & Reviews: Research Journal of Biology
Successful forest regeneration is critical for the sustainable management of natural forests. This study assessed natural regeneration capacity of a logged tropical forest by comparing the species composition, diversity, density and basal area at varied levels of disturbance after logging operations. The regeneration capacities of trees were analysed at three levels of disturbances: heavily disturbed, partially disturbed and undisturbed in the Asenanyo Forest Reserve in moist forest reserve in Africa. Sixty sampled plots of 25m by 25m were equally distributed randomly in each of the stratified areas. A significant difference in abundance of naturally regenerated tree species in the partially disturbed, undisturbed areas and heavily disturbed areas was observed. The density of naturally regenerated tree species in the slightly disturbed was higher than the undisturbed areas while the later recorded higher density than heavily disturbed areas. The diversity of naturally regenerated trees in the undisturbed area differed from the slightly disturbed area and heavily disturbed area while slightly disturbed and heavily disturbed areas also differed. The high density of young trees in the slightly disturbed area might be enhanced by providing conditions that promote seed germination than the undisturbed areas. However, the activities of the logging might have also destroyed seeds and cause soil compaction which might have accounted for the less number of trees as well as diversity in the heavily disturbed area. It was concluded that natural regeneration are most favored when induced slightly. It is therefore recommended that there should be a limit to the total number of trees felled in a compartment as well as the size of loading bays and the width of forest roads.
Diversity, forest disturbances, forest regeneration, forest reserve, logging.
Tropical forests are subject to a wide range of disturbances of variable duration, intensity, and frequency. In their review of major disturbances in tropical rain forests, Whitmore and Burslem (1998) emphasized the pervasive nature of both natural and human disturbances in tropical forests. They suggested that contemporary human activity affecting tropical forests should be viewed in the context of the panoply of natural disturbance events and the dynamism that characterizes tropical forest systems. In 2000, an estimated 60% of the world’s tropical forest was classified as degraded forest, including secondary forests, degraded primary forests and degraded forest land (ITTO, 2002).
Post-logging disturbance regeneration and associated variation in rainforest ecosystems is complex, which involve a variety of responses including species progressive replacement sequences (Hopkins, 1992; Sheil, 2001). Models for species succession and the underlying processes that involve changes in biomass, species diversity and homeostasis are well documented (Odum, 1970; Connell and Slatyer, 1977; Brokaw and Busing, 2000).
Accurate descriptions of long term chronological changes in rainforest ecosystems following both natural and anthropogenic disturbances can increase our understanding of how these systems respond to various disturbances (Sheil, 2001).
The concept of 'direct regeneration' after disturbance to ecosystems (Boucher, 1990; Vandermeer et al., 1990; Yih et al., 1991), in contrast to classical models of succession, suggests that those species dominant in the first years after the disturbance will be the same as the species which were dominant before the disturbance. The first notions of sustainable tropical forest management were directed towards maintaining the timber yields of valuable timber species. This led to the establishment of the first silvicultural research plots in several countries with tropical rainforests by the beginning of the twentieth century (Lamprecht, 1989; Dawkins and Philip, 1998; Bertauld and Kadir, 1998; Chazdon and Whitmore, 2002). The research focused mainly on identifying means to enhance the growth of commercial tree species while suppressing the unmerchantable species (Lamprecht 1989, Dawkins and Philip 1998). With increasing environmental awareness, forest managers came to understand that there are many other valuable services provided by forests in addition to timber production that must also be taken into consideration. Climate change has been embraced and measures are being taken to adapt in all aspects of its consequences.
The atmosphere delivers both resources such as rain, sun, wind and hazards such as hurricanes, blizzards, droughts; to ecosystems and societies. Through autonomous and/or planned adaptation, species and individuals, ecosystems and societies, are fashioned to a considerable extent by these climatic constraints. Ecosystems and our human cultures and economies are ‘tuned’ to the climate in which they evolve (Green et. al., 2003).
The major concern has been that the globe is undergoing climate change at unprecedented rates and the real situation is that temperatures are rising and the global weather patterns are changing. Patterns of seasonality and the intensity and frequency of more extreme events, such as hurricanes and droughts are being altered. There has been a 10% increase in atmospheric CO2 concentration over the past four decades and the mean global temperature has increased by about 0.5° Cover the same period and the temperature in tropical rainforest regions are projected to increase between 2° and 5° by the end of 21st century (Malhi and Wright, 2004). Rainfall projections are less certain and more variable geographically, yet probably most crucial for anticipating climate change impact on rain forests. Patterns of regional landuse affect the changes in atmospheric conditions and climate. For instance atmospheric contribution of nitrogen inputs from atmospheric deposition of nitrogen has increased within tropical regions and its impact on growth is complicated and remains uncertain (Ghazoul and Sheil, 2010).
In Ghana, between 10-25% of the total area of Ghana’s managed forests is affected by logging roads and tracks, some of which are characterized by soil erosion and poor plant regeneration (Hawthorne and Abu-Juam, 1993). In his work on post-logging regeneration study in the Bia South Game Production reserve, Hawthorne (1993) observed that gap size influences the extent and type of regeneration of forest tree seedlings. Yet he noted that logging operations showed few signs of having any adverse effect on regeneration in that reserve.
The goal of this study was to investigate whether the removal of tree species would be replaced naturally by the same or different species as timber or would be the balance of species likely to be upset by logging. It further examined the tree species composition of the various levels of disturbances after logging and assessed the various tree species composition of the natural regeneration after exploitation. The purpose was to determine the natural regenerative capacity of tree plants in the various levels of disturbance forest after exploitation in the era of climate change. This will help influence the management decisions on regeneration operations such as whether to embark on expensive artificial plantations or to embark on cheaper and sustainable natural regeneration option.
The following were the objectives of the study: (1) to determine the natural regeneration capacity of tree species after exploitation, (2) to examine the tree species composition of the various levels of disturbances after logging, and (3) to assess the status of various tree species composition of the natural regeneration after exploitation.
The study was conducted in the Asenenyo River Forest Reserve which can be found in the Nkawie Forest District of the Ashanti Region (Ghana); located on between Latitude 6°17’ -6°36’N and Longitude 2° 03’-2° 16’ W. It is wholly owned by the Golden stool but under caretaker stools or Chiefs of Nkwaie-kuma, Nkawie-Panin, Nyinahin, Domi-Kwamiago, MansoNkwanta and Akwamu. It covers an area of about 228.0 km2 or 22,800 hectares and a perimeter of 100.26 km. The vegetation type of Asenanyo River Forest Reserve is the Moist Semi Deciduous North West subtype and plant association of the Celtis –Triplochiton. According to Forest Services Division (2010), it was constituted as Forest Reserve in the year 1940 and currently it is under Forest Management Unit (FMU) 37 of The Forest Management Unit categories. The dominant flora species were Celtis mildbraedii (Esa), Triplochiton scleroxylon (Wawa), Entandrophragma spp. and Thaumatococus spp. (Aworomoo) and that of the fauna were Tragelaphus scriptus (Owansane), Tropicranus albocristatus (White-crested hornbill) and Dendropicos gabonensis (Abobonua).
Asenanyo river forest reserve has a low lying terrain with few hilly outcrops notable amongst these hills is the Sumtwitwi Range. It is also drained by the Asenanyo River from which the forest reserve derived its name. It has an average height of about 152.40m to 182.88m above sea level (Figure 1). It has twenty (20) admitted farms and one settlement namely Akotaa town ship which covers an area of about 955.70 hectares. Asenayo River Forest Reserve has seven (7) main management categories namely Swamp Sanctuaries, Hill Sanctuaries, Convalescence, Research, Plantation, Timber Production and Admitted farms. The management prescriptions for these management categories include pillaring and conservation of flora and fauna, protection of high elevations, protection of areas for regeneration and biodiversity areas, evaluation of Tropical Shelterwood system, area to be converted into plantations, growth potential of Teak as well as extraction of timber and non-timber forest products. The major threats are illegal logging, charcoal production, illegal harvesting of NTFPS, encroachment due to land and farming pressure, surface mining, sand winning and hunting. The reserve lies within the tropical humid climatic zone and is characterized by two peak seasons with rainfall from April to October and the mild harmattan from November to March. The isohyethal map of Ghana shows that the area is lying between 150 and 163 cm isohyets. At Bibiani, the nearest meteorological station, the mean maximum temperature is 86.90F and the minimum 71.00F. The relative humidity recorded at Bibiani for 0900 hours are uniformly high with the yearly mean in the region of 84%. In harmattan the prevailing wind is north-easterly and predominantly south-westerly in the raining season. (Forest Service Division, 2010).

Figure 1: Map of Asenanyo Forest Reserve showing its location in Ghana.
The area was stratified according to the disturbance intensity through logging history of the reserve based on available information. An area that has not been exploited in the past 20 years was used as a standard or any twilight zone nearby for comparison. Quadrants of measurement 25.0m by 25.0m were set in the disturbed, partially disturbed and undisturbed sites (table 1). In each plot, all species were identified, heights estimated and diameter measured at breast height of 1.3m from the ground level.

Table 1: Categories of logging disturbance areas in the forest
In this regeneration sampling all individual tree species older than germinating seeds but less that 10cm dbh were measured. Most of the unlogged forest that has not been affected by recent tree fall gaps patches of forest without such natural canopy disruptions was taken as the main control sample with an additional smaller area of natural tree fall which is more often than not referred to as Chablis.
Plots from the same area of forest which have undergone similar treatments were grouped into blocks. A block was a series of plots that were laid for instance on the same road or in the same area of forest with similar treatments. In each category, the plots were arranged in blocks in different ways as described as follows:
a. Roads and Borders: These are the main graded and often gravelled roads providing access for logging up to the loading stations. Plots were laid across the road at every 200.0 meters interval except in marshy areas.
b. Skid Trails: These are narrow trails meandering from felled tree gaps to loading stations. Plots were laid as in the access road but without any road margin component.
c. Felled Tree Gaps: These are small areas where only a few timber species have been felled. Plots were laid here.
d. Loading Bays: These are large cleared sites which are usually rectangular in shape and is about 1.0ha often near felling sites where logs are extracted from the forest are sorted and stored awaiting collection by lorries. Two plots were be laid in the North-South or East West directions.
e. Chablis: These are gaps created as a result of fallen of trees naturally.
f. Undisturbed and Unlogged Forest Areas: This include twilight zones sample but well away from logged areas.
g. Twilight Zone: This is a matured forest, mostly adjacent to natural or logged gaps, which has not been affected by logging or any other recent disturbances. It also implies undisturbed forest emphasize that even these areas are partly illuminated.
In this study all disturbed areas such as roads and borders, Skid trails, Felled tree gaps, loading bays and chabis were given a similar treatment and so do the undisturbed areas such as unlogged forest areas and twilight zone. All these categories of disturbances associated with logging operations have been grouped together as shown in table 1. Plots were laid at very 100.0 meters away to all directions.
The instruments used include Global Position System (G.P.S.) machines, Compass, Linen tapes, Ribbons, Diameter tapes, Data collection sheets, Pencil, Pen and Cutlasses.
In all quadrants, trees were identified by the researcher with reference to a field guide. Diameters of all trees between 5cm to 10cm were measured over-bark at breast height (1.3m) with a girth tape and later converted to diameter by a formula:
D=c/Φwhere ‘D’ =diameter of the tree, ‘C’ =girth of the tree.
The 1.3m has been set as a standard point of measurement, however, there were some reasons to deviate and execute the diameter measurements at another position on the sample tree. These were as follows:
(1)Trees with aerial or stilt roots up to 1.3m, measurements were taken at 10cm above the point of convergence of the root.
(2) Forked trees were regarded as two trees if the fork is below the 1.3m
(3) Forked trees were regarded as only one tree if the fork is above the 1.3m.

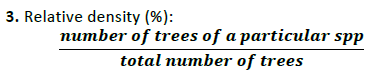
2. Abundance = number of occurrence of a particular species in a particular disturbance type
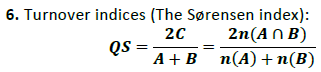
Where, ‘A’ and ‘B’ are the number of species in samples A and B, respectively; ‘C’ is the number of species shared by the two samples; ‘QS’ is the quotient of similarity and ranges from 0 - 1. This expression is easily extended to abundance instead of presence/absence of species after Sörensen (1948).

All these calculations were done using PAST, a Paleontological Statistics software.
8. Star ratings of species: All Species were classified into conservation star ratings following Hawthorne and Abu-Juam (1995); Hawthorne and Ntim-Gyakari (2006) and the ratings were as follows:
Black star species: Globally rare and high priorities for careful management
Gold star species: Globally restricted
Blue star species: Some rarity value in Ghana
Scarlet star species: Threatened, in Ghana at least, by over-exploitation
Red star species: Heavily exploited in Ghana
Pink star species: Some commercial interest
Green star species: Little conservation concerned
In all a total of 1.2 ha in each forest disturbance category were enumerated. It was found that the mean number of trees were 86.6 (SD= 1.30, N=20) per ha in the heavily disturbed area (Figure 3). In the slightly disturbed area (Figure 4), the mean number of regenerated trees were 152.6 (SD= 3.35, N=20) per ha while in the undisturbed area the mean number of trees per ha was found to be 139.2 (SD=2.49, N=20) (Figure 2).The number of trees in the three levels of disturbances differ significantly from each other (H=19.42, p<0.001), hence Kolmogorov-Smirnov test was further used to test the differences between the number of trees between any two areas. The difference between the number of trees in heavily disturbed and slightly disturbed areas was significant (D =0.32, p<0.02) as well as the heavily disturbed and the undisturbed area (D=0.54, p<0.001). On the contrary, the number of natural regenerated trees in the slightly disturbed area did not differ from number of trees at undisturbed sites (D=0.22, p>0.05). It has been observed that changes in the composition, density and diversity of forest tree species have been influenced by the changes in the type and intensity of forest disturbance (Ward and Worthley, Undated; Swaine et al., 1998). Thus the changes in the number of trees between the two types of disturbed areas can be attributed to the differences in the intensities of the disturbances (heavily and slightly disturbed areas) as shown in Figures 3 and 4, respectively.

Figure 2: Mean number of trees per ha of naturally regenerated trees enumerated in various categories of disturbances in Asenanyo Forest reserve.

Figure 3: Heavily degraded area; (a) timber transport road, (b) a caterpillar machine in the process of constructing timber-transport road.

Figure 4: Slightly disturbed forest; (a) stump site where log was felled, (b) skidding track.
A similar case was registered in Kibale national forest, where unlogged and lightly logged areas did not differ from one another in tree densities but both had significantly higher densities than the heavily logged areas (Skorupa, 1986; Skorupa and Kasenene, 1984). Many individual trees were found in the slightly disturbed area than both the undisturbed and heavily disturbed area. In Bia resource reserve Hawthorne (1993) also concluded that the population of valuable species in the twilight zone was of an ultimately light demanding nature, the only way in which it will become expressed in a future matured canopy is through minor disturbances- opening the canopy without actually unseating the desirable seedlings. This further draws attention to the distinction between the natural and artificial disturbances, where the former does destroy the seeds, but somehow create enabling environment for germination and emerging of the disturbed existing seedlings; the latter however has the tendency to destroy the seed bank, remove the good substrate, compact the soil and even increase the radiation required for certain desirable tree species (Figure 3a & b). Since tree species have adapted to regenerate successfully after harvesting and under certain disturbance regimes, tree harvesting methods are often designed to mimic certain natural disturbances (Figure 5a & b).

Figure 5: Regenerated areas; (a) regenerated timber road, (b) regenerated skidding trail area.
Shannon-Wiener index of diversity of trees was calculated for the enumerated trees in the three categories of forest disturbances and the details have been presented in Table 2. Diversity t test indicated a significant difference between the diversities of trees in heavily disturbed area and the slightly disturbed area (t=-3.51, p<0.001), as well as undisturbed areas (t=6.35, p<0.001). Moreover, the diversity of trees in the slightly disturbed area also differed from the undisturbed area (t=-3.17, p<0.001). It could be deduced that the diversity of trees reduced as the disturbance intensity increased.

Table 2: Diversity indices of trees in the heavily disturbed, slightly disturbed and undisturbed areas.
In the heavily disturbed area, the species that have thrived here were the species which could be described as light loving pioneer trees that can grow well in opened space. Logging damage has been found by other studies to be correlated with the intensity of the harvesting and its associated activities. In two moist forests of Ghana (Bura and Draw River Forests Reserves) Agyemang et al. (1995) noted a total number of trees damaged due to haulage road and skid trail constructions were higher than that of felling timber trees. This may be due to maximizing profit from timber operation i.e., the use of inefficient machinery and abuse of logging regulations. The slightly disturbances do widen the gaps which tends to increase the radiation that may be favorable microclimate to stimulate the growth and regeneration of tree species (Chazdon, 1988). The contrary is what happens in the undisturbed forest areas where the less damage caused to the seeds and the sizes of canopy seldom change (there are limitations to the conditions that favor germination). Therefore, a higher diversity prevailed in the undisturbed area than the other areas.
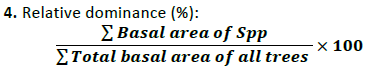
Tables 3, 4 and 5 show the details of species composition, abundance, basal area, relative dominance and relative densities of heavily disturbed (Figure 3), slightly disturbed (Figure 4) and undisturbed areas respectively of regenerated trees in the logged forest. Comparing the basal areas of regenerated trees found in the three levels of disturbed regenerated areas, the difference was found to be highly significant (H=15.14, p<0.001). The basal area of trees in the highly degraded area was found to differ from the basal area of trees in slightly disturbed area (D=0.34, p<0.05) as well as the undisturbed area (D=0.56, p<0.001), however the basal area of species in slightly disturbed and undisturbed areas did not differ significantly (D=0.29, p>0.05).
In the heavily disturbed area, the relatively dominant trees include Trema orientalis (21.4%), Celtis mildbraedii (16.5%), Nesorgodonia papaverifera (11.1%), Triplochiton scleroxylon (10.4%) and Solanum erianthum (8.7) and others presented in Table 3. But in the slightly disturbed area the most relatively dominant tree species were Triplochiton scleroxylon (17.6%), Celtis mildbraedii (16.8%), Nesogordonia papaverifera (9.4%) and others presented in Table 4. Moreover, in the undisturbed area apart from Triplochiton scleroxylon and Celtis mildbraedii that were 12.4% and 9.8% relatively dominance in the community respectively; all the remaining trees have relative dominance below 5.3% as shown in Table 5.

Table 3: Species composition, abundance, basal area, relative density and density of heavily disturbed areas of Asenanyo forest.

Table 4: Species composition, abundance, basal area, relative density and density of slightly disturbed areas of Asenanyo forest.

Table 5: Species composition, abundance, basal area, relative density and density of undisturbed areas of Asenanyo forest.
Furthermore, in the heavily disturbed area Trema orientalis, Celtis mildbraedii, Nesorgodonia papaverifera and Triplochiton scleroxylon were found to be relatively dense representing 22.0%, 19.5%, 13.4 % and 12.2% respectively. In the slightly disturbed areas species with high relative density include Triplochiton scleroxylon (15.1%), Celtis mildbraedii (21.4%), Nesogordonia papaverifera (8.2%) while in the undisturbed areas the species with high relative density were Triplochiton scleroxylon (10.4%) and Celtis mildbraedii (11.8%) with Nesogordonia papaverifera and Sterculia rhinopetala representing 6.3% respectively.
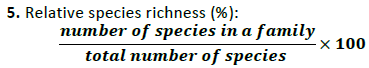
Relative species richness is a measure of the importance or contribution of any particular family to the biodiversity in the site. It is a good measure for assessing the family which contributes a lot to the biodiversity in a site than others. In this study it was found that Sterculiaceae, Ulmaceae, Moraceae, Apocynaceae and Bombacaceae contributed a lot of species to the heavily degraded sites than the slightly and heavily disturbed areas. But only one family, Myristicaceae, was found only in the heavily disturbed area without its presence in the other two areas (Figure 3).
Moreover, Cercropiaceae, Combretaceae, Lecythidaceae, Pandaceae, Rubiaceae and Simaroubaceae were found to contribute higher to regenerated tree species in the slightly disturbed area (Figure 4) than both the heavily disturbed and undisturbed area. Ebenaceae and Icacinaceae were found only in the heavily disturbed area.
At the undisturbed area, however, Euphorbiaceae, Meliaceae and Leguminosae were found to have contributed higher than the slightly disturbed and heavily disturbed areas. Annonaceae, Sapindaceae and Sapotaceae were found at contributed to the undisturbed forest alone. Figure 6 shows the percentage representations of family contributions to species recorded in the three stratified areas.

Figure 6: Number of species contributed by each family to the various categories of forest disturbances.
Table 3, 4, and 5 further present the star ratings of individual trees regenerated in the heavily disturbed, slightly disturbed and undisturbed area after logging. Green star species were found to be higher among other trees regenerated in all the three areas. The percentage was higher in the slightly disturbed area (50.0%), 48.8% in undisturbed area and 36.6% in the heavily disturbed area. The pink star species featured higher in the heavily disturbed areas than slightly disturbed (25.0%) and undisturbed areas (26.6%). The red star species featured more in the undisturbed areas
(12.2%), than heavily disturbed (10.5%) and undisturbed areas (9.4%).The scarlet star species were more in the heavily disturbed area (21.1%), 15.6% in slightly disturbed area and undisturbed 9.8% while the blue star species were recorded in the undisturbed areas only (2.4%). Harvesting trees for forest products constitutes disturbance in the forest of an artificial or manmade nature, and according to Ward and Worthley (Undated) “when a harvest is planned, the person who chooses the trees to be harvested has control over which trees are cut and which trees are left. The success of regeneration and the future condition of the forest is affected more by what is left than by what is harvested from a stand”. This indicates that the regenerated trees depended on the trees that were left un-harvested during the harvesting period.
Table 6 shows the details of Sörensen Indices of regenerated trees between any of the two categories of degraded sites compared to the undegraded site. Turn-Over Indices indicated that 47% of the species in heavily disturbed areas were also found in slightly disturbed areas. Between the heavily and slightly disturbed areas, 33% of common species were found between them while 55% of commonly regenerated trees were also found between slightly disturbed and undisturbed areas. These indicate the resilience capacity of rainforest which is a function of other factors such as the climate, size of gap, shape of gap, orientation of the gap to the sun, height and species composition of surrounding vegetation, saplings and poles present at site when gap was formed, extent of damage to vegetation upon formation of gap, impact of fauna subsequent to gap formation, composition of mycorrhizal community, seed bank at time of gap formation, seed rain subsequent to gap formation as well as the topography and soil type; could be considered to be important in shaping regeneration of rainforest gaps (Denslow, 1987; Clark, 1994; Denslow and Hartshorn, 1994; Strusaker, 1997).

Table 6: Turn-over Indices of regenerated trees enumerated in heavily, slightly and undisturbed forest.
The study purposed to evaluate the regeneration capacity of different types of disturbance regimes of forest after logging. It was revealed that there was some increase in mean natural regeneration tree species in the slightly disturbed and undisturbed areas as compared to the heavily disturbed areas. The study found statistical difference in abundance of natural regenerated tree species in the partially disturbed, undisturbed areas and heavily disturbed areas. Firstly, greater trend of increase in population of natural regeneration was enhanced in the slightly disturbed areas than the undisturbed areas. The populations of natural regenerated tree species might have been enhanced by improving conditions necessary for germination, such as light penetration, moisture and seed intensity; that might favour certain particular species to regenerate more than others. Secondly, the destruction to the existing seedlings were not so severe to cause lethal effects on the seedlings, therefore, they recovered soon after the timber operation.
On the other hand, the diversity of the regenerated trees was higher in the undisturbed area than the heavily and slightly disturbed areas because there has not been any change resulted from anthropogenic origin to the area. The regeneration capacity of the heavily disturbed area was very poor in terms of both abundance and diversity which might probably be attributed to the high intensity of destruction made to existing vegetation, excavation of top soil and compaction of the of the soil surface.
The common species shared between any of the two sites were encouraging and indicate high resilience capacity of the forest. None of the trees enumerated was of global importance i.e. neither a black nor gold star species. Blue star species were found in the undisturbed areas only but neither in any of the disturbed areas. However, scarlet, red, pink and green star species were found distributed proportionally across the various levels of disturbances.
The general impression has been that after disturbance, rather than being replaced by an early successional community dominated by pioneer species which are rare or absent in primary forest, it was deduced that under this direct regeneration, the specific composition of the community remains relatively unchanged, even if the disturbance caused heavy damage.
It is therefore recommended that the population of tree species that naturally regenerated can be improved by making good use of the pattern of exploitation and thereby enhancing or enriching the forest of the future generations. There should be a limit on the total number of trees felled in a compartment as well as the size of loading bays and the width of forest roads. This will help to minimize the degree of disturbance in a forest. Temporal tree nurseries must be established in the forest where logging would take place, so that the seedlings would be used to enrich the heavily degraded areas. This would help to encourage early growth of local and valuable forest tree species during the logging period.
Moreover, during logging planning the planners should focus on the trees to replace the harvested ones than only on the trees that are to be removed.
Author is very much thankful to Presbyterian University College (Ghana) for fund sponsoring this research work, the Manager and staff of Nkawie Forest District for their permission. Author is also indebted to Mr. Albert Kyere-Diabour for his assistance during data collection and Prof. F.S. Arku for his advice and encouragement.
https://bluecruiseturkey.co
https://bestbluecruises.com
https://marmarisboatcharter.com
https://bodrumboatcharter.com
https://fethiyeboatcharter.com
https://gocekboatcharter.com
https://ssplusyachting.com