Research & Reviews: Journal of Agriculture and Allied Sciences
ISSN: E 2347-226X, P 2319-9857
ISSN: E 2347-226X, P 2319-9857
Sadiq MS1,2*, Singh IP1, Singh NK1, Sharma Madu1 and Eije OC2
1Department of Agricultural Economics, SKRAU, Bikaner, India
2Department of Agricultural Economics, FUT, Minna, Nigeria
Received Date: 30/11/2017; Accepted Date: 12/01/2018; Published Date: 20/01/2018
Visit for more related articles at Research & Reviews: Journal of Agriculture and Allied Sciences
The present research empirically measured the TFP of yam farmers with the aim of unearthing the factors affecting yam farmers in exploring the untapped potentials in yam production in the studied area. The study used structured questionnaire complemented with interview schedule to collect cross-sectional data of 2016 cropping season from 120 yam farmers selected via multi-stage sampling technique. Both descriptive and inferential statistics were used to analyse the collected data. Findings showed that majority (80%) of the farmers did not achieve a robust increase in output index in the studied area owing to inefficiency in utilization of productive resources. Based on these findings, the study recommended formulation of supportive policies by government and non-governmental agencies targeting welfare improvement of the poor farmers cultivating yam crop in the studied area.
TFP; Yam production; Farmers; Benue State; Nigeria
Over the past 50 years, yam production in Nigeria has shown a tremendous improvement from 3.2 million tonnes per annum in 1960 to 26.2 million tonnes in 2000 and to 45 million tonnes in 2014 [1]. Similarly, the area under yam cultivation has increased from 1.3 million hectares in 1960 to 2.6 million hectares in 2000 and to 5.4 million hectares in 2014. This trend of increase in output at the expense of area rather than productivity has become a source of concern to policymakers’ over time.
IITA [2] reported that yam production is declining in some traditional producing areas due to declining soil fertility, increasing pest pressures and the high cost of labour, and they advocated that smallholders need access to innovations to reduce labour and improve productivity.
Numerous agricultural policies and programmes both at national and state levels were developed to support and stimulate agricultural growth in the face of low and declining yield of crops. Notable in the subject of this research are Root and Tuber Crops Extension Programme in 2003, National Root Crops Research Institute (NRCRI), International Institute of Tropical Agriculture (IITA) for research on improved yam seed technology, credit policy through Bank of Agriculture and Agricultural Credit Guarantee Scheme Fund (ACGSF), National Special Programme for Food Security Programme (NSPFS), Fadama World Bank Project, ADPs and other interventions. Moreover, efforts to increase yield through these programmes proved abortive especially with the persistent scarcity and high cost of seed yam, on-farm harvest and post-harvest losses and high labour demand for production.
Despite the remarkable lead of Nigeria in the production of yam, Nigerian yam farmers still suffer from poverty and this could owe to inefficient use of available resources. Studies have shown that 60% of Nigerian farmers produce yam as a primary source of livelihood [3]. This is the major problem of the present-day agriculture because issues surrounding efficiency of farm productive resource utilization are the vital elements of sustainable crop production of small-scale farming activities. Inefficient use of inputs can seriously jeopardize and interfere with production and food security. If more attention is given to the efficient use of resources, improving farming system and technology through proper and adequate extension service delivery, farmers’ incomes are likely to increase which will definitely lead to positive change in their standard of living. Therefore, in the light of the foregoing issues, it becomes pertinent to examine TFP of yam farmers especially at the subsistence level because they accounted for the bulk production and yam production in the country has added a new fold-export dimension. The total factor productivity (TFP), as a measure of overall productivity, has gained recognition not only for its theoretical correctness but also for its peculiarity among policymakers and economic analyst. It is against this background that the study ought to verify the dynamism of total factor productivity of yam production because productivity is considered as a contributing factor to the economic growth of a nation.
The specific objectives of this study were to describe the socio-economic profile of the respondents; estimate profitability of yam production in the studied area; measure the TFP of the respondents in the studied area; determine the factors that influenced TFP of yam farmers in the studied area; and, identify and determine the barriers to yam production in the studied area.
The study area is located in the North central part of Nigeria with an estimated total population of 4,780,389 [4]. The state is located between latitude 6°25∪N and 8°8∪N and longitude 7°47∪E and 10°0∪ E Greenwich meridian. The state has an estimated landmass of 5.09 million hectares out of which about 3.8 million hectares are arable. The state has a tropical climate and is situated in the southern guinea savannah with about 1723mm of rainfall annually and an average temperature of 27.2°C. Agriculture is the major occupation of the natives with over 70% of the populace engaged mostly in arable crop farming while others engaged in occupations such as fishing, cloth weaving, white collar jobs, businesses, arts and crafts, Ayurvedic medicine among others.
The multi-stage sampling design was used to collect cross-sectional data from 120 selected active yam farmers in the studied area. The first stage involved convenient selection of Otukpo Local Government Area in Benue State due to cost and time constraint of the researchers given that yam is produced in all the agricultural zones in the state. The second stage involved random selection of four (4) villages viz. Upu-Entekpa, Otada, Okpanehe and Ogodumu villages. The last stage involved random selection of thirty (30) active yam producers from each of the selected villages, thus giving a total sampling size of one hundred and twenty (120) farmers. Well-structured questionnaire complemented with interview schedule was the instrument used for data collection. The content validity of the questionnaire was pre-tested in a pilot survey composed of 20 farmers and the result of the reliability tested gave a Cronbach’ Alpha coefficient higher than 0.60 cut-off suggested by Churchill [5] to be appropriate for exploratory research. Therefore, the estimated value indicates the stability and consistency with which the questionnaire measures the concept and help in assessing the goodness of the measure. With the aid of block extension agents, ex-post data for 2016 yam cropping season were collected during the years 2016/2017.
The collected data were analyzed using descriptive, pseudo-inferential and inferential statistics. Objective I and part of objective VI were analyzed using descriptive statistics; objective II was analyzed using cost concepts and income measures adopted by Subba et al. [6], Meena et al. [7], Sadiq and Samuel [8] and Sadiq et al. [9]; objective III was analyzed using TFP index; objective IV was analyzed using Generalized linear model (GLM): Tobit regression model; and, Kendal coefficient of concordance (KCC), Friedman’s Chi2 statistic and factor analysis were used to analyze part of objective V.
Model specification
Cost concepts and income measures: Cost concepts and income measures are widely used because of their relevance in the decision-making process. This means that these costs serve as a basis to expand the size of the farm, to buy the requisite capital assets in the long run and the requisite inputs in the short run. The study adopted the cost concepts used by Subba et al., [6,10] and are specified below:
Cost concepts: Costs related to paddy rice production are split up into various cost concepts such as A1, A2, B, C and D
Opportunity/Implicit cost: costs of self-owned and self-employed resource i.e. imputed cost
Accounting/Explicit cost: costs for purchasing and hiring of inputs and input services i.e. paid out costs/cash costs/ nominal/ money cost
Economic cost: Opportunity cost + Accounting cost
Cost A1: The following items are included in Cost A1
Wages of hired labour
Charges of hired machinery
Market rate of fertilizers
Market rate of seeds
Market value of biocides
Land revenue, cess and other tax
Depreciation of farm implements
Interest on working capital
Miscellaneous expenses
Cost A2: Cost A1 + rent paid for lease-in land
Cost B: Cost A1 or A2 + interest on fixed capital excluding land + rental value of owned land
Cost C: Cost B + imputed value of family labour
Cost D: Cost C + 10% of Cost C as management cost [7]
Income measures: These are the returns over different cost concepts. Different income measures are derived using the cost concepts. These measures are given below:
Farm business income = Gross income – Cost A1 or A2 (1)
Family labour income = Gross income – Cost B (2)
Net income = Gross income – Cost D (3)
Farm investment income = Farm business income – Imputed value of family labour – Imputed management cost (OR) Net income + Imputed rental value of owned land
 (4)
(4)
 (5)
(5)
Total factor productivity index: The productivity of a single-output-single-input firm is almost always defined as the outputinput ratio. O'Donnell [11] generalizes this idea to the multiple-output multiple-input case by formally defining the total factor productivity (TFP) of a firm to be the ratio of an aggregate output to an aggregate input. Let xit = (x1it ,………., xkit)′ and qit = (q1it ,………., qkit)′ denote the input and output quantity vectors of firm i in period t. Then the TFP of the firm is:
 (6)(Total Factor Productivity)
Where, Qit = Q(qit) is an aggregate output, Xit = X(xit) is an aggregate input, and Q(.) and X(.) are nonnegative, non-decreasing and linearly homogeneous aggregator functions. The associated index number that measures the TFP of ith firm in period t relative to the TFP of firm h in period s is:
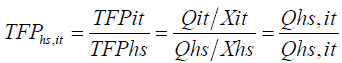 (7)(TFP index)
Where Qhs,it = Qit/Qhs is an output quantity index and Xhs,it = Xit/Xhs, is an input quantity index.
Tobit model: The original Tobit model developed by James Tobin a Nobel laureate economist [12] was adopted for this study and it is given below:
Yi* = α + Xβ + εi (8)
Where Yi* is observable variable. Now
Yi = 0 if Yi* ≤ 0
= Yi* if Yi* > 0
Yi* = α + X1β1 + X2β2 + X3β3 + X4β4 + X5β5 + X6β6 + X7β7 + X8β8 + X9β9 + X10β10 + X11β11 + X12β12 + X13β13+ εi (9)
Where:
Yi* = TFP index of ith farmer
X1 = Age (year)
X2 = Gender (male =1, female = 0)
X3 = Marital status (married =1, otherwise = 0)
X4 = Educational level (educated = 1, otherwise = 0)
X5 = Household size (number)
X6 = Farming Experience (year)
X7 = Operational holding (hectare)
X8 = Yam sett variety (improved variety = 1, otherwise = 0)
X9 = Non-farm activity (yes =1, otherwise = 0)
X10 = Co-operative membership (yes = 1, otherwise = 0)
X11 = Access to credit (yes =1, otherwise = 0)
X12 = Extension contact (yes = 1, otherwise = 0)
X13 = Land ownership (yes =1, otherwise = 0)
α = Intercept
Β1-13 = Coefficients
εi = Error term
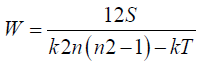
Kendall’s Coefficient of Concordance (W): Kendall’s coefficient of concordance (KCC) (W) proposed by Maurice G. Kendall and Bernard Babington-Smith is a measure of agreement among several ‘m’ variables that are assessing a set of ‘n’ objects of interest. KCC (W) uses the χ2 statistic for testing. If the test statistic is 1, then all the survey respondents have been unanimous, if W is 0, then there is no overall trend of agreement among the respondents and an intermediate value of W indicate a greater or lesser degree of agreement among the various respondents. Following Sadiq et al. [13] the KCC developed by Kendall and Smith [14,15] and Wallis [16] is given below:
 (10)
(10)
Where;
S = Sum over all subjects
k = Number of respondents ranking the attributes or objects
n = Number of attributes or objects that is evaluated by respondents
T = Tie-correction factor
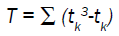 (11)
(11)
‘tk’ is the number of tied ranks in each (k) of g groups of ties. The sum is computed over all groups of ties found in all m variables of the data table. T is 0 when there are no tied values.
The Chi2 (χ2) statistic is given as follow:
χ2 = k (n -1) W (12)
Where;
k = Number of respondents
n = Number of objects or attributes being ranked
W = Kendall’s coefficient of concordance (KCC)
Friedman’s Chi-square Statistic: The Friedman’s Chi-square statistic proposed by Friedman [17] was developed primarily to test the hypothesis that the ratings assigned to subjects under investigation come from the same statistical population. This is an indirect way of evaluating the extent of agreement among raters. Following Friedman [17] the Friedman’s Chi-square statistic is given below:
χ2 r = k (n-1) W (13)
Where; 0
χ2 r = Friedman’s chi2 statistic
k = Number of respondents
n = Number of objects or attributes being ranked
W = Kendall’s coefficient of concordance (KCC)
Average Variance extraction (AVE) and composite reliability (CR): The AVE formula suggested by Hair et al. [18] is given below:
 (14)
(14)
The formula for calculating composite reliability is specified as follow:
 (15)
(15)
Where λ is the standardized factor loadings and δ is indicator measurement error.
Socio-economic profiles of yam farmers in the studied area
The socio-economic profiles of yam farmers in the studied area are presented in (Table 1). A perusal of the table depicted an active, economic and productive yam farming population as evident from the mean age of 50 years coupled with the standard deviation value of 13.44. The implication of having an economically viable farming population would be a sustainable increase in yam production in the study area. This farmers’ category is expected to be more responsive to new agricultural technologies. Rahman et al. [19] stated that farmers’ age may influence adoption in several ways. This finding contradicts Salau et al. [20] who reported that old age (above 60 years) farmers dominated yam farming population in the Kwara State of Nigeria. The male farmers’ population outweighs that of their female counterparts in yam farming in the studied area. This may be connected with the laborious nature of yam production which most females cannot contend with. Similar findings on yam farmers in Kwara State of Nigeria was reported by Salau et al. [20]. The energy demanding activities involved in the production of yam require men who are naturally endowed with enough strength needed for such jobs. This agrees with the submission of Salau et al. [20] who reported that yam production in Kwara State was dominated by the male gender. Married farmers dominated yam farming; an indication of the importance of marital status in agricultural production especially when farm labour supply is limited. In addition, married farmers are at liberty to benefit from the twin economic and social capitals with respect to financial resource pooling and tacit decision making on the allocation of farm resources. The results showed that majority of the farmers’ attained one form of formal education or the other. This implies that the community is a literate farming community; thus, there will be an increase in the productivity due to the responsiveness of the farming community to new agricultural technologies. Education has been reported to have effects on the speed with which new technologies are been diffused and accepted by the farmers [21]. However, this finding is contrary to what Salau et al. [20] discovered in their study on yam production in Kwara State of Nigeria. The mean household size of 9 persons depicts that most of the farmers had large household size, thus given them access to family labour. Large household size is important to yam farmers because it is the main source of unpaid family labour services as yam production is highly labour intensive. Large household size is an asset if most of its members are able-bodied people, otherwise a liability if the majority of the members are weak people. Ajibefun and Abdulkadri [22] reported similar result confirming that the availability of family labour in small-scale farming was greatly influenced by household size and age structure. Also, Ibitoye and Onimisi [23] reported similar finding for yam farmers in Kabba-Bunu Local Government Area of Kogi State.
| Variables | Frequency | Percentage | X ± SD | c2 test statistics |
|---|---|---|---|---|
| Age | ||||
| £ 29 | 9 | 7.5 | 24.92*** | |
| 30-39 | 14 | 11.7 | ||
| 40-49 | 37 | 30.8 | ||
| 50-59 | 34 | 28.3 | ||
| ³ 60 | 26 | 21.7 | ||
| Total | 120 | 100 | 50 ± 13.44 | |
| Gender | ||||
| Male | 38 | 31.7 | 16.13*** | |
| Female | 82 | 68.3 | ||
| Total | 120 | 100 | ||
| Marital status | ||||
| Married | 93 | 8.3 | 105.95*** | |
| Single | 10 | 77.5 | ||
| Widower | 17 | 14.2 | ||
| Total | 120 | 100 | ||
| Educational level | ||||
| Informal | 17 | 14.2 | 13.27*** | |
| Primary | 42 | 20.0 | ||
| Secondary | 37 | 35.0 | ||
| Tertiary | 17 | 30.8 | ||
| Total | 120 | 100 | ||
| Household size | ||||
| £ 3 | 2 | 1.7 | 53.00*** | |
| 4-6 | 23 | 19.2 | ||
| 7-9 | 56 | 46.7 | ||
| ³ 10 | 39 | 32.5 | ||
| Total | 120 | 100 | 9 ± 4.18 | |
| Farming experience | ||||
| £ 3 | 10 | 8.3 | 166.20*** | |
| 4-6 | 13 | 10.8 | ||
| 7-9 | 6 | 5.0 | ||
| ³ 10 | 91 | 75.8 | ||
| Total | 120 | 100 | 21 ± 14.01 | |
| Land acquisition | ||||
| Inheritance | 84 | 70.0 | 606.00*** | |
| Purchase | 1 | 0.8 | ||
| Borrowed | 3 | 2.5 | ||
| Rent | 2 | 1.7 | ||
| Communal land | 1 | 0.8 | ||
| Multiple source | 29 | 24.2 | ||
| Total | 120 | 100 | ||
| Extension contact | ||||
| Yes | - | - | - | |
| No | 120 | 100 | ||
| Total | 120 | 100 | ||
| Co-operative membership | ||||
| Yes | 15 | 12.5 | 67.50*** | |
| No | 105 | 87.5 | ||
| Total | 120 | 100 | ||
| Access to credit | ||||
| Yes | 1 | 0.8 | 116.03*** | |
| No | 119 | 99.2 | ||
| Total | 120 | 100 | ||
| Non-farm activities | ||||
| Yes | 77 | 64.2 | 9.63*** | |
| No | 43 | 35.8 | ||
| Total | 120 | 100 | ||
| Yam sett variety | ||||
| Hybrid | - | - | 45.63*** | |
| Improved | 97 | 80.8 | ||
| Local | 23 | 19.2 | ||
| Total | 120 | 100 | ||
| Agricultural holding | ||||
| Small scale (< 2) | 4 | 3.3 | 82.40*** | |
| Medium scale (< 4) | 32 | 26.7 | ||
| Large scale (≥ 4) | 84 | 70.0 | ||
| Total | 120 | 100 | 7.06 ± 5.53 | |
| Operational holding | ||||
| Small scale (< 2) | 49 | 40.8 | 12.15*** | |
| Medium scale (< 4) | 49 | 40.8 | ||
| Large scale (≥ 4) | 22 | 18.3 | ||
| Total | 120 | 100 | 2.37 ± 1.82 | |
| Labour source | ||||
| Family labour | 22 | 18.3 | 132.75*** | |
| Hired labour | 19 | 15.8 | ||
| Family and hired labour | 72 | 60.0 | ||
| Family and communal | 6 | 5.0 | ||
| Hired and communal | 1 | 0.8 | ||
| Total | 120 | 100 | ||
Source: Field survey, 2017
Table 1. Socio-economic profiles of the yam farmers.
The mean farming experience of 21 years coupled with the standard deviation value of 14.013; indicate widely varied but adequate years of farming experience in yam production among most of the farmers in the study. Based on these findings it can be concluded that most of the farmers in the study area had adequate experience which should enable them to utilize their resources efficiently. The predominant mode of land acquisition in the studied area was through inheritance. This implication is that as household size increases there will be more pressure on land as every adult member of the family would want to have a share of the land. This would lead to fragmentation of land and will discourage large-scale farming, cultivation of cash crops and farm mechanization which will result in low productivity, thus, threatening the yam food security in the study area. It was observed that none of the yam farmers in the studied area received or had any extension contact during the study period i.e. the last cropping season. The implication is that the yam farmers in the studied area during the last cropping season had no access to recent technologies on the best yam practices and this will greatly affect their output level. This is not a good omen given that an effective extension contact is an essential tool for the adoption of modern technologies and effective communication system that encourages increase in the productivity of any agricultural venture. However, a greater percentage of the farmers (87.5%) did not belong to any co-operative association. The implication is that most of the yam farmers in the studied area do not enjoy benefits of having access to credit, market outlets, marketing information and information about new technologies that accrued to co-operatives association by collective pooling of their social capital together for a better expansion, efficiency and effective management of resources for profit maximization. The majority (99.2%) of the yam farmers did not have access to credit, an indication of likely profit constraint due to the paucity of capital. Most of the yam farmers (64.5%) partake in both farming and non-farming activities, an indication that yam farming is not the major source of income generation among the respondents in the studied area. Results showed that most of the farmers (97%) in the studied area cultivated improved variety, depicting that the farmers preferred improved variety over the local variety. However, the case of hybrid cultivation in the studied area was not observed during the study period. The preference could be as a result of the respondents’ past experiences with both varieties. Majority of the yam farmers in the studied area had a large size of agricultural holding as evident from the mean farm size of 7.06 hectares but produced yam on a small scale based on operational holding. This showed that the farmers in the studied area engaged in farm diversification as a coping strategy against risk and uncertainty. The operational holding mean farm size of 2.37 hectares, implying that majority of the farmers in the studied area were small and medium scale farmers due to problems such as land ownership, capital and absence of extension agents, thus, affecting their yield. Majority of the farmers combined family and hired labour (60%) and this could be that most of the farmers’ family members were vulnerable and could not carry out most of the farm operations due to its rigorous nature. The chi2 values for each of the socio-economic profiles considered were different from zero at 10% risk level, indicating differences in the proportion of distribution of each variable considered.
Cost concepts and income measures for a hectare of yam
Yam farming may not be for the purpose of only satisfying the household food need or subsistence, the farmers may be interested in selling their output to raise income. Thus, the farmers, like any other entrepreneurs, would be interested in the profitability of the farm enterprise. For this reason, efforts were made to estimate the cost associated with yam farming and the revenue that accrued to the farmers’ efforts.
Shown in Table 2 are the cost concepts and income measures per hectare of yam production in the studied area. A perusal of the table showed the total economic and accounting costs of cultivation to be N113544.40 and N64562.30 respectively. The decomposition analysis showed the share contribution of total economic variable cost (TEVC) and total economic fixed cost (TEFC) in economic cost of cultivation to be 83.20 and 16.80% respectively; while the share contribution of total accounting variable cost (TAVC) and total accounting fixed cost (TAFC) in accounting cost of cultivation were 91.10 and 8.90% respectively. For the return structure, the economic and accounting revenue per hectare were N129750.00 and N108912.30 respectively. Furthermore, the profitability decomposition results showed the economic gross margin cum net farm income to be N35275.48 and N16205.61 respectively, while the accounting gross margin cum net farm income was N50097.65 and N44350.00 respectively. Therefore, at the farm level, it can be concluded that yam production was a profitable venture in the studied area. The economic and accounting ROI were 0.37 and 0.85 respectively, implying that for every N1 invested in the enterprise, an economic and accounting profit of 37kobos and 85kobos respectively, were gained. This profit margin should stimulate financing from the lending institutions because if yam farmers in the studied area are funded with N87476.41 at an interest rate of 8%, the farmer will return the principal of N87476.41, an interest of N6998.11 and retain N35275.48 as profit. The implication of this result is that there is a considerable level of profit in yam farming in the studied area. The rate of return per unit of capital invested (RORCI) indicates what is earned by the business through capital outlay. The results revealed that the economic and accounting RORCIs of 14 and 69% respectively were greater than the prevailing bank lending rate of 8%, thus, further justifying the profitability of yam farming in the studied area. Therefore, if a farmer takes a loan from the bank to finance yam farming, in respect of economic and accounting status he/her will be 6 and 61% respectively better off on everyone naira spent after paying the loan at the prevailing interest rate.
| Items | Quantity | Unit price | Amount (N) | Items | Amount (N) |
|---|---|---|---|---|---|
| Variable costs | Total variable accounting cost | 58814.65 | |||
| Family labour | 143.31manhours | 200 | 28661.75 | Total fixed accounting cost | 5747.65 |
| Hired labour | 104.35manhours | 200 | 20870.18 | Total accounting cost | 64562.30 |
| Seeds | 121.25 kg | 15 | 1818.68 | Total variable economic cost | 94474.52 |
| Fertilizer | 45.61 kg | 145 | 6614.04 | Total fixed economic cost | 19069.87 |
| Manure | 1666.67 kg | 14.50 | 24166.67 | Total economic cost | 113544.40 |
| Herbicides | 2.01 litres | 1350 | 2709.47 | Cost A1 | 68560.41 |
| Transportation | 1238.62 | Cost A2 | 71560.41 | ||
| Imputed value of interest on working capital | 8% of 87476.41 | 6998.11 | Cost B | 74560.41 | |
| Total variable cost | 94474.52 | Cost C | 103222.20 | ||
| Fixed costs | Cost D | 113544.40 | |||
| Depreciation on capital items | 20% | 2747.65 | Income measures | ||
| Contract rent (lease-in) | - | 3000 | Implicit revenue | 20837.70 | |
| Imputed contract rent (owned land) | 3000 | Explicit revenue | 108912.30 | ||
| Imputed managerial cost | 10% of Total cost | 10322.22 | Economic revenue | 129750.00 | |
| Total fixed cost | 19069.87 | Accounting gross margin | 50097.65 | ||
| Total cost | 113544.40 | Accounting net farm income | 44350.00 | ||
| Returns | AROI | 0.85 | |||
| Quantity sold | 1629.42 kg | 65 | 105912.30 | ARORCI | 0.69 |
| Quantity consumed | 225.03 kg | 65 | 14626.95 | Account cost of production | 39.62 |
| Quantity gifted | 95.55 kg | 65 | 6210.75 | Farm business income | 58189.59 |
| Total output quantity | 1950 kg | 65 | 126750 | Family labour income | 55189.59 |
| Lease-out | 3000 | Economic gross margin | 35275.48 | ||
| Total revenue | 129750 | Economic net farm income | 16205.61 | ||
| Cost concepts | Farm investment income | 19205.61 | |||
| Total variable opportunity cost | 35659.86 | EROI | 0.37 | ||
| Total fixed opportunity cost | 13322.22 | ERORCI | 0.14 | ||
| Total opportunity cost | 48982.08 | Economic cost of production | 58.23 |
Source: Field survey, 2017
Table 2. Cost concepts and income measures per hectare of yam farm.
TFP levels of yam farmers’ in the studied area
The increase in input use to a certain extent allows the farm sector to move along the production surface. The balanced use of inputs is expected to induce an upward shift in the production function to the extent that a technological change is embodied in them. The TFP measures the extent of increase in the total output which is not accounted for by increases in the total inputs. The estimated input, output and TFP index of yam production in the studied area as at 2016 cropping season are shown in Table 3.
| Farm | Output | Input | TFP | Farm | Output | Input | TFP |
|---|---|---|---|---|---|---|---|
| DMU06 | 0.3245 | 0.3208 | 1.0114 | DMU54* | 1.9580 | 1.1668 | 1.6782 |
| DMU10 | 1.1245 | 1.0240 | 1.0981 | DMU55* | 1.6434 | 1.1678 | 1.4072 |
| DMU13 | 0.5664 | 0.5220 | 1.0852 | DMU62 | 0.8462 | 0.7554 | 1.1201 |
| DMU15* | 0.7727 | 0.4051 | 1.9074 | DMU63 | 0.6888 | 0.6394 | 1.0773 |
| DMU16 | 0.5594 | 0.5536 | 1.0106 | DMU65 | 0.4615 | 0.4041 | 1.1421 |
| DMU20 | 0.8605 | 0.8031 | 1.0714 | DMU79 | 0.3846 | 0.3426 | 1.1227 |
| DMU31* | 0.7692 | 0.4946 | 1.5552 | DMU90 | 0.3524 | 0.3252 | 1.0839 |
| DMU32* | 0.9860 | 0.4150 | 2.3762 | DMU93 | 0.4965 | 0.4804 | 1.0335 |
| DMU36 | 0.3357 | 0.3156 | 1.0636 | DMU103* | 1.1140 | 0.7495 | 1.4863 |
| DMU38 | 0.7552 | 0.6344 | 1.1904 | DMU108 | 1.5668 | 1.4242 | 1.1001 |
| DMU42* | 0.6993 | 0.2441 | 2.8644 | DMU114 | 0.2832 | 0.2484 | 1.1403 |
| DMU49* | 1.1538 | 0.8085 | 1.4272 | DMU118* | 1.0000 | 0.7415 | 1.3487 |
Source: TFPIP computer print-out
Note: * implies farmers with balanced use of inputs.
Table 3. Estimated input, output and TFP index of yam production.
A perusal of Table 3 showed that only 24 (20%) farms achieved a robust increase in output index. Increase in output of 15 DMUs viz. 6, 10, 13, 16, 20, 36, 38, 62, 63, 65, 79, 90, 93, 108 and 114 was due to increased input use which brought inefficiencies in their use. The increase in output index coupled with an almost parallel increase in inputs-use index led to near stagnant total factor productivity of yam production for these DMUs. However, the output indexes were found to be higher than the indexes of inputs-use leading to positive TFP. Furthermore, the robust increase in the output of the remaining 9 DMUs viz. 15, 31, 32, 42, 49, 54, 55, 103 and 118 were attributed to balanced use of inputs which induced an upward shift in the production function to the extent that technological change was embodied in them. The higher output increase triggered by technological change has resulted in high positive TFP in yam production at the period of this study. However, the remaining DMUs recorded decrease in productivity as their TFP indexes were found to be less than unity.
Factors determining TFP of yam production in the studied area
Presented in Table 4 are the maximum likelihood estimates of the factors determining TFP of yam farmers in the studied area. The diagnostic statistics viz. LR chi2 is significant at 1% risk level, implying that the model is the best fit and appropriate for the specified equation; and the predictors included in the model are different from zero. In addition, the test for multicollinearity showed no presence of multicollinearity between the predictors as evident from the variance inflation factors (VIF) for each predictor which was less than 10.0. For normality test of the residual, the residual distribution was not normal as evident from the chi2 test statistic which was different from zero at 10% probability level. However, literature showed that non-normality in the distribution of residuals is not considered a serious problem because in most cases data are not normally distributed. The variables shown to have a significant influence on the TFP as evident from risk level of less or equal to 10% were age, marital status, education, household size, size of operational holding, co-operative membership, access to credit, extension contact and land ownership status. The estimated coefficient of age exhibited direct relationship and was significant at 5% risk level, meaning that TFP increases as farmer’s age advance. The marginal and elasticity implications of an increase in farmer’s age will translate to an increase in their TFP by 0.0067 and 0.43 respectively. Several kinds of literature have reported the effectiveness of youthful age on enhanced productivity given that this age category is composed of able-bodied men with ample energy to execute different farm operations effectively and even withstand the rigorous nature which characterizes yam production. The estimated coefficient of marital status exhibited a direct relationship with TFP and was significant at 10% risk level, implying that TFP of married farmers is more than that of their counterparts who are not married. The marginal and elasticity implications of been married will be increase in TFP of yam production by 0.079 and 0.112 respectively. The estimated coefficient of farmers’ education has a direct relationship with TFP and was significant at 1% risk level, implying that farmers with formal education are more productive in their input mix to maximize output when compared with their counterparts with no formal education. The marginal and elasticity implications of having a formal education will increase TFP of yam production by 0.023 and 0.037 respectively. Finding confirms that formal education motivates farmers to acquire and utilize innovation effectively. This result is in conformity with the assumption that formal education encouraged adoption of improved yam technologies which would in turn increase TFP of yam production. Attainment of formal education would directly enhance the ability of the farmers to adopt more advanced yam technologies and management technique thereby achieving higher TFP in yam enterprise. The estimated coefficient of household size exhibited an inverse relationship and was significant at 5% risk level, meaning that farmers with large household size would be less productivity when compared to their counterparts with small family holdings. This will occur if the farming household is dominated by vulnerable and weak people thereby rendering their effects with respect to farm labour provision not been felt in yam production. The marginal and elasticity implication of increase farm household size would lead to decrease in TFP by 0.0068 and 0.0796 respectively. The result showed the estimated coefficient of operational holding size to have a direct relationship with TFP and was significant at 1% risk level, indicating that farmers with appreciable to a large size of operational holdings would be more productivity. This is in conformity with the assumption that large-scale enterprise if effectively managed benefit from economies of scale, specialization and other pecuniary advantages. The marginal and elasticity implications of a unit increase in the size of operational holding would results in an increase in TFP of yam production by 0.089 and 0.261 respectively. Also, the estimated coefficient of co-operative membership exhibited a direct relationship with TFP, indicating that farmers who belong to the co-operative association(s) would be more productive than those who do not belong to any social association. This assumption holds because the basis of social association is a mutual help, thus availing card-carrying members to benefit from numerous pecuniary advantages viz. input purchase bulk discount, purchasing power, bargaining power for their products, economic and social powers etc. The marginal and elasticity implication of being a member of co-operative association would lead to an increase in TFP by 0.154 and 0.026 respectively. The estimated coefficients of access to credit, extension contact, and land ownership were negatively signed and all significant at 10% probability level, an indication that farmers with access to credit, extension contact and own the land they cultivate will be more productive than their counterparts with none of these aforementioned. The marginal and elasticity implications of farmers with no access to credit, no extension contact and with no title of land ownership would lead to decrease in TFP by 0.11, 0.035; 0.10, 0.02; and 0.08, 0.033, respectively.
| Variable | Coefficient | t-stat | Elasticity | VIF |
|---|---|---|---|---|
| Constant | 0.262 (0.253) | 1.035NS | ||
| Age | 0.0067 (0.0034) | 1.97NS | 0.43 | 5.866 |
| Gender | -0.0106(0.0596) | 0.177NS | -0.027 | 1.381 |
| Marital status | 0.079(0.043) | 1.837* | 0.112 | 1.261 |
| Education | 0.023(0.009) | 2.49*** | 0.037 | 3.493 |
| Household size | -0.0068(0.0035) | 1.945** | -0.796 | 1.363 |
| Farming Experience | -0.0011(0.0046) | 0.234NS | -0.0385 | 5.606 |
| Operational holding | 0.0886(0.0198) | 4.467*** | 0.2608 | 1.425 |
| Yam sett variety | 0.047(0.089) | 0.529NS | -0.0575 | 1.150 |
| Non-farm activity | 0.039(0.075) | 0.518NS | 0.034 | 2.379 |
| Co-operative mem. | 0.154(0.085) | 1.805* | 0.0256 | 1.212 |
| Access to credit | -0.114(0.066) | 1.735* | -0.035 | 1.074 |
| Extension contact | -0.103(0.057) | 1.802* | -0.0201 | 1.091 |
| Land ownership | -0.815(0.045) | 1.832* | -0.0326 | 1.237 |
| Chi2 (12) (χ2) | 72.62 [1.03E-10] | |||
| Normality test (2) (χ2) | 85.81 [2.33E-019] |
Source: Field survey, 2017
*, **, *** and NS means significance at 10%, 5%, 1% and non-significant respectively
Note: (): values in parenthesis are standard error; [ ] values in square brackets are probability levels.
Table 4. MLE of TFP of yam farmers.
Problems affecting yam production in the studied area
The results in Table 5 identified inadequate extension contacts and the high cost of improved agro-inputs as the highly severe problems affecting yam production in the studied area and were ranked 1st and 2nd respectively. Subsequently, limited access to credits, inadequate capital to finance production, the high cost of labour and incidence of theft (pilfering) were found to be the severe problems affecting yam production and were ranked 3rd, 4th, 5th and 6th respectively. Price fluctuation, the problem of readily available market, the problem of low soil fertility, the high cost of transportation, land tenure problem, poor road network and problems of pest and disease were identified as the moderately severe problems and were ranked 7th, 8th, 9th, 10th, 11th, 12th and 13th respectively. Inadequate storage facilities and high costs of yam setts were identified as the less severe problems and received rank 14th and 15th respectively; while flood and drought occurrence and the high cost of processing were reported as not severe problems and in ascending order they received the least ranks. The Kendall’s coefficient of concordance indicated that there is moderate agreement among the respondents with respect to the ranking of the constraints as evident from the Kendall coefficient of 0.552 which is significant at 1%. The Friedman’s test indicated that the attributes assigned by the respondents to the constraints come from the same statistical population as evident from the Chi2 which is significant at 10% probability level. Based on these findings, it is advisable that policymakers should follow this ranking in solving the constraints faced by the yam producers in the study area.
| Constraints | Mean | Market constraint | Infrastructure constraint | Credit constraint | Institutional constraint |
|---|---|---|---|---|---|
| Market problem (C9) | 4.40 (8th) | 0.776 | |||
| Price fluctuation (C10) | 4.49 (7th) | 0.759 | |||
| High cost of agro-input (C11) | 5.77 (2nd) | 0.501 | |||
| Pest and diseases (C5) | 3.91 (13th) | 0.481 | |||
| Processing problem (C15) | 1.79 (17th) | 0.709 | |||
| Storage problem (C7) | 3.27 (14th) | 0.633 | |||
| Poor road network (C6) | 4.01(12th) | 0.596 | |||
| Flood and drought (C4) | 1.80 (16th) | 0.515 | |||
| High transportation cost (C14) | 4.19 (10th) | 0.421 | |||
| Paucity of capital (C2) | 5.03 (4th) | 0.815 | |||
| Low soil fertility (C13) | 4.23 (9th) | 0.759 | |||
| Limited access to credit (C2) | 5.10 (3rd) | 0.484 | |||
| Inadequate extension services (C3) | 5.86 (1st) | 0.748 | |||
| High cost of yam setts (C8) | 3.18 (15th) | 0.671 | |||
| Problem of land tenure system (C1) | 4.09 (11th) | 0.568 | |||
| High cost of hired labour | 4.88 (5th) | ||||
| Theft/pilfering cases | 4.73 (6th) | ||||
| Kendall’s coefficient (KCC) | 0.552 | ||||
| Chi2 (χ2) | 1059.80*** | ||||
| Friedman’s Chi2 (χ2) | 1059.80*** | ||||
| Eigen-value | 2.495 | 2.327 | 1.816 | 1.412 | |
| % of variance | 16.634 | 14.911 | 12.108 | 9.413 | |
| Cronbach’s Alpha | 0.742 | 0.811 | 0.721 | 0.622 | |
| Kaiser-Meyer-Olkin test | 0.911 | ||||
| Bartlett’s Test of Sphericity (χ2) | 329.80*** |
Source: Field survey, 2017
Table 5. Constraints affecting yam farmers in the studied area.
To reduce the number of research variables and find the common factors affecting yam production in the studied area, 17 identified problems were subjected to an exploratory factor analysis (Table 5). The Pearson correlation eliminated two constraints viz. high costs of labour and theft/pilfering because they exhibited zero and perfect collinearity respectively (Table not reported). The Kaiser-Meyer-Olkin (KMO) test which measures the degree of inter-correlation among the variables and the appropriateness of factor analysis [24] has calibration value of 0.911. Following Kaiser and Rice [25], the calibrated MSA is “marvellous”, implying that the variables are inter-correlated and appropriate for factor analysis. Mansourfar [26] stated that for items to be suitable for factor analysis, the KMO value for sampling adequacy must be between 0.80 and 1.
The Bartlett's test which tests statistical probability of whether the correlation matrix has a correlation among variables rejected the hypothesis that the correlation matrix was an identity matrix (at the level of 0.01), indicating a significant relationship between the variables. The result of the latent criterion showed that the 15 variables subjected to factor analysis should be extracted to form four dimensions. These four dimensions explained 53.07% of the variation in the data i.e. the factors that meet the cut-off criterion with Eigen-values greater than 1 and generally considered satisfactory in social sciences [18,27,13]. For reliability measurement, the estimated Cronbach’s Alpha values for each of the four dimensions or factors were above the cut-off point of 0.60 suggested by Churchill [5] to be appropriate for exploratory research. All these provide evidence of the appropriateness of the sample for the principal components analysis. The behaviour of individual items in relation to others within the same factor provides confirmation of content validity because the highest factor loading is central to the domains assessed by these factors [28]. The extracted factors and their respective factor loadings exclude those whose absolute loading value was less than 0.40. In labeling the factors that were loaded from two-factor loadings, only the highest factor score was considered. The four extracted factors were labeled as the market constraint, infrastructure constraint, capital constraint and institutional constraint.
The first factor labelled market constraint has an Eigen-value of 2.50, loaded with four items and explained 16.63% variance of the inhibiting factors. The items loaded on this factor shows farmers concern on poor market outlet for their products, and thus, the need for an efficient market which will make them earn remunerative prices for their product from the marketing chain. The second factor labelled infrastructure constraint, loaded with five items has an Eigen value of 2.24 and explained 14.91% of the variance of the inhibiting factors. The items on this factor indicate farmers concern on poor and insufficient availability of infrastructural facilities and yearn for adequate provision of good road network, sufficient and appropriate marketing facilities in order to enhance market efficiency. The third factor labelled capital constraint has an Eigen value of 1.82, loaded on three items and explained 12.12% of the variance of the militating factors. This dimension shows farmers worries on the paucity of finance and declining soil fertility and calls for tacit intervention to sustain the enterprise for yam food security. The fourth factor labelled institutional constraint has an Eigen value of 1.41, loaded on three items and explained 9.41% of the variance of militating factors. The items on this factor show farmers concern on ineffectiveness and poor implementation of existing government policies and call for harmonization, strengthening, monitoring and re-evaluation of policies to ensure efficiency in yam value chain.
Then, the four-factor model with all indicators of these four constructs was estimated using CFA (Table 6a), since the measurement model has acceptable fits. Also achieved was unidimensionality as evident from the small size of the modification indices and estimated residuals. Furthermore, the model measurement of goodness of fit viz. Discrepancy chi2 (χ2) which should be greater than 5% [29]; Adjusted goodness-of-fit index (AGFI) which should be higher than 0.8 [30,31], Tanaka and Huba [32] recommended a value greater than 0.9; Goodness-of-fit index (GFI), Comparative fit index (CFI), Tucker-Lewis index (TLI), Normed fit index which should all exceed 0.9 [33-36]; Root mean squared error of approximation (RMSEA) which should be less than 0.50 [37] and Chi-square (χ2)/ degree of freedom (χ2/df) which should be less than 3.0 [38] were examined. The results of fit statistics viz. χ2 = 0.113; AGFI = 0.860; GFI = 0.906; CFI = 0.937; TLI = 0.916, NFI = 0.953; RMSEA = 0.083 and χ2/df = 2.19 indicated measurement fit of the confirmatory factor analysis (CFA) for the constraints affecting yam production (Table 6a).
| Category | Fit statistic | Value |
|---|---|---|
| Absolute fit | Discrepancy chi2 (χ2) | 0.113 |
| RMSEA | 0.083 | |
| GFI | 0.906 | |
| Incremental fit | AGFI | 0.860 |
| CFI | 0.937 | |
| TLI | 0.916 | |
| NFI | 0.953 | |
| Parsimonious fit | χ2/df | 2.19 |
Source: SEM computer print-out
Table 6a. CFA Goodness of fit statistics.
Presented in Table 6b are the results of the confirmatory factor analysis for convergent and discriminant validities. All constructs show good convergent validity as each indicator of the Construct factor loadings (CFL) exceeds 0.50 and all the factor loadings of the reflective indicators exceeded 0.40. The Average variance extraction (AVE) ranged from 0.600 to 0.817 and the Composite reliabilities (CR) ranged from 0.784 to 0.951. Each construct’s AVE is above its squared correlation with other constructs. The factor loadings of Factor 1, 2, 3 and 4 accounted for 82, 80, 60 and 77% of the average variance in the market, infrastructure, capital and institutional constraints respectively. Thus, the measurement model exhibits a high degree of convergent and discriminant validities.
| Construct | CFL | CR | AVE | Factor correlations | |||
|---|---|---|---|---|---|---|---|
| F1 | F2 | F3 | F4 | ||||
| Market (F1) | 0.629 | 0.945 | 0.817 | 0.904 | |||
| Infrastructure (F2) | 0.575 | 0.951 | 0.799 | 0.109 | 0.894 | ||
| Capital (F3) | 0.686 | 0.784 | 0.600 | 0.250 | 0.527 | 0.775 | |
| Institutional (F4) | 0.662 | 0.909 | 0.770 | 0.027 | 0.139 | 0.131 | 0.8775 |
Source: SEM computer print-out
Note: All items loading in CFA were significant at P<0.001 level. The diagonal values are the square roots for each construct.
Table 6b. CFA for convergent and discriminant validity of constraints.
Path analysis was used to estimate simultaneously the processes of the influence of variables on others, the direct, indirect and total effects of the variables (Figure 1). The results showed that each latent variable has a direct effect on the items loaded on them. Furthermore, latent variables viz. market and infrastructure constraints are at par in terms of total effects on observable variables while the remaining latent variables trailed behind. However, no case of indirect effect was observed.

Figure 1. CFA of factors affecting yam production.
The study measured the TFP of yam farmers in the studied area with the intent of proffering way forward to explore the untapped potentials in yam production which have added a new fold-export promotion in the country. TFP results also showed that most of the farmers did not achieve a robust increase in output index in the studied area which owes to inefficiency in utilization of productive resources. However, the identified factors that affected the TFP were household size, access to credit, extension contact and title of land ownership. In lieu of these the following recommendations were made:
◊ Farmers should be encouraged to increase the utilization of their farm resources but need to be rational in doing so.
◊ Government and non-governmental organizations should formulate supportive policies targeting welfare improvement of the poor farmers cultivating yam crop in the studied area:
i. Farmers should be provided with adequate credit facilities at a reasonable interest rate in order to enhance yam food security and farm family incomes.
ii. The dearth of extension services in the studied area is a source of concern; as such both government and non-governmental organizations should immediately intervene in order to enhance the efficiency of yam value chain in the studied area.
iii. Farmers should be enjoined to form and join effective self-help groups so that they can use their joint social and economic capitals to enhance their yam farming business.
iv. Government and the non-governmental agency should continue with their relentless effort on sensitizing farmers on the imperativeness of sustainable household size which still remains the prelude to a better standard of living.
v. With dexterity, the government should implement the existing land act reforms in the country in order to avail arable land in the studied area to farmers for food production.
vi. Government policies on increase yam production for export should be harmonious in order not to endanger the biodiversity and yam food security of the nation i.e. temptation for market abroad should not destroy market at home.