Research & Reviews: Journal of Pharmacology and Toxicological Studies
e-ISSN: 2322-0139 p-ISSN: 2322-0120
e-ISSN: 2322-0139 p-ISSN: 2322-0120
Swarup Roy*
Department of Biochemistry and Biophysics, University of Kalyani, Kalyani-741235, West Bengal, India.
Received date: 29/05/2015; Accepted date: 14/06/2016 ; Published date: 21/06/2016
Visit for more related articles at Research & Reviews: Journal of Pharmacology and Toxicological Studies
The interactions of human and bovine serum albumins (HSA and BSA) with various drugs have received great attention now a days due to their significant effect in the biomedical field. Detailed information about the interactions of drugs with serum albumin can be deducted from the data of fluorescence quenching studies, UV-Vis, and circular dichroism spectroscopy. Among the all fluorescence spectroscopy is the most likable one due to its high sensitivity and simplicity. The present review highlights the interaction of various kinds of drugs with HSA and BSA. This review helps in understanding the structural features of drugs crucial for not only their affinity for serum albumin but also their optimum pharmacological activities.
Interaction, Drugs, Serum albumin, Spectroscopy, Fluorescence.
Investigations on the interactions of drug molecules with various proteins receive considerable interest in the field of chemistry, life science and clinical medicine for decades. The nature and the magnitude of these interactions influence the biosafety, delivery rate, pharmacological response, therapeutic efficacy and the design of drugs. Hence studies on these interactions help in understanding the structural features essential for the bio-affinity of various drugs toward the pharmacological activity [1-4]. Since serum albumin is essential in the drug delivery of vertebrates, it is the ideal model for studying the drug-protein interactions in vitro.
Albumin is the most abundant protein in the vertebrates’ organisms and the most prominent plasma protein (present at 40-50 mg/ml), about 60 % of the total protein content of plasma. It is one of the first discovered and mostly studied proteins [5]. Among serum albumins, HSA and BSA are extensively studied due to their importance in the pharmacology field. Both HSA and BSA showed 80 % sequence similarity. The molecular weights are very similar 66 kDa for BSA and 66.5 kDa for HSA and the tertiary structures of HSA and BSA also show 76 % similarity [6]. Serum albumins are synthesized by the parenchymal cells of the liver and exported as a non-glycosylated protein. Serum albumin is a major protein component of blood plasma which is also found in the interstitial fluid of body tissues and has a half-life of 19 days in humans [5,7]. Serum albumin has different roles such as maintenance of normal osmotic pressure, binding to the different substances and transporting drugs and endogenous compounds, metabolic function such as inactivation of some compounds, and acid-base function due to having numerous charged residues and being abundant in plasma. Serum albumin also has an effective role in the regulation of plasma buffer, antioxidant function and an anticoagulant effect [8,9]. Bovine serum albumin shows discrete binding sites with different specificities, the most important ones being referred to as site-I and site-II, located in hydrophobic cavities of sub-domains IIA and IIIA, respectively [5]. Site markers are small molecules that have specific binding locations in the albumin structure and are often used in studying the interaction of different ligands with the protein. Site-I markers include warfarin, phenylbutazone, dansylamide and iodipamide, while ibuprofen, flufenamic acid and diazepam are site-II markers [10]. Two proteins BSA and HSA are globular proteins having three structurally similar domains (I–III), each containing two subdomains (A and B) and stabilized by 17 disulfide bridges. The two subdomains A and B can accommodate several ligands [11-13].
Herein a review on the binding interaction of various kind of drug to BSA and HSA from a spectroscopic approach has been presented. This review does not seek to provide an absolute review of all articles published on drug–serum albumin interactions; rather it provides a snapshot of the assortment of spectroscopic studies of interaction between BSA and HSA and various drugs.
Although there are lots of technique available for the study of interaction between protein and various drug molecule but spectroscopic approach is simple and very sensitive method for studying the same. In the present paper only spectroscopic techniques like fluorescence, UV-Vis and Circular dichroism spectroscopic technique has been mentioned.
Fluorescence spectroscopy studies
To study the interaction between various drug molecule and serum albumin fluorescence spectroscopy is very simple, sensitive and useful method. Serum albumin has fluorescent properties and emits intensely upon excitation and for its intrinsic fluorescence three amino acid residues tryptophan, tyrosine and phenylalanine are found in its structure [5]. The relative ratio of fluorescence intensity for these amino acids is 100: 9: 0.5, it seems probable that the fluorescence of serum albumin arises principally from its two tryptophan residues [14-15]. The fluorescence spectra are recorded in the absence and in the presence of increasing concentrations of drug molecules. In the case of an interaction with the drugs molecule, the fluorescence intensity of the serum albumin at around 345 nm decreases regularly as the concentration of the drug increases. Moreover, a red or blue shift of the emission maximum in the fluorescence spectrum of the albumin is indicative of an increase in the hydrophobicity of the microenvironment around the tryptophan residues [16], while no change in the position of the emission maximum suggests no alteration in the local dielectric environment of serum albumin [17].
Fluorescence quenching can occur through different mechanisms, usually classified as static quenching meaning a nonfluorescent ground-state complex is formed between the fluorophore and the quencher, dynamic quenching meaning a collisional process, the fluorophore and the quencher interact during the transient existence of the excited state, or a simultaneous static and dynamic quenching [18-20].
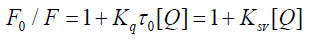
Several parameters are used to define and evaluate the interaction between serum albumin and the drug: the Stern Volmer quenching constant, the quenching rate constant, the binding constant and the number of binding sites. The fluorescence quenching is reported by the Stern-Volmer equation [20-21].
 (1)
(1)
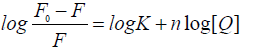
Where, F0 and F are the fluorescence intensities of serum albumin in the absence and in the presence of the quencher (i.e., drug molecule), respectively, KSV is the Stern-Volmer quenching constant, [Q] is the concentration of the quencher, Kq is the quenching rate constant of the biomolecule and τ0 is the average lifetime of the molecule in the absence of the quencher. A linear F0/F vs. [Q] plot indicates that a single type of quenching mechanism is involved, either static or dynamic, while a deviation from linearity suggests a mixed quenching mechanism [22]. The KSV value is obtained from the plot F0/F vs. [Q]. Values with a magnitude order of 105 M-1 for KSV are considered to be indicative of a relatively strong interaction between serum albumin and metal complexes [19,23-25]. Considering the well-known connection between the KSV quenching constant and the Kq quenching rate constant Kq = KSV/ 0 τ and taking into account that the fluorescence lifetime of the biopolymer is 10-8 s [22], the Kq values can be calculated, also providing information referring to the type of quenching occurring in the presence of a certain quencher [26]. Dynamic and static quenching show different dependence on temperature reflected in the changes in the fluorescence. In the case of dynamic quenching, a faster diffusion is a consequence of an increase in temperature and, thus, the quenching rate increases and in case of static quenching rate decreases [19,25]. When small molecules bind independently to a set of equivalent sites on a molecule, the equilibrium between free and bound molecules is represented by the following Scatchard equation [24,27].
 (2)
(2)
Where, F0 and F are the fluorescence intensities of the protein in the absence and in the presence of the quencher (i.e., drugs molecule) respectively, [Q] is the concentration of the quencher, K is the binding constant and n is the number of binding sites. The K values are obtained from the plot log [(F0 -F)/F] vs. log [Q]. Values with a magnitude order in the range of 103–106 M-1 for K are reported as being indicative of an efficient interaction with the protein [19,27-27]. Generally, the K value of a compound to serum albumin should be high enough to ensure that a significant amount gets transported and distributed through the organism but simultaneously, low enough so that the compound can be released once it reaches its target. Such an optimum range is considered to be 104–106 M-1 [29-30]. The number of binding sites indicates the number of independent class of binding sites for the complexes on serum albumin and are generally approximately n ≈ 1 [31].
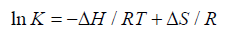
Generally the force of interaction between drugs and BSA/HSA are electrostatic interactions, hydrogen bonds, van der Waals interactions, and hydrophobic interactions. The nature of the mentioned interaction force can be estimate using the signs and magnitudes of thermodynamic parameters enthalpy change (ΔH), free energy change (ΔG) and entropy change (ΔS). These three parameters can be calculated using the following Equation 3 and Equation 4.
 (3)
(3)
 (4)
(4)
According to the views of Ross and Subramanian [32], when ΔH > 0 and ΔS > 0: indication of hydrophobic forces; ΔH < 0 and ΔS < 0: indication of van der Waals interactions and hydrogen bonding; ΔH ≈ 0 and ΔS > 0: indication of electrostatic interactions.
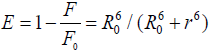
Forster’s resonance energy transfer (FRET) [33] theory has been very useful method for the estimation of interactions between drugs molecule and serum albumin. FRET can be used to measure the distance between the bound drugs and the fluorophore molecule (serum albumins) [34-35]. The transfer of energy, between the donor (serum albumin) and acceptor (drugs) is controlled by the four following factors- (1) the fluorescence quantum yield of the donor, (2) the relative orientation of the transition dipoles of the donor and acceptor, (3) overlap integral between the fluorescence spectrum of the donor and absorption spectrum of the acceptor, and (4) the distance (r) between the donor and the acceptor [36]. According to FRET the energy transfer efficiency E, in addition to its dependence on the distance between the acceptor and the donor, depends upon the critical energy transfer distance, R0 (critical distance when the transfer efficiency is 50 %). Hence the efficiency of energy transfer for a single donor-single acceptor system is expressed by as follows-
 (5)
(5)
Where, F and F0 are the fluorescence intensities of BSA/HSA in presence and absence of drug molecules, r is the distance between acceptor and donor, which can be estimated by the following equation-
 (6)
(6)
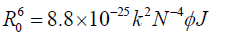
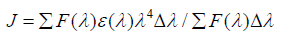
Where, k2 is the spatial orientation factor between the emission dipole of the donor and the absorption dipole of the acceptor. The dipole orientation factor, k2, is the least certain parameter to be used in the calculation of the critical transfer distance. Although theoretically k2 can range from 0 to 4, the extreme values require very rigid orientations. If both the donor and acceptor are tumbling rapidly and free to assume any orientation, k2 equals 2/3. If only the donor is free to rotate, k2 can vary from 1/3 to 4/3 [37]. N is the refractive index of the medium, φ is the fluorescence quantum yield of the donor and J is the overlap integral of the fluorescence emission spectrum of the donor and the absorption spectrum of the acceptor given by the following equation-
 (7)
(7)
Where, F (λ) is the fluorescence intensity of the fluorescent donor at wavelength λ and is dimensionless; ε (λ) is the molar absorption coefficient of the acceptor at wavelength λ. It has been reported for BSA that k2 = 2/3, ɸ = 0.15 and N = 1.336 [38]. Using the above equation distance r can be calculated. If r < 7 nm [39-41] and 0.5 R0 < r < 1.5 R0 [21], the probability of energy transfer from serum albumins to drug molecule is high and nonradiative process.
Synchronous fluorescence spectroscopy
This spectroscopic phenomenon was introduced by Lloyd [42-43], and it is a simple and effective means to measure the fluorescence quenching and the possible shift of the maximum emission wavelength (λmax) relative to the alteration of the polarity around the chromophore at physiological conditions. When Δλ is stabilized at 15 nm or 60 nm, synchronous fluorescence offers the characteristics of tyrosine residues or tryptophan residues in the serum albumins [44]. In the synchronous fluorescence spectra, the fluorescence intensity decreased with or without any shift in the emission maximum. A decrease in fluorescence intensity without any shift indicates that the microenvironment around that particular residue is not disturbed. Red-shift is indicative of an increase in the hydrophilicity around the fluorophore in serum albumin. Blue-shift should be due to an increase in the hydrophobicity around the fluorophore moiety [45-46].
UV-Vis absorption spectroscopy studies
The absorption spectra are recorded in the absence and in the presence of increasing concentrations of drug molecule. The absorbance spectrum of serum albumin shows two characteristic bands, at around 220 nm and 280 nm, due to the α-helix structure of the protein and the aromatic amino acid residues respectively [25]. Usually, a marked decrease in the 220 nm absorbance peak is reported, due to the perturbation of the secondary structure of the protein [25,47], while the changes observed in the 280 nm band are more usual and indicating that the environment in the close proximity of the aromatic amino acid residues is altered [48].
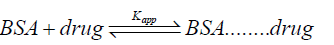
The equilibrium for the formation of complex between serum albumin and drug is given by Eqation 8,
 (8)
(8)
Where, Kapp is the apparent association constant. The Kapp value was calculated by the method as reported by Benesi and Hildebrand [49] using following equation 9.
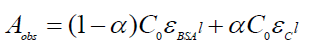 (9)
(9)
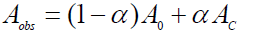
Where, Aobs is the absorbance of the serum albumin solution containing different concentrations of drug at 279 nm, α is the degree of association between serum albumin and drug molecules, ε serum albumin and εC are the molar extinction coefficients at the defined λ for serum albumin and the complex formed respectively, C0 is the initial concentration of serum albumin and l is the optical path length. Equation 9 can be expressed as following equation 10.
 (10)
(10)
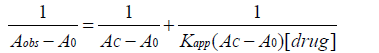
Where, A0 and AC are the absorbance of serum albumin and the complex at 279 nm respectively with the concentration of C0. At relatively high drug concentration, α can be equated to (Kapp [drug])/(1+ Kapp [drug]) where [drug] is the concentration of drug in mol/L. Thus Eq. 10 now becomes following equation 11.
 (11)
(11)
A graph of 1/(Aobs−A0) vs. 1/[ drug] yield a linear plot with a slope equal to 1/Kapp (AC−A0) and the length of intercept equal to 1/(AC−A0) and from the slop and intercept Kapp value can be easily calculated.
Circular dichroism spectroscopy studies
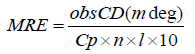
To explore the structural change of serum albumin CD spectral measurements need to be carried out in absence and in presence of drug. Two strong negative bands in the UV region at 208 and 222 nm have been observed in case of pure BSA, which is the characteristic of α-helical structure of protein [50]. The addition of drug in BSA/HSA causes some minor α helicity changes in the CD spectra. The CD results are expressed in terms of mean residue ellipticity (MRE) in degree cm2 mol−1 according to the following equation 12 [51].
 (12)
(12)
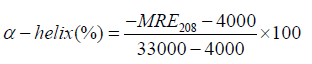
Where, Cp is the concentration of serum albumin in g/ml, Ɵ is observed rotation in degrees; l is the path length in cm and n is the number of amino acid residues of protein (583 for BSA). The α-helix contents of BSA have been calculated from MRE values at 208 nm using the following equation 13 [52]:
 (13)
(13)
Where, [Ɵ]208 is the observed MRE value at 208 nm, 4000 is the MRE of the α-form and random coil conformation cross at 208 nm, and 33,000 is the MRE value of a pure α-helix at 208 nm. According to the above equation the percentage of α-helix of serum albumin can be calculated and it shows that the percentage of helicity of pure serum albumin and serum albumin in presence of drugs. The change in α-helical content of serum albumin suggests whether denaturation occur or BSA/HSA could retain its intact helical structure [53]. So, to study the structural changes of serum albumin, CD spectral study has been a suitable methods and very useful techniques.
From the last decade several drugs has been examined for their efficiency of interaction with serum albumin. There are several reports on various kinds of drugs and serum albumin but here represented only few of these reports on the investigation of interaction between various kinds of drugs and BSA/HSA and the list have been given in Table 1.
| Sl. No | Interaction | Citation |
|---|---|---|
| 1 | 1-hexylcarbamoyl-5-fluorouracil (Carmofur) and BSA | Hu et al. [54] |
| 2 | Alprazolam (ALP) and fluoxetine (FLX) hydrochloride to HSA | Dangkoob et al. [55] |
| 3 | Acetaminophen on HSA | Rzaei-Tavirani et al. [56] |
| 4 | Amodiaquine(AQ) with HSA | Samari et al. [57] |
| 5 | HIV protease and reverse transcriptase inhibitors to HSA | Bocedi et al. [58] |
| 6 | Gemcitabine hydrochloride (GEM) and BSA or HSA | Kandagal et al. [59] |
| 7 | Anticancer drugs (i) 5-fluorouracil (5-FU), (ii) azacitidine (AZ) and (iii) cytarabine (CY) (pyramidine analogues) with BSA | Abraham and Mathew [60] |
| 8 | Ceftriaxone and HSA | Abu Teir et al. [61] |
| 9 | Cyanidin-3-glucoside (Cy-3-G) and BSA | Shi et al. [62] |
| 10 | Colchicine and BSA | Hu et al. [63] |
| 11 | Cefixime(CFX) with BSA | Zhang et al. [64] |
| 12 | Diclofenacsodium and BSA | Dutta et al. [65] |
| 13 | Estrogen bisphenol AF (BPAF) and HSA | Yang et al. [66] |
| 14 | Vecuroniumbromide (VB) with HSA | Zhu et al. [67] |
| 15 | Efonidipinewith BSA | Wang et al. [68] |
| 16 | Tenofovirwith HSA | Shahabadi et al. [69] |
| 17 | Erlotinibhydrochloride and BSA | Rasoulzadeh et al. [70] |
| 18 | Sulfadiazine (SD) binds and unfolds BSA | Ali and Al-Lohedan[71] |
| 19 | HSA with s SD | Ali and Al-Lohedan[72] |
| 20 | Gangleron(spasmolytic and anaesthetizing drug) and HSA | Grigoryan and Ghazaryan[73] |
| 21 | Ketoconazole and HSA | Maltas et al. [74] |
| 22 | Nortriptylinehydrochloride (NOT) and promazine hydrochloride (PMZ) with serum albumins | Khan et al. [75] |
| 23 | Donepezil with HSA | Buzoglu et al. [76] |
| 24 | Isofraxidinwith HSA | Liu et al. [77] |
| 25 | Linezolid with HSAÃÂ and alpha-1 acid glycoprotein | Taguchi et al. [78] |
| 26 | Mangiferin(MA) and BSA | Lin et al. [79] |
| 27 | Metformin hydrochloride and BSA | Tanwir et al. [80] |
| 28 | Mitoxantrone(MTX) with HSA | Khan et al. [81] |
| 29 | Olmesartanmedoxomil and its metabolite olmesartan with BSA | Sharma and Pancholi[82] |
| 30 | HSA with osthole | Yang et al. [83] |
Table 1: Interaction of various drugs and serum protein
Hu et al. (2005) reported [54] the interaction between anti-tumor drugs, 1-hexylcarbamoyl-5-fluorouracil (Carmofur) and BSA. Their results showed that the quenching mechanism of fluorescence of BSA by Carmofur is a dynamic quenching. The binding reaction is mainly entropy-driven and hydrophobic interactions and secondary structure was changed in the presence of Carmofur from the CD study.
Dangkoob et al. (2015) reported [55] bindings of alprazolam (ALP) and fluoxetine (FLX) hydrochloride to HSA. They showed analysis of UV absorption data and the fluorescence quenching of HSA in the binary and ternary systems that FLX decreased the binding affinity between ALP and HSA. On the contrary, ALP increased the binding affinity of FLX and HSA. It was demonstrated that the affinity of HSA to ALP was higher than that to FLX while the presence of FLX could cause the decrease of the affinity of ALP to HSA in the [HSA–FLX]–ALP system. The study of molecular docking showed that the acting forces between HSA and both drugs are hydrophobic interactions, hydrophilic interactions, and hydrogen bonds in which hydrophobic interactions are dominated.
Rzaei-Tavirani et al. (2005) reported [56] interaction of acetaminophen on HSA. The study of HSA- acetaminophen interaction reveals the effects of acetaminophen on HSA structure, preventing its phase transition. HSA–acetaminophen interaction leads to the stabilization of HSA. The structural changes within HSA due to its interaction with acetaminophen could be considered as a drug side effect and it may affect the protein functions.
Samari et al. (2012) showed [57] the interaction of amodiaquine (AQ) with HSA. Results showed this binding reaction hydrogen bond and van der Waals forces were the main interacting forces. Both experimental results and modeling methods suggested that AQ binds mainly to the sub-domain IIA of HSA
Bocedi et al. (2004) showed [58] binding of anti-HIV drugs to HSA. They described the values of the dissociation equilibrium constant (Kd) for the binding of HIV protease and reverse transcriptase inhibitors to HSA. Kd values for the binding of anti-HIV drugs to HSA (ranging between 4.4 × 10⁻⁵ M and 3.8 × 10⁻⁴ M), it appears that the fraction of HIV protease and reverse transcriptase inhibitors bound to HSA ranges between 63% and 91%.
Kandagal et al. (2006) reported [59] the interactions between gemcitabine hydrochloride (GEM) and BSA or HSA. Author showed that the GEM has a strong ability to quench the intrinsic fluorescence of both BSA and HSA through a static quenching procedure. Their results showed that the binding of GEM to BSA or HSA induced conformational changes in BSA and HSA.
Abraham and Mathew (2014) reported [60] the interaction of anticancer drugs (i) 5-fluorouracil (5-FU), (ii) azacitidine (AZ) and (iii) cytarabine (CY) (pyramidine analogues) with BSA. The results showed that static quenching and non-radiative energy transfer are the main reason of fluorescence quenching. The synergism results in both the decrease of the binding stability between the mentioned drugs and BSA and a rise of the free drug concentration, which in turn increases the efficacy of drugs.
Abu Teir et al. (2014) showed [61] spectroscopic interaction study of ceftriaxone and HSA. From spectral analysis, ceftriaxone showed a strong ability to quench the intrinsic fluorescence of HSA through a static quenching. Authors’ inferred the observed spectral changes indicated the formation of hydrogen bonding between ceftriaxone and HSA molecules at higher percentage for α-helix than for the β-sheets.
Shi et al. (2013) showed [62] interaction between cyanidin-3-glucoside (Cy-3-G) and BSA. Based on the enthalpy and entropy changes and the molecular docking results they suggested that the main interaction forces of Cy-3-G with BSA are van der Waals and hydrogen bonding interactions. The binding distance between Cy-3-G and the Trp residue of BSA was also calculated as 3.729 nm according to FRET and results suggested a non-radiative energy transfer process.
Hu et al. (2005) reported [63] interaction between colchicine and BSA. The experimental results indicate that the probable quenching mechanism of fluorescence of BSA by colchicine is a static quenching. They showed that the fluorescence quenching of BSA by colchicine was a result of the formation of colchicine–BSA complex; van der Waals interactions and hydrogen bonds play a key role in stabilizing the complex.
Zhang et al. (2014) reported [64] interaction of cefixime (CFX) with BSA. The main interaction of CFX and BSA was hydrophobic. The quenching mechanism and type of interaction force were consistent, which indicated synchronous fluorescence spectrometry used for the binding mechanism between drug and protein. This study showed that synchronous fluorescence spectroscopy was a useful supplement to the conventional fluorescence method.
Dutta et al. (2006) described [65] the interaction between diclofenac sodium and BSA. They observed association constant decreases with rise of temperature. During increase in pH and ionic strength the association constant was affected. For this complex van der Waals interactions and hydrogen bonds play a major role in stabilizing the complex.
Yang et al. (2014) described [66] the interaction between estrogen bisphenol AF (BPAF) and HSA. Their results indicated BPAF was indeed bound to HSA and located in the hydrophobic pocket of HSA on subdomain IIA through hydrogen bond and van der Waals interactions. The fluorescence quenching data showed that the binding of BPAF and HSA quenched the intrinsic fluorescence of HSA, and the static quenching constants were acquired.
Zhu et al. (2014) showed [67] that studied on the interaction of an aesthetic, vecuronium bromide (VB) with HSA. The primary binding pattern is determined by hydrogen bonding or van der Waals forces occurring in site I of HSA. VB could induce slight change in the secondary structure and also unfold the polypeptides of protein. The differential scanning calorimetry results provide quantitative information on the effect of VB on the stability of serum albumin.
Wang et al. (2008) showed [68] the interaction of efonidipine with BSA. BSA fluorescence was quenched by efonidipine, due to the fact that efonidipine quenched the fluorescence of tryptophan residues mainly by the collision mode. For this interaction the thermodynamic parameters suggested that the hydrophobic interaction played a key role for the stabilization of complex. The results of circular dichroism and synchronous fluorescence measurements also showed that the binding of efonidipine to BSA led to a conformational change of BSA.
Shahabadi et al. (2015) reported [69] the interaction of antiviral drug tenofovir with HSA. UV–Vis results confirmed that tenofovir interacted with HSA to form a ground-state complex and values of KSV indicated the presence of a static component in the quenching mechanism. For the interaction of tenofovir with HSA hydrophobic interaction plays a major role to stabilize the complex. Data also suggested that the secondary structure of HSA molecules was changed in the presence of tenofovir. Their experimental results were also in agreement with the results obtained via molecular docking study.
Rasoulzadeh et al. (2010) studied [70] the interaction between erlotinib hydrochloride and BSA. They showed that binding of erlotinib hydrochloride to BSA was spontaneous, and the hydrophobic forces played a vital role in the formation complex. The distance between donor and acceptor was found to be < 7 nm suggested non-radiative energy transferring and static quenching for this complex.
Ali and Al-Lohedan (2013) studied [71] sulfadiazine (SD) binds and unfolds BSA. Results showed that there was a strong (1:1) binding, which involved static quenching, between the SD and BSA with very small effect on the conformation of protein at low concentration of drug. However, in presence of high concentration of SD a complete disruption of α-helical content was observed with a significant increase in β-sheet conformations. Dominance of the hydrophobic interaction was found to be involved in the drugalbumin binding. In addition, a high probability of energy transfer from BSA to SD was also observed. Ali and Al-Lohedan (2014) also showed [72] interaction of HSA with s SD and SD quenched the fluorescence of HSA via a static mechanism and with 1:1 binding ratio. Eventually, protein unfolds largely in the presence of high concentration of SD. Hydrophobic interaction dominated in the binding of drug and albumin. Furthermore, a high probability of energy transfer from HSA to SD was also observed in this case.
Grigoryan and Ghazaryan (2013) reported [73] interaction between gangleron (spasmolytic and anaesthetizing drug) and HSA. The results showed that the values of KSV increased with rise of temperature indicated quenching mechanism of HSA–Gangleron was dynamic collision. They also calculated activation energy (49.64 kJ/mol) for this binding reaction system.
Maltas et al. (2013) studied [74] interaction between ketoconazole and HSA on epoxy modified magnetic nanoparticles for drug delivery. The nature of the binding forces was found to be hydrophobic interaction. Protein and drug attachments results showed that prepared albumin-based magnetic nanoparticles carrier systems represent an attractive strategy for drug delivery.
Khan et al. (2012) reported [75] the interaction of amphiphilic drugs nortriptyline hydrochloride (NOT) and promazine hydrochloride (PMZ) with serum albumins. The binding affinity was more in case of PMZ with both BSA and HSA. The quenching rate constant values suggested a static quenching process for all the drug–serum albumin interactions. The UV–Visible results show that the change in protein conformation of PMZ–serum albumin interactions was more prominent as compared to NOT–serum albumin interactions. The CD results also suggested that the conformational changes in the serum albumins on binding with the drugs.
Buzoglu et al. (2014) showed [76] interaction of donepezil with HSA on amine-modified magnetic nanoparticles and results showed that HSA exhibited high affinity for APTES modified SPIONs. KSV increased with increasing temperatures, demonstrating a dynamic quenching procedure. The values of binding constant decreased with rise of temperature, resulted in a decrease in the stability of donepezil-HSA. The values of ΔH and ΔS were indicative of the electro-static interaction mood of binding.
Liu et al. (2004) described [77] the interaction of isofraxidin with HSA. They showed that the interaction results in one type of isofraxidin–HSA complex with binding constants value decreases with increase of temperature. The thermodynamic parameters ΔH and ΔS indicated that hydrophobic interaction played a main role in the binding of isofraxidin to HSA. The experiment results were nearly in accordance with the calculation results obtained by Silicon Graphics Ocatane2 workstation.
Taguchi et al. (2015) described [78] interactions of linezolid with two major serum proteins, HSA and alpha-1 acid glycoprotein. They showed although linezolid binds to HSA and alpha-1 acid glycoprotein, the percentage of bound molecules and the affinity of linezolid for both proteins were low. Competitive protein binding analyses using an ultrafiltration method clearly indicated that linezolid binds to the digitoxin binding site on HSA and the basic and/or hydrophobic drug binding site on alpha-1 acid glycoprotein.
Lin et al. (2009) showed [79] interaction between mangiferin (MA) and BSA and the results showed that MA quenches the intrinsic fluorescence of BSA through static quenching mode. According to fluorescence quenching method, binding constant and the number of binding sites at different reaction times were obtained nearly same which indicated the complex MA–BSA could be stable for a long time. The distance between MA and BSA, 5.20 nm, was also obtained according to FRET theory.
Tanwir et al. (2012) studied [80] the interaction between metformin hydrochloride and BSA. They demonstrated that the fluorescence quenching of BSA by metformin hydrochloride is a result of the formation of metformin hydrochloride-BSA complex with probable involvement of tryptophan residue. Their results also showed that the hydrogen bond and the hydrophobic forces play a major role for metformin hydrochloride-BSA association.
Khan et al. (2008) reported [81] interaction of mitoxantrone (MTX) with HSA. The data of fluorescence spectroscopy indicated the changes in microenvironment of HSA induced by the binding of MTX and revealed a complex formation at 1:1 mole ratio. MTX could bind HSA through the hydrophobic force, electrostatic interactions and hydrogen bonding.
Sharma and Pancholi (2014) showed [82] protein binding interaction study of olmesartan medoxomil and its metabolite olmesartan with BSA by fluorescence spectroscopy and results showed that BSA fluorescence quenched by olmesartan medoxomil and its metabolite through static quenching mechanism. The binding constant values suggested that the drug and metabolite binds to the high affinity binding sites of BSA.
Yang et al. (2013) showed [83] the interaction of HSA with osthole. Osthole can quench the fluorescence of HSA and the quenching mechanism is a static process and the value of binding constant decreased with rise of temperature and the acting forces were mainly electrostatic, which played the major role in the interaction of osthole with HSA. Synchronous fluorescence spectra showed that the microenvironment and conformation of HSA were changed in the presence of osthole.
One of the crucial steps in developing a new and effective drug is studying and understanding its ability to bind to albumins, as serum albumin play a key role in the transport, distribution, metabolism and excretion of drugs molecules. Keeping this in mind few spectroscopic studies of interaction between BSA/HSA and various drugs has been discussed in this review. Moreover, the simple and important spectroscopic instrumental techniques like fluorescence, UV-Vis absorption and circular dichroism spectroscopy has been discussed to study the type and strength of the drug-BSA/HSA interactions in the present discussion.
Swarup Roy is thankful to the Department of Science and Technology (New Delhi, India) for a DST INSPIRE fellowship (IF 110421).