Research & Reviews: Journal of Pharmacology and Toxicological Studies
e-ISSN: 2322-0139 p-ISSN: 2322-0120
e-ISSN: 2322-0139 p-ISSN: 2322-0120
Department of Pharmaceutics, School of Pharmaceutical Sciences of Araraquara, Univ Estadual Paulista - UNESP, Araraquara, São Paulo, Brazil
Received date: March 29, 2018; Accepted date: April 20, 2018; Published date: April 27, 2018
Visit for more related articles at Research & Reviews: Journal of Pharmacology and Toxicological Studies
An effective therapeutic agent is essential for the control of many infectious diseases which can predict for the present time social and economic high costs. Ertapenem sodium (ERTM) is a synthetic antimicrobial agent of the class of carbapenems that have action against Gram-negative, Gram-positive, aerobic and anaerobic microorganisms. The lack of new effective antibiotics against multidrug-resistant pathogens is a constant concern. The progress of resistance to carbapenems is an alarming problem, since those are considered one of the most important drugs for the treatment of severe infections caused by enterobacteria. Thus, it is necessary to investigate the changes in the pharmacological profile of carbapenems. Microbiological methods are required for an antimicrobial effectiveness evaluation. In turbidimetric assay, the potency of a drug is determined by measuring the turbidity (absorbance), caused by the inhibition of microorganisms. This study presents an efficient, accurate, reproducible, low cost and microbiological assay which is highly relevant in the pharmaceutical industry to quantify ertapenem sodium. For performing the method, Staphylococcus aureus (ATCC 26923) was used as the test microorganism and the culture medium chosen was the Brain Heart Infusion broth - as the BHI. Validation parameters were in accordance with the specifications of ICH and demonstrated accuracy, precision, selectivity and robustness, with linear tracks 12.80; 16.00 and 20.00 μg mL-1. The turbidimetric assay is more versatile, faster and easier to apply than agar diffusion one. The method is simple and can be used in routine analysis of quality control of ertapenem sodium in the pharmaceutical industry.
Bioassay, Ertapenem sodium, Method validation, Microbiological assay, Quality control, Turbidimetric assay
Antimicrobials constitute the class of most commonly prescribed drugs. However, the lack of new effective antibiotics against multidrug-resistant pathogens is a constant concern. Ertapenem sodium stands out among the other carbepenems, which are currently available as the first with unique chemical characteristics that make it more resistant to β-lactamase enzymes, with activity against aerobic and anaerobic microorganisms, which represent a breakthrough for this group. It is noteworthy that few antimicrobials are currently available with a spectrum of activity against aerobic and anaerobic microorganisms [1,2].
Ertapenem sodium is distinguished from the other carbapenems by possessing an anionic side chain composed of a grouping of benzoate. The substituted benzoic acid target is crucial to maintain its antibacterial spectrum Gram-negative; moreover, it increases its molecular weight and lipophilicity, and the carboxylic acid unit ionized at physiological pH results in a net negative charge. As a result, ertapenem is highly bound to plasma proteins (approximately 95%) extending its half-life, allowing the convenience of being administered only once daily [1-4]. Furthermore, it is more stable to renal dehydropeptidase, not requiring the addition of inhibitor of this enzyme as other similar carbapenems [5]. The chemical structure of ertapenem sodium is shown in Figure 1.

Figure 1: Chemical structure of ertapenem sodium (CAS 153773-82-1). Source: DrugBank: Open Data Drug & Drug Target Database, 2014.
Although carbapenems are the most potent β-lactam and their broad spectrum of activity includes many of the microorganisms resistant to penicillin and cephalosporin, the development of carbapenem-resistant microorganisms is an emerging threat, with several reports in the literature [6-8].
There are numerous factors which can cause the emergence of antimicrobial-resistant microorganisms; this is a natural process of evolution of microorganisms as a defense mechanism, but the incorrect or indiscriminate use of these drugs facilitates the emergence of resistant pathogens, interfering in therapy. Another factor which may favor the development of resistant pathogens is the poor quality of these products; therefore, preventive measures are essential to minimize the emergence of resistant microorganisms, once the development of new antibiotics capable of fighting them requires time and high costs.
The progress of resistance to carbapenems is an alarming problem, once those are considered one of the most important drugs for the treatment of severe infections caused by enterobacteria. Thus, it is necessary to investigate the changes in the pharmacological profile of carbapenems [9]. The quality control laboratory is extremely significant in the prevention and control of infectious diseases [10]. However, there are not in the literature until this date, validated microbiological methods to evaluate average percentage of ERTM in the pharmaceutical form to be used in quality control. On the other hand, agar diffusion assay has been used to evaluate the activity against various microorganisms [11,12].
The microbiological tests, which are able to provide fast and accurate laboratory results, have become crucial [10]. It is well known that it is the responsibility of the pharmaceutical company to evaluate the potency of antimicrobials against the microorganism. Our research group has been trying to show that turbidimetric assay is an alternative method and has the advantage of being much faster than the diffusion in agar method since the duration of incubation period in turbidimetric assay requires only 4 h in contrast with the diffusion in agar, which typically requires more than 20 hours of incubation. Turbidimetric bioassay is an excellent method to evaluate average percentage of ERTM and currently it has been successfully used for quantification of antimicrobial agents [13-22].
In this context, there has been a growing concern about the quality of the drugs in use and the importance of “awareness” or critical awareness about the problem is emphasized. Effective and reliable analytical methods capable of quantifying the amount of antimicrobials, as well as evaluating their activity, are essential for assessing the quality of the product because the dosage of antimicrobial agent should be enough to inhibit the growth of the microorganism responsible for the infection, not allowing the return of the disease.
Ertapenem sodium is an antimicrobial agent that has been used as a therapeutic agent for the treatment of various infectious diseases with the approval by the FDA, 2001 [1] however there is still no monograph about it in any official compendium. There are few published analytical methods of ertapenem in both biological matrices and drugs [23-26]. Since no infrared quantitative method has been validated using ertapenem, the purpose of this research was to develop a new simple, ecological and robust IR method using small volume of broth without extensive sample processing and no residues generation.
Chemicals and reagents
Ertapenem sodium 98.8% (ID number 1407011333e) and ertapenem sodiumin lyophilized powder for injection (lot EB004C1) both kindly donated by Merck Sharp &DohmeTM. The culture medium used was Brain Heart Infusion – BHI broth (OxoidTM). Formaldehyde analytical grade, used to stop the growth of microorganisms, was purchased from (QhemisTM). Purified water (MilliporeTM, USA) was used in both methods for prepare the solutions.
Apparatus
A vertical autoclave AV model (Phoenix Luferco, SP, Brazil) was used for sterilizing the culture media for 15 minutes at 121°C. In addition, we used purified water, ferrules and test tubes of 25 mm diameter x 150 mm height, containing the culture medium and duly sealed with cotton plug wrapped in gauze. Incubation of micro-organisms was performed using a Shaker incubator MA420 model (Marconi, SP, Brazil) and an oven ECB Digital 1.2 (Odontobrás, SP, Brazil). The readings, a spectrophotometer DU 530 was used (Beckman Coulter, CA, USA). Micropipettor Eppendorf of 100-1000 μL, analytical balance model H10 (Mettler Toledo, Switzerland) and semi-analytical balance model B160 (Micronal, SP, Brazil) were used. The software Microsoft Excel (2010) was used to construct the calibration curves.
Solutions
Preparation of ERTM RS Solutions: ERTM RS stock solution was prepared by transferring 10 mg equivalent of ERTM RS to a 50 mL volumetric flask, which was filled with ultrapure water to obtain a concentration of 200 μg mL-1. Aliquots of 640, 800 and 1000 μL of the ERTM RS stock solution were transferred to 10 mL volumetric flasks, the volumes were completed with ultrapure water, for obtaining working solutions with concentrations of 12.8, 16.0 and 20.0 μg mL-1, which were represented as S1, S2 and S3, respectively.
Preparation of ERTM in lyophilized powder for injectionsolution: Five vials of ERTM lyophilized powder (commercially available for the preparation of injection solutions) were weighed, and the average weight was calculated. The contents of these vials were mixed. The ERTM in lyophilized powder for solution for injection stock solution was performed in the same way of the preparation of ERTM RS solutions previously described. These solutions were respectively named T1, T2 and T3.
Preparation of culture medium
The medium was prepared as indicated in its respective label being dissolved in ultrapure water under heating, distributed in test tubes (10 mL/tube) and autoclaved (conditions: 121°C, 1 atm) for 15 min.
Bioassay
The strain of Staphylococcus aureus ATCC 26923 was cultivated and maintained on tryptic soy agar medium in a refrigerator and the culture was transferred to BHI broth and kept at 35ºC ± 2ºC for 24 h before the assay. The microorganism standardization was carried out according to the procedure described in the Brazilian Pharmacopoeia, 2010. The bacteria, previously incubated in BHI broth, were diluted with BHI broth to achieve a suspension turbidity of 25 ± 2% (transmittance) and the turbidity was measured using a spectrophotometer with the wavelength at 580 nm using a 10 mm absorption cell, against BHI broth as the blank. Aliquots of 0.8 mL of this standardized suspension were added to each 10 mL of BHI broth. Three concentrations of aqueous solution of ertapenem sodium reference standard were added in three different test-tubes containing 10 mL of sterile BHI culture medium respectively (S1, S2 and S3). The same procedure was carried out for ertapenem sodium test sample (T1, T2 and T3) and this was done in triplicate, according to parallel lines 3 x 3 test described in the Brazilian Pharmacopoeia. Then, the test-tubes were incubated in a shaker at the temperature of 35.0°C ± 1.0°C for 4 hours. After that, the growth of microorganisms was inhibited by the addition of 0.5 mL of 12% formaldehyde solution to each test tube. Finally, the absorbance was determined in a spectrophotometer at 530 nm.
Calculation and method validation
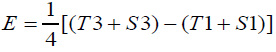
To calculate the ERTM activity, the linear parallel mode was used from Hewitt Equation 1 (Hewitt, 2003).
Equation 1. Hewitt equation
Potency (%) = AntilogM × 100
M = F/b
b = E/L
Where:
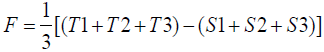
I = logarithm of the ratio of doses
This method was validated according to the International Conference on Harmonization guidelines (ICH, 2005) [27], Harmonized Guidelines for Single Laboratory Validation of Methods of Analysis by IUPAC (IUPAC, 2002) [28] and Analytical Procedures and Methods Validation for Drugs and Biologics by FDA (FDA, 2015) [29], for linearity, selectivity, accuracy, precision, robustness, and both detection and quantification limit.
Linearity: The linearity was evaluated by regression analysis of ertapenem sodium. The analytical curve was built by plotting the logarithm of the concentration versus the average of the absorbance values, with the average absorbance value of each ERTM concentration–RS at concentration range 12.8; 16.0 and 20.0 μg mL-1. The assay was performed in triplicate on three different days. The regression lines were calculated by the least-squares method. Statistical evaluation was made by ANOVA. The values were reported as the average ± S.D. of the calibration curves.
Precision: Precision was carried out by repeatability (intra-day precision) and intermediate precision (inter-day precision). The repeatability was studied by the performance of seven determinations of the sample in the median concentration calibration curve (16 μg mL-1). Solutions were prepared and analyzed the same day under the same experimental condition, while the intermediate precision was evaluated by the average RSD percentage obtained in three analytical curves performed on different days (interday) and two different analysts (between analysts).
Robustness: The robustness of the method was evaluated, by making small alterations of the parameters, to show that the validity of the method is maintained, though. The following parameters were varied: wavelength (528, 530, and 532 nm), culture medium brand (BHI-OxoidTM and BHI-BD-BactoTM) and different instruments (spectrophotometer model DU 530 UV-Vis and model UV-1800, both Shimadzu).
The analysis of the average percentage of ERTM in lyophilized powder for injectionwas conducted in normal conditions and, in parallel; it was altered for assessing interference of changes in the result. The obtained responses were evaluated according to the R.S.D. among the dosages.
Accuracy: Accuracy was achieved via the recovery assay, in which a known quantity of RS was added to a known quantity of the sample (ICH, 2005)[27]. The recovery was performed in the three levels, R1, R2 and R3, and the ERTM was prepared according to Table 1, in triplicate.
| 1ERTM API (µg mL-1) |
ERTM RS2 (µg mL-1) |
Final concentration (µg mL-1) |
% | |
|---|---|---|---|---|
| API | 12.80 | ___ | 12.80 | ___ |
| R1 | 12.80 | 0.40 | 13.20 | 80 |
| R2 | 12.80 | 3.70 | 16.50 | 100 |
| R3 | 12.80 | 7.00 | 19.80 | 120 |
| RS | ___ | 12.80 | 12.80 | ___ |
Table 1: Preparation of the solutions to the recovery test of turbidimetric bioassay for ertapenem sodium
Each simulated sample (R1, R2 and R3) was assayed in an independent trial. The percentage of recovery (R%) was calculated by Equation 2 determined by the Association of Official Analytical Chemists (AOAC, 2002) [29].
Equation 2. Percentage of recovery calculation – R%
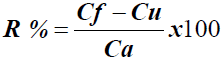
Where:
Cf is the total drug concentration measured after addition of the standard
Cu is the total drug concentration in the formulation
Ca is the standard concentration added to the formulation
The pharmaceutical industries have boosted the pharmaceutical market, by representing an important economic source. The development of methods for the quantitation of drugs in the production process is essential for the quality control of these products within the pharmaceutical industry. Quality control in the pharmaceutical industry is extremely important in the process of obtaining drugs with quality, safety, effectiveness, and credibility for the population who will consume it.
It is the responsibility of quality control measures in the pharmaceutical industry to develop and validate methods based on recognized official references. Furthermore, it requires personal and professional qualifications, optimization of processes, reducing waste and time, standardization of procedures, and equipment calibration in the physical-chemical analysis laboratory.
Effective and reliable analytical methods capable of quantifying the amount of antimicrobials, as well as evaluating their activity, are essential for assessing the quality of the product because the dosage of antimicrobial agents should be enough to inhibit the growth of the microorganism responsible for the infection, while not allowing the disease to return. One factor that may favor the development of resistant pathogens is the poor quality of these products. Hence, preventive measures as the correct quantification of these products due to quality control are essential to minimize the emergence of resistant microorganisms, since the development of new antibiotics, which are capable of fighting them, requires time and high costs. In this context, quality control has a key role in ensuring the correct dosage, by contributing preventively to minimize the development of resistant microorganisms.
Previous tests were performed to standardize the best parameters to be used in the method. The parameters such as microorganism, culture medium, incubation time and temperature, diluent, and the drug inoculum concentrations of the drug were varied. The parameters, which together provided accurate and reproducible results, were selected for the development of the method and are shown in Table 2.
| PARAMETERS | DESCRIPTION |
|---|---|
| Microorganism | Staphylococcus aureus ATCC 26923 |
| Culture medium | Brain Heart Infusion broth - BHI |
| Incubation time | 4 h |
| Incubation temperature | 35°C |
| Inoculum concentration | 8 % |
| Diluent solution | Water |
Table 2: Standard parameters for the evaluation of ERTM-API turbidimetric method.
The methods were validated by following the guidelines for validation of analytical methods according to the recommendation of the International Conference on Harmonization, 2005, the guidelines of Brazil 2003, and FDA, 2015 [27,29-31]. The parameters analyzed were: linearity, precision, accuracy, selectivity and robustness. The microorganism Staphylococcus aureus shows excellent results, by showing linear and reproducible growth. The method was linear in the concentrations 12.80; 16.00 and 20.00 μg L-1, which allowed average percentage sample assays around 100% with proper parallelism in relation to the straight standard. Table 3 showed the absorbance values obtained by the solutions in different concentrations ERTM RS and ERTM in lyophilized powder for solution for injection for evaluating the method linearity.
| Absorbance | ||||||
|---|---|---|---|---|---|---|
| S1 | S2 | S3 | T1 | T2 | T3 | |
| 0.769 | 0.517 | 0.255 | 0.772 | 0.519 | 0.254 | |
| 0.767 | 0.522 | 0.250 | 0.774 | 0.514 | 0.247 | |
| 0.747 | 0.509 | 0.251 | 0.750 | 0.513 | 0.259 | |
| Averagea | 0.761 | 0.516 | 0.252 | 0.765 | 0.515 | 0.253 |
| RSDb | 1.65 | 1.23 | 1.05 | 1.79 | 0.64 | 2.31 |
Table 3: Absorbance obtained in the microbiological assay linearity evaluation in turbidimetric bioassay.
The analytical curve for ERTM was built by plotting the average absorbance values of three analytical curves in relation to the logarithm of the concentrations (Figure 2).

Figure 2: Analytical curve of ertapenem sodium ERTM at concentrations of 12.80; 16.00 and 20.00 μg mL-1, obtained by the microbiological method of turbidimetric bioassay.
The analytical curve of ertapenem sodium RS was evaluated by ANOVA (Table 4).
| Source of variation | Degree of freedom | Sum of squares | Quadratic means | F calculated | F critical |
|---|---|---|---|---|---|
| Preparation | 1 | 0.00001 | 0.00001 | 0.18 | 4.96 |
| Regression | 1 | 0.78200 | 0.78200 | 13989.28* | 4.96 |
| Deviation Parallelism | 1 | 0.00001 | 0.00001 | 0.17 | 4.96 |
| Quadratic | 1 | 0.00024 | 0.00024 | 4.21 | 4.96 |
| Square difference | 1 | 0.00001 | 0.00001 | 0.19 | 4.96 |
| Between doses | 5 | 0.78227 | 0.15645 | 2798.80* | 3.33 |
| Between tubes | 2 | 0.00032 | 0.00016 | 2.83 | 4.10 |
| In (error) | 10 | 0.00056 | 0.00006 | __ | __ |
| Total | 17 | 0.78314 | __ | __ | __ |
Table 4: Absorbance Variance Analysis, determined in obtaining the analytical ERTM curves, using the turbidimetric bioass.
The method proved to be accurate, robust and exact, in other words, the proposed method has capacity to generate, for the same sample, reproducible results with low response variation between independent assays.
Microbiological method has peculiarities and it is analyzed differently from traditional analytical methods. The analytical curve for the turbidimetric assay was performed according to parallel lines 3 x 3 described in the Brazilian Pharmacopoeia (2010). The average percentage of the drug was calculated by the equation of Hewitt [32]. The equation of Hewitt uses the averages of the absorbance readings of the solutions obtained with the three doses of ERTM RS and lyophilized powder for injection solution, performed in triplicate and analyzed in each test.
In addition, this bioassay is a method to evaluate the quality of the antibiotic not being necessary to investigate the minimal inhibitory concentration value (MIC). The whole procedure was performed according to the recommendations described in the Brazilian pharmacopoeia (2010).
Therefore, bioassays continue to play an essential role in manufacturing and quality control of antibiotic medicines. The turbidimetric method provides important information about the biological activity of the pharmaceutical product and requires a lower run time than that required for the agar diffusion assay. Thus, both methods together create the perfect combination to evaluate the quality of antimicrobial and effectiveness against bacteria.
Henceforth, this study presents a turbidimetric assay, whereby the potency of a drug is determined by measuring the turbidity (absorbance), caused by the inhibition of microorganisms. Preliminary tests were performed to standardize the best parameters to be used in the method. The parameters, which together provided accurate and reproducible results, were selected for the development of the method and are shown in Table 5.
| PARAMETERS | RESULTS |
|---|---|
| Linearity | y = -1.140Ln(x) + 3.6706, r = 0.9996 standard y = -1.148Ln(x) + 3.6942, r = 0.9998 API |
| Intra-day precision | RSD = 1.25% |
| Inter-day precision | 1st day = 99.89%; 2nd day = 100.11% and 3rd day = 99.59% - RSD = 0.26 % 1st analyst = 99.46% and 2nd analyst = 99.26 % RSD = 0.15% |
| Robustness | λ 528 nm = 99.23%; 530 nm = 100.31%; 532 nm = 99,56% - RSD = 0.55 |
| Spectrophotometer - DU 530 UV-Vis =99.17%, UV-1800= 100.12%, RSD = 0.67% | |
| Culture medium Brand - OxoidTM= 99.61% and BD-BactoTM= 99.12%, RSD = 0.35% | |
| Accuracy | 98.20 %, RSD = 0.77 % |
Table 5: Results of method validation using the turbidimetric bioassa.
The microorganism Staphylococcus aureus shows excellent results, by showing linear and reproducible growth. The method was linear in the concentrations 12.80; 16.00 and 20.00 μg/mL, which allowed the average percentage sample assays to be around 100% with proper parallelism in relation to the straight standard. The analytical curve for ERTM was built by plotting the average absorbance values of three analytical curves in relation to the logarithm of the concentrations (Figure 2).
The methods developed here do not use any organic solvents for analysis and therefore are considered environmentally friendly because they do not cause any concern for chemical waste or risk of exposure to laboratory workers. Therefore, the proposed methods are useful for the quality control of ERTM in pharmaceutical products.
The results obtained with the microbiological assay by turbidimetry were comparable with those obtained by UV spectrophotometry by test t-Student to verify if two methods are interchangeable. Analysis of variance indicated no significant differences between these methods (p=0.25).
Physical-chemical tests are often used as routine methods for the quantification of drugs in the pharmaceutical industry. However, it is known that these methods are not able to evaluate the microbiological activity by themselves. In this context the biological tests, allies to the physical-chemical assays, must be used for routine analysis. The turbidimetric test is appropriate, simple and especially a rapid method compared to traditional tests by agar diffusion. The method by agar diffusion has, among its limitations, the difficulty of diffusivity of some drugs in the solid medium, it is also essential to have well defined inhibition zones, with suitable diameter for validation and further on it is possible that there is reactivity between the culture medium and the drug in certain cases [20,33-39].
Such interfering factors are decreased in the turbidimetric method, since the test is performed in broth as culture medium. All parameters evaluated in the method validation were satisfactory, as well as the results of regression and parallelism. This paper proposes a faster, easier to apply and feasible implementation method for the evaluation of average percentage ertapenem sodium in lyophilized powder for solution for injection, which is safe and complies with the provisions of national and international guides.
We are very grateful to the laboratory Merck Sharp & Dohme for donating the drug, and FAPESP - Fundação de Amparo à Pesquisa do Estado de São Paulo, Brazil, Project 2013/12959-0 and 2015/03412-3, and CNPq (Conselho Nacional de DesenvolvimentoCientífico e Tecnológico, National Counsel of Technological and Scientific Development, Brasília, Brazil) for financial support.
The authors report no declarations of interest.