Research & Reviews: Journal of Agriculture and Allied Sciences
ISSN: E 2347-226X, P 2319-9857
ISSN: E 2347-226X, P 2319-9857
Offar Gwandi*, Adewuyi KA
Department of Agricultural Technology Federal Polytechnic institute, Mubi, Adamawa State, Nigeria
Received: 03-Jun-2022, Manuscript No. JAAS-22-65829; Editor assigned: 06-Jun-2022, Pre QC No. JAAS-22-65829 (PQ); Reviewed: 20-Jun-2022, QC No. JAAS-22-65829; Revised: 03-Aug-2022, Manuscript No. JAAS-22-65829 (R); Published: 10-Aug-2022, DOI: 10.4172/2347-226X.11.4.005
Visit for more related articles at Research & Reviews: Journal of Agriculture and Allied Sciences
The subject of improving livelihood security for the people of the North-Eastern part of Nigeria is an issue of important need, as it is indispensable for the maintenance of human life. This research focuses on the empirical assessment of farmers’ livelihood security in the north-eastern region of Nigeria. The objectives of the study were to identify the socio-economic characteristics of the farmers and to assess the livelihood security status among the farmers in the study area. Data were collected from 435 randomly selected farmers in three states of the North-Eastern region with the aid of structured questionnaires. Data analyses were carried out using descriptive statistics involving the use of frequency distribution, percentages, mean and standard deviation, and inferential statistics involving the use of livelihood security index. The results revealed that male farmers constituted the majority (73.17%) of the respondents married with a mean age of 41 years. The respondents were mostly small-scale farmers, and they cultivated an average of 3.5 hectares of farmland. The results of the Livelihood Security index revealed the score value of 0.31 for economic security, food security 0.17, health security 0.33, habitat security 0.49, education security 0.33 and social security scored the highest with 0.77. The overall Household Security Index of the farmers scored a value of 0.40 indicating a low position of livelihood security status of the farmers in the study area. The study recommends the need to focus on growth development programs in which the majority of the poor can earn income and will certainly have a greater impact on reducing poverty, consequently leading to improved livelihood security.
Empirical assessment; Farmers’ livelihood security
Agriculture is an important sector in all economies of the world and contributes enormously to national wealth. Agriculture occupies an important place in human development chain and provides employment for over 70 percent of the population [1]. Rural families in the developing world depend on agriculture and natural resources to meet subsistence needs and generate livelihoods. Agriculture plays a great role in the alleviation of poverty and increases the means of families. The significance of agricultural growth in reducing poverty is probably greater than its role in reviving economic growth in general, especially in the countries that are poor. In reality, the extremely poor world depends largely on agricultural enterprise and its related activities as fundamental contributions to their livelihoods. Hence the need for greater agricultural growth requires the involvement of small producers and generates employment (especially for unskilled ones) for the poor.
The sector is, however, currently facing serious challenges, especially in the North Eastern part of Nigeria because of the insurgency that ravel the area. The rising incidence of insecurity, kidnaping and volatile economic crisis, and even climate related disasters have increased agricultural risks, vulnerabilities, and stress on families, and on people, beyond the existing pressures of living. While it has made large strides in achieving the agricultural development goals of food security, availability and accessibility through the government’s transformation programme which is meant to wean Nigeria off food imports by boosting domestic food production; it is still being challenged by a formidable agrarian crisis. This situation requires urgent assessment with the view to proffer solutions. Hence the need for the assessment of farmers’ livelihood security in the North Eastern part of Nigeria.
The study area
The study was carried out in the North Eastern states of Nigeria comprising Borno, Adamawa, Taraba, Adamawa and Gombe State. These are states in the northern parts of Nigeria that suffer most from insurgent activities, farmers/herdsmen clash recently. They are notable for the cultivation of annual crops such as maize, millet, cowpea, groundnut etc. majority of farmers in these areas rear live-stocks such as cattle, goats, sheep, poultry etc (Figure 1).

Figure 1: Map of Nigeria showing the North Eastern States.
Sampling technique
Primary data for this study was collected through the use of structured questionnaires. Four hundred and fifty (450) questionnaires were distributed by enumerators using multi-stage sampling survey for the study. The first stage involved purposive sampling of three States within the Region that are most hit by insurgency, communal crisis and farmers/herdsmen clashes in recent time’s i.e Taraba, Adamawa and Gombe State. Secondly, two Local Government Areas was randomly selected from each of the sampled states. The third stage involved random sampling of seventy five farmers from each of the Local Government Areas to give one hundred (150) per state. Thus, sums of four hundred and thirty-five (435) farmers were finally contacted for the survey.
Analytical framework
Data obtained from the field survey were analyzed using both descriptive and inferential statistics which include frequency distribution, means and standard deviation. Livelihood security index was used to assess the livelihood status among farmers in the North East, Nigeria.
Livelihood security index consisted of six livelihood outcomes and these were measured based on accessibility/availability, quality and status. To assess the different livelihood outcomes relevant indicators were selected from the standard menu indicators of CARE USA/Program Division/PHLS. Each indicator was ranked on a five - point ordinal scale and these ranges were calibrated to the situation of the villages. Livelihood security Indices such as food, economic, health, education, habitat and social net-work security were computed by aggregating all the scores of the selected indicators.
Since, each of the components was measured on a different scale, it is first necessary to standardize each component indicators as an index. The standardized indicators of a household were prepared using the method adopted to calculate human development index, and used by Jeyarajah, for any component of the LSI, the individual indices can be computed according to the general formula [2,3].
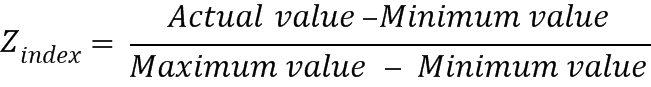
Each index thus ranges from 0 to 1. If the actual value of the variable is the minimum, the index is zero. If the actual value is equal to the maximum value, the index is one. Household Livelihood Security Index (HLSI) was calculated by averaging the standardized indicators by using the formula
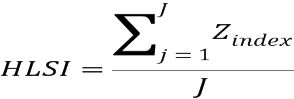
Where, J=no. of indicators
Health security
Merit is assigned base on accessibility to primary health care center (services) among farmers.
Health security index =  (i= 0 1,2,….,5)
Accessibility in Km, i.e., 0-2 km=5, 2-4 km=4, 4-6 km =3, 6-8 km = 2, 8-10 km=1, 10 km and above=0, wi=weights (0 to 5) and fi=No. of farmers.
Habitat security
This index is based on the value of household assets including dwelling house among farmers.
Educational security index
Education index shows the educational status of the sample farmers and it is calculated as

Education attained, i.e., Illiterate=0, Primary school=1, Middle school=2, Metric school=3, Twelfth standard=4, Graduate and above=5, wi=weights (0 to 5) and fi=No.of farmers.
Social security index
Social network status index shows the level of participation and access to various sources of information and it is calculated as
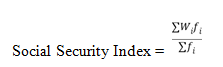
Social Security status attained, i.e. Access to support from friends/ neighborhood=1, Access to phone=2, Access to TV=3, Member at village level/block level=4, wi=weights (1 to 4) and fi= No. of farmers.
Socioeconomic characteristics
Socioeconomic characteristics is the combination of an economic and sociological total measure of a person’s economic and social position that is relative to others, based on gender, age, marital status, household size, education, experience, etc. These are discussed below as it relates to the respondents in the study area.
Gender distribution of the respondents: The findings of the result of the respondents by gender are presented in Table 1. Table 1 shows that 75.17% of the respondents were males, while 24.83% were female respondents. This implies that male gender dominates farming activities in the study area. This may be due to the fact that the responsibility of feeding and catering for the family is mainly the duty of male gender, and socio-cultural factors may be the explanation of low percentage of women participation in farming. This is in confirmation with the report of Jibowo and Atibioke, et al. that male gender has always dominate the agricultural activities [4,5]. Studies have also pointed out that the gender of the household head is associated with the possibility of accessing better livelihoods. This is to say, it has been suggested that the household headed by female gender are poorer and are more food insecure compared to households headed by male gender. This implies that women are more vulnerable than male as a result of lack of support and lack of labor supply. The household head as an important role in the decision making concerning resource allocation that improves the welfare of the household. Hebinck and Lent posit that the core of the decision making in the rural household are made by women and consequently become the principal providers as most of the income generating activities are done by them while the men have freedom of participating in different programs [6].
| Gender | No. | Percentage (%) |
|---|---|---|
| Male | 327 | 75.17 |
| Female | 108 | 24.83 |
| Total | 435 | 100 |
Source: Field survey 2021
Table 1. Respondents base on gender distribution.
Age of respondents
The result of the age of the respondents in Table 2 reveals that both young and old people are involved in farming activities. The distribution shows that majority (29.66%) of the respondents were between the ages of 31 to 40 years. The mean age of the respondents is 41.69 years with standard deviation of 13.40.
| Age (interval) years | Number | Percentage (%) |
|---|---|---|
| ≤ 20 | 18 | 4.14 |
| 21–30 | 87 | 20 |
| 31–40 | 129 | 29.66 |
| 41–50 | 106 | 24.37 |
| ≥ 51 | 95 | 21.84 |
| Total | 435 | 100 |
| Average | 41.69 | |
| Standard deviation | 13.4 |
Source: Field survey 2021
Table 2. Age distribution of respondents.
This implies significant variation in age of the respondents and it shows that they are relatively young and physically active. Gwandi reported that gender plays a vital role in influencing farmer’s adaptive capacity to better farming strategies and also is an important factor in agriculture because of its crucial part in the determination of farming activities.
Respondents marital status
The finding in Table 3 reveals that 70.34% of the respondents were married while 22.30% of the respondents were single. The involvement of married household farmers in agricultural production can be explained in terms of labor supply for agriculture. The family labour offered would be more when family heads are married.
| Marital status | Number | Percentage (%) |
|---|---|---|
| Single | 97 | 22.3 |
| Married | 306 | 70.34 |
| Divorced | 9 | 2.87 |
| Widow/widower | 23 | 5.29 |
| Total | 435 | 100 |
Source: Field survey, 2017
Table 3. Respondents distribution by marital status.
Household size
The findings of the result of size of household are given in Table 4. The findings of the result in Table 4 reveals that majority (51.95%) of the respondents have household size between 6 and above people, while 27.13% have household size of 4 to 5 people. The mean household size is 6.75 while the standard deviation is 4.38, justifying the fact that majority of the respondents are married. The number of people in families is very important for determining the availability of labour for agricultural work. It also affects household income and household food requirements. Gwandi reported that greater family size increases efficiency because most farmers are financially constrained and thus, the availability of family labour will ease hiring of labour. Generally, families that are large require more resources to meet their subsistence needs, and they will consequently have higher propensity to consume. Furthermore, large families will have more labor that will be mobilize for agricultural activities. The number of individuals residing in the household of respondent is what constitutes a household size. It was found by Chedchuchain and Otsuka that the size of household capture the quantity of human capital. This implies in a practical way that the availability of labor will serve as a basis for a household to decide whether to participate or not to participate in several income generating activities [7]. Machinery is not readily available for rural farmers. Human labor therefor serve as the only substitute and most income generating activities in the rural areas are heavily dependent on family labor because of their inability to buy modern machinery or even higher it.
| Household size | No. | % | Adult male | Adult female | ≥ 15 Children | ≤ 14 Children | ||||
|---|---|---|---|---|---|---|---|---|---|---|
| No | % | No | % | No | % | No | % | |||
| ≤ 1 | 56 | 12.87 | 202 | 46.44 | 203 | 46.67 | 281 | 64.6 | 248 | 57.01 |
| 3-Feb | 35 | 8.05 | 168 | 38.62 | 165 | 37.93 | 91 | 20.92 | 106 | 24.37 |
| 5-Apr | 118 | 27.13 | 56 | 12.87 | 47 | 10.8 | 40 | 9.2 | 64 | 14.71 |
| ≥ 6 | 226 | 51.95 | 9 | 2.07 | 20 | 4.6 | 23 | 5.08 | 17 | 3.91 |
| TOTAL | 435 | 100 | 435 | 100 | 435 | 100 | 435 | 100 | 435 | 100 |
| Mean | 6.75 | |||||||||
| STDev | 4.38 | |||||||||
Source: Field survey 2021
Table 4. Size of household.
Education of respondents
This is an important factor that determines the ability of an individual to understand and adopt policies/programmers that affect him/her. The educational distribution of the respondents is presented in Table 5. The finding reveals that majority (91.03%) of the respondents had formal education, while only 8.97% had no formal education. The mean years of formal education is 2.61 while the standard deviation is 1.20, which indicates that majority of the respondents have attained at least a primary education. This study reveals that the level of literacy is high among respondents and this could have consequences for agricultural production in the areas. Formal education is a serious element in influencing farmers' ability to adopt new agricultural innovations effectively, as reported by Mustapha, et al. [8]. One of the factors that enable farmers to acquire necessary information and process it for effective use is educational attainment. The possibility of educational level to influence the livelihood strategies of household farmers and to determine the income they derive from various activities undertaken by them is high. These collaborate with the suggestion of Yunez and Taylor that educational attainment by farmers is necessary for raising their economic productivity and efficiency in agricultural production which in turn will go a long way in combating poverty [9].
| Educational level | Frequency | Percentage (%) |
|---|---|---|
| No formal education | 39 | 8.97 |
| Primary education | 49 | 11.26 |
| Secondary education | 248 | 57.01 |
| Tertiary education | 99 | 22.76 |
| Total | 435 | 100 |
| Mean | 2.61 | |
| Standard deviation | 1.2 |
Source: Field survey 2021
Table 5. Respondents educational attainment.
Respondent’s primary occupation
The main occupation of the respondents in the Study areas is presented in Table 6. The result from the table shows that majority (62%) of the respondents was full-time farmers and majority (66.90%) of the respondents also indicated farming as their secondary occupation.
| Type of occupation | Primary occupation | Secondary occupation | ||
|---|---|---|---|---|
| Frequency | Percentage (%) | Frequency | Percentage (%) | |
| Farming | 273 | 62.76 | 291 | 66.9 |
| Civil Service | 97 | 22.3 | 47 | 10.8 |
| Business | 57 | 13.1 | 93 | 21.38 |
| Others | 8 | 1.84 | 4 | 0.92 |
| Total | 435 | 100 | 435 | 100 |
Source: Field survey 2021
Table 6. Respondents main occupation.
This shows farming an activity is the most common occupation in the study areas. This implies that the respondents the study areas depend on agriculture for their livelihood.
Respondents experience of farming
Presented in Table 7 is the farming experience of the respondents in the study area. From the result it can be seen that majority (38.40%) of the respondents had between 1 to 10 years of experience in agricultural production, the mean years of farming experience 18.78 years while the standard deviation is 13.06.
| Farming experience (years) | Frequency | Percentage (%) |
|---|---|---|
| ≤ 10 | 167 | 38.4 |
| 20-Nov | 139 | 31.95 |
| 21-30 | 51 | 11.72 |
| 31–40 | 52 | 11.95 |
| ≥ 41 | 26 | 5.98 |
| Total | 435 | 100 |
| Mean | 18.78 | |
| Standard deviation | 13.06 |
Source: Field survey 2021
Table 7. Respondents farming experience.
Respondents size of farm
The finding of the result of the respondent’s distribution based on farm size in Table 8. Table 8 reveals that majority (44.4%) of the respondents cultivated 2 to 3 hectares of farm land, while 20.46% and 21.83% cultivated ≤ 1 and between 4-5 hectares respectively. The mean farm size of the respondents is 3.53 hectares and the standard deviation is 3.14. Farm size or land holding is possibly the most important single resource as it is a base for any economic activities especially in rural and agricultural sector. Farm size influence household’s decision to partake or not to participate in different livelihood expansion activities.
| Farm size | Frequency | Percentage (%) |
|---|---|---|
| ≤ 1 | 89 | 20.46 |
| 2 – 3 | 192 | 44.14 |
| 4 – 5 | 95 | 21.84 |
| ≥ 6 | 59 | 13.56 |
| Total | 435 | 100 |
| Mean | 3.53 | |
| Standard deviation | 3.14 |
Source: Field survey 2021
Table 8. Respondents farm size.
Livelihood security
The livelihood security index is very important to determine whether the livelihood is successful in following their livelihood strategies. Six different livelihood security indicators were constructed based on the prevailing condition of farmers’ households in the study area. The indices can be used for measuring the improvement of situation of sampled households. Livelihood indices were calculated using standardized value of indicators of the relevant variable. The indicators chosen for this study were based on the literature review of previous researches. Each indicator was measured in a different scale. It was first necessary to standardize each indicator as an index for relevant indicator. The index score of indicator ranged from 0 to 1. Higher value of the indicator implies households are better off and more secured in terms of their livelihood.
Economic security: Economic security is the condition of having stable income or other resources to support a standard of living now and in the future. It is the capacity to generate sufficient income to satisfy the basic needs and to maintain or increase the stability of income. Annual income per farmer as economic security indicator was selected in the present study. The economic security index was calculated using standardized value of this indicator. Standardization was done using their village level maximum and minimum value of the indicator.
The average annual income of farmer was ₦493929. Economic security index of the farmers was 0.31 in the study area. This implies that the farmers’ households are economically and relatively not secured.
Food security: FAO defined the food security as “A situation that exists when all people, at all times, have physical, social and economic access to sufficient, safe and nutritious food that meets their dietary needs and food preferences for an active and healthy life. Household food security has been defined as “sufficient food consumption by all people at all times for a healthy and productive life”
Food security indicator like monthly food consumption expenditure was selected in the present study. The average monthly food consumption expenditure of farmer was ₦123,618.5. The index of the food security scored a value of 0.17. It highlights that food security had a relatively poor position among the farmers in the present research.
Health security
The definition of health security is the capacity of individuals to identify, prevent and manage significant risks to their health. In the present research, indicator like accessibility to primary health care services was used to measure the health security of farmers in the study area (Table 9).
| Accessibility (Distance in Km) | Frequency | Percentage (%) |
|---|---|---|
| ≤ 1 | 169 | 38.85 |
| 2–3 | 145 | 33.33 |
| 4–5 | 55 | 12.64 |
| 6–7 | 26 | 5.1 |
| ≥ 8 | 40 | 9.2 |
| Total | 435 | 100 |
| Health security index | 0.33 |
Source: Field survey 2021
Table 9. Accessibility to primary (Basic) health care center in the study area.
The index of the health security scored a value of 0.33 in the area. The present study confirmed that the health security in terms of accessibility of primary health care services was significantly low. This might be due to the low number of primary health care center at the village level. It should be noted that the value is below the mid-point. This indicated more vulnerability to the basic health security of the farmers in the study area. This implies that the farmer in the study area needs health facilities for their better living.
Habitat security: Habitat of the farm households is also one of the factors which influence the livelihood of household. Shyamalie and Saini defined habitat security as the access of individuals to an adequate shelter and its related resource to ensure that they have a healthy and sanitary environment, protection from detrimental elements to enable safe and secure livelihoods [10]. In other words, habitat security consists of housing with basic amenities such as quality of the shelter, access to safe drinking water, good sanitation facilities and acceptable environment of house. The index of the habitat security scored a value of 0.49. This implies that the farmers in the study area are relatively secured in terms habitat security.
Educational security: Education is the important necessity of life. Level of education at the individual as well as household level, availability and accessibility of educational institutes and monthly expenditure on education are the major determinants of educational security of households.
In the study area, based on the educational level of the farmers, an educational index was calculated. It was found that majority (58.62%) had attended formal education while 41.38% of the respondents had no formal education. The educational security index of the respondents in the study area was 0.33 [11]. This implies that the respondent are less educationally secured perhaps due lack of availability and accessibility of educational institutions (Table 10).
| Level of education | Frequency | Percentage (%) |
|---|---|---|
| No formal education | 180 | 41.38 |
| Primary education | 68 | 15.63 |
| Secondary education | 57 | 13.1 |
| Tertiary education | 130 | 29.89 |
| Total | 435 | 100 |
| Educational security index | 0.33 |
Source: Field survey 2021
Table 10. Education levels of farmers in the study area.
Social security: The social security refers to the capacity of the individuals to maintain and participated in the social networks that enable them to pursue sustainable livelihood by reducing risks, accessing resources and information. Social network is nothing but the level of participation by the farmers in organizations like Co-operatives, Self-help Groups and other organizations. Access to support from friends/neighbourhood and access to social network elements like phone and television is another factor which determines the social network status of households.
The analysis of social network status of farmers revealed that majority (74.02%) participated in social organizations, majority 60.46 had access to TV and majority (74.02%) had access to phone while majority (94.25%) indicated that they don’t belong to any cooperative membership. An index of social network status was 0.77. This implies that that the social security index of the respondents in the study area is high, indicating a more social security among the farmers (Table 11).
| Particulars | Organizational participation | Access to TV | Access to phone | Cooperative membership | ||||
|---|---|---|---|---|---|---|---|---|
| Frequency | % | Frequency | % | Frequency | % | Frequency | % | |
| No | 113 | 25.1 | 172 | 39.54 | 113 | 25.1 | 410 | 94.25 |
| Yes | 322 | 74.02 | 263 | 60.46 | 322 | 74.02 | 25 | 5.75 |
| Total | 435 | 100 | 435 | 100 | 435 | 100 | 435 | 100 |
| Social Security Index | 0.77 | |||||||
Source: Field survey 2021
Table 11. Social security status of farmers.
Household Livelihood Security Index (HLSI): Household livelihood security index includes six livelihood security domains such as economic security, Food Security, Health security, Habitat security, educational security and social security. The composite overall Livelihood Security Index (LSI) for the household was calculated and presented in Table 12. In the present research, the overall livelihood security index was 0.40.
| Indicator | Index |
|---|---|
| Economic security | 0.31 |
| Food security | 0.17 |
| Health security | 0.33 |
| Habitat security | 0.49 |
| Educational security | 0.33 |
| Social security | 0.77 |
| Household livelihood security | 0.4 |
Source: Field survey 2021
Table 12. Livelihood security status of farmers.
The results of all the six major indicators are summarized in Figure 2. The livelihood security index spider diagram ranges between 0 and 0.8. It shows the significant difference among the six livelihood indices. Social security of the farmers is higher followed by habitat security. Educational and Health security has scored same value. Among these livelihood security indexes, health security index of farmers was indicated best level in the study area in terms of primary/basic health services.

Figure 2: Livelihood security index spider diagram.
The study was set out to explore the livelihood security of farmers. The socio-economic status of the farmers and their livelihood status were at vulnerable situation. Particularly, economic security and habitat security status are in highly vulnerable situation for rain-fed farmers compare to irrigated farmers.
This confirmed that around 43 % of the irrigated farmers and around 51 % of the rain-fed farmers were in livelihood insecurity status in the study area (Table 12). Lack of understanding about well-established patterns of livelihood and lack of diversified livelihoods were reported by the majority of farmers in the study area. Livelihood diversification is one of the ways to enhance the livelihood security of farmers. Government should organize training on diversified livelihood activities.
The research focuses on the empirical assessment of farmer’s livelihood security in the north-eastern region of Nigeria. The objectives of the study were to identify the socio-economic characteristics of the farmers and to assess the livelihood security status among the farmers in the study area. The result revealed that male farmers constituted the majority (73.17%) of the respondents, married with a mean age of 41 years. The respondents were mostly small-scale farmers, and they cultivated an average of 3.5 hectares of farmland using personal savings. The results of the livelihood security index revealed the score value of 0.31 for economic security, food security 0.17, health security 0.33, habitat security 0.49, education security 0.33 and social security scored the highest with 0.77. The overall Household Security Index of the farmers scored the value of 0.40 indicating low position of livelihood security status of the farmers in the study area.
Based on the findings of this study the following recommendations were made:
•Incentives aimed at increasing agricultural production in the rural areas and providing an efficient system of input servicedelivery should be encouraged. Agricultural-led growth policy is imperative for it has potential to boost the income of thefarmers, thereby reducing the insecurity of the farmers. It is recommended that growth development programs should beprovided where the majority of the poor people are more likely to get their incomes, and that will surely improve their livelihoodsecurity.
•Government and non-governmental agencies to provide productive technology and infrastructural facilities that will help in boosting the income and livelihood security of farmers.
•Expanding employment opportunities in agriculture and non-farm self-employment where the poor are, is significant for agrowth development strategy that will help improve farmers' livelihood security.
•There is a need for the government to make a frantic effort to provide health, education, economic, habitat, and food securityto the farmers in the region so that the livelihood security of the farmers is improved.
This is acknowledging with thanks that this research work is sponsored by Tetfund, Nigeria.
[Googlescholar] [Indexed]
[Googlescholar] [Indexed]
[Crossref] [Googlescholar] [Indexed]
[Crossref] [Googlescholar] [Indexed]
[Crossref] [Googlescholar] [Indexed]