Research & Reviews: Journal of Agriculture and Allied Sciences
ISSN: E 2347-226X, P 2319-9857
ISSN: E 2347-226X, P 2319-9857
1Department of Natural Resource Management, Arsi University, Asella, Ethiopia
2Department of Hydraulic and Water Resource Engineering, Arbaminch University, Arba Minch, Ethiopia
Received date: 22/09/2021; Accepted date:06/10/2021; Published date: 13/10/2021
Visit for more related articles at Research & Reviews: Journal of Agriculture and Allied Sciences
Irrigation production has been described in Ethiopia as a key mechanism for promoting economic growth and rural development, as well as a pillar of food security and poverty reduction. The environmental impacts were assessed using six metrics, and weekly average discharge measurements were obtained for the investigation duration of June to August 2020 to assess hydraulic efficiency. The discharge measurement was performed at nine measuring stations on branch canal off take by using the universal current meter. Water surface elevation measurement was also conducted along the secondary canal at twenty-four measuring locations to be used as an input for the calculation of water surface elevation ratio to support for operation and maintenance activity for decision-makers. The overall water delivery performance of the canal in relation to adequacy, efficiency, dependability, and equity was found to be 0.99, 0.99, 0.03, and 0.02 respectively. Maintenance indicators like water surface elevations ratio, the effectiveness of infrastructure, and sustainability of irrigated area were found to be 100%, 94.62%, and 93.7% respectively. Generally, the water delivery performance of the canals was good. Therefore, to sustain the performance of the irrigation scheme at a good level continued evaluation, maintenance, and operation work on irrigation systems are needed.
Adequacy; Equity; Dependability; Maintenance indicators; Water surface
Background of the study
Ethiopia’s economy depends mainly on agriculture. To increase agricultural production, the development of irrigation and agricultural water management holds significant potential. According to FAO, Ethiopia has about 72 million ha of potentially suitable land for agriculture, of which about 15 million ha has been cultivated. The potentially irrigable land of Ethiopia is estimated to be about 5.3 million. Expansion of irrigated land through new irrigation developments is relevant in Ethiopia in view of its underutilized potentials of land and water that, the country has presently embarked on an accelerated irrigation development plan. The government has undertaken the development of several new irrigation projects, yet the performance of existing irrigation schemes is given less consideration. In many of these schemes, water management activities are performed by the farmers themselves, however, they lack the technical expertise to manage their water effectively [1]. Areas of poor irrigation performance include mismatch of supplies and demands, insufficient maintenance, inadequate manual operation of structures, operational leakages and field losses, poor irrigation service, waterlogging, and salinization. As a result, in several irrigation schemes, irrigation water has been used at very low efficiency, hydraulic performance has been low and irrigation service to farmers has been stumpy. In this condition, environmental impact assessment and performance evaluation of water delivery system and maintenance requirement of the scheme become vital to ensure the good functioning of the irrigation system. Thus, great potential for irrigation is very needed at the demand of this growing population. Evaluation of irrigation land suitability has a contribution to the food production, to improve food security through efficient and effective use of water. However, environmental constraints also have to be taken into timely irrigation system maintenance evaluation was given no or little attention due to various reasons. Little or no attention had also been given to monitoring and evaluation of the performance of already existing irrigation structures. The irrigation performance assessment and environmental impact assessment are rarely conducted in Ethiopia due to a lack of field-level data. The primary objective of this research was to evaluate the hydraulic performance of the Omo Kuraz irrigation project by performance indicators.
Statement of the problem
Many studies in Ethiopia focus on technical aspects of irrigation schemes, and very little is known of the environmental implications of irrigation development. Currently the government has undertaken development of several new irrigation projects for enhancement of coverage. However, both the environmental impact and the performances of existing irrigation schemes are given less attention for improvement. However, according, little or no attention had been given to monitoring and evaluation of the performance of already existing irrigation structures. The irrigation performance assessment is rarely conducted in Ethiopia due to lack of field level data. Some attempts have been made to assess the scheme level performance of some irrigation schemes. The Omo kuraz irrigation scheme is a mega irrigation project that is developed for sugarcane plantation. However, due to lack of awareness and frequent training irrigation system operation its hydraulic performance can be categorized as in efficient. To lay concrete evidence on it, the hydraulic performance of Omo kuraz irrigation project was not assessed so far. In this condition evaluation of the performance of water delivery system and maintenance requirement of the scheme becomes vital to ensure good functioning of the irrigation system, not only to point out where the problem lies, but also to identify alternatives for effective and feasible improvement of irrigation system performance. Therefore, this study was conducted to evaluate the hydraulic performance assessment of Omo kuraz irrigation project using process performance indicators.
Objective of the study
The objective of this study was to evaluate hydraulic performances of Omo Kuraz irrigation project.
Specific objectives:
Significance of the study
This study generally will contribute to the major significances in project areas and developing countries. The study aimed to determine the environmental impact and the water delivery performance of an irrigation project. The results of the study can be considered for improving the performances of the scheme; environmental problems associated with the schemes, vital to various sugar industries, stakeholders of the irrigation project, government policymakers, and researchers, to design effective extension and development programs. It offers a clearer explanation of how a system should be run to system administrators, farm workers, and legislators.
Scope of the study
This study was targeted at assessing the hydraulic performance of the Omo kuraz irrigation scheme regarding water conveyance, operation and maintenance performance indicators in comparison with actual and required discharges of the delivery system. In addition, the maintenance requirement of the scheme was investigated in the irrigation system components and environmental impact assessment of the scheme by applying an analytical hierarchy process. Yet the current status of diversion weir was not included in the study. Therefore, this study deals only with a selected portion of the physical networking systems of Omo kuraz irrigation schemes in the specified performance indicators under water conveyance, operation, and maintenance indicators.
Materials And Methods
Description of the study area
The research was conducted at the Omo Kuraz Sugar Project, which is situated in the plain areas of the Lower Omo basin of the Southern Nations Nationalities and People’s Region, It is situated at 5º 8’18”–6º 16’ 59” latitude and 35º 43’ 37”–36º 13’ 54” longitude and its elevation ranges from 370–500 meters above sea level.
The area has a mean maximum and the minimum monthly air temperature is 34.39℃and 22.97℃, respectively with an annual rainfall of 1004.16mm but the rain distribution of study area is not even. It varies from one plantation site to another plantation site on the same site as the study area (Figures 1and 2).

Figure 1:Location and accessibility map of the project.

Figure 2:Omo kuraz scheme layout with discharge monitoring locations in head, middle and tail reaches.
For hydraulic performance evaluation secondary canal 13 was selected to evaluate the water delivery and water surface elevation ratios and its performance at the head, middle and tail reaches of the canal. Flow and water surface elevation (WSE) data were taken along the secondary canals (Table 1).
Table 1. Sample size of the study area.
| Canal name | Reach | Secondary canal length from regulator(km) | Division box | Tertiary canal | Actual irrigated land in each tertiary canal (ha) |
|---|---|---|---|---|---|
| SC-13 | Head | 1 | DB1 | TC1 | 142.1 |
| TC2 | 128 | ||||
| DB2 | TC3 | 154.71 | |||
| TC4 | 178.53 | ||||
| Middle | 1 | DB3 | TC5 | 226.55 | |
| TC6 | 174.7 | ||||
| Tail | 1 | DB4 | TC7 | 211.31 | |
| TC8 | 198.97 | ||||
| DB5 | TC9 | 0 | |||
| TC10 | 130.75 | ||||
| Total | 3 | 5 | 9 | 1545.627 |
The study area of the secondary canal length was proportionally divided in to three segments for easy of analysis. The flow measurement was also taken on the nine tertiary off take canals which are located at the head, middle and tail reach of the main irrigation canal. The size of the sample was determined by the time elapsed, the data necessity from fields, its availability and costs (Figure 3).

Figure 3:Irrigation scheme layouts of command area and its conveyance system.
Data collection
In this study the data were collected from primary and secondary sources. The primary data were collected in direct measurement from fields’ and field observation. It includes: measurements of discharging through the secondary and branch off take canals, measurement of actual water surface elevation in the canal, filed observations, volume of water required in the irrigation system. The secondary data were collected from various published and unpublished sources of governmental and non-governmental organizations and from Water Works Design and Supervision Enterprise study and sugar cooperation office report. Climate data, irrigated crops, actual command areas and designed features of the scheme are major data which were utilized in the study [2].
Water Surface Elevation Measurements (WSE)
Water surface elevations of the canal were measured in the reaches of the canal in the head, middle and tail reaches. It is measured using graduated staff with reference to the elevation of as-built structures and reference Bench Marks.
Measurement of water surface elevation of the canal during irrigation season was considered at the head, middle and tail reach of the system. In the secondary canal the actual data were taken at every 125 meters distance intervals in the entire length. The measurement was taken 40 meters far away from the main intake gate. For all inspection stations, the canal section was divided into three columns transversely in the secondary canal. Hence eight measurements were taken at each section and average values have been taken.
Crop water requirement
The amount of water needed for the irrigated crop fields was obtained from office report which was rechecked by using CROPWAT version 8.0 programs. Crop water requirements, Irrigation Requirements (IR) and scheme water supply for varying crop patterns were estimated.
Climatic data (rainfall, maximum and minimum temperature), sunshine hour, relative humidity and wind speed data were used for the analysis. The climatic data were used to determine the reference evapotranspiration and the effective rainfall. The effective rain fall was estimated using Dependable Rainfall Formula which also recommended by FAO using CROPWAT model. The reference evapotranspiration (ETo) was estimated using CROPWAT computer program based on the recommended Penman-Monteith equation.
The Penman-Monteith equation utilizes standard weather data to give estimates of evapotranspiration that are more consistent with actual crop water usage. Then the sugarcane water use (crop evapotranspiration (ETc) was estimated from reference evapotranspiration and crop coefficient (Kc) as follow. The crop parameters needed are sugarcane growth stages, crop coefficients and sugarcane root depth. Information related to sugarcane growth stages and crop coefficients were used. The table below shows the sugar cane coverage of secondary canal thirteen (SC-13) according to age variation and crop coefficient (kc) values of sugarcane based on its growth stages (Tables 2 and 3).
Table 2. Cane coverage according to age variation.
| SC 13 Cane coverage according to age variation | ||||||||||
|---|---|---|---|---|---|---|---|---|---|---|
| Cane age | Area of cane plant | |||||||||
| TC1 | TC2 | TC3 | TC4 | TC5 | TC6 | TC7 | TC8 | TC9 | TC10 | |
| 0--1 | ||||||||||
| 1--4 | ||||||||||
| 4--10 | 132.1 | 121 | 154.7 | 157.1 | 201.6 | 165.9 | 192.29 | 185 | 113.75 | |
| above 10 | 9.95 | 6.4 | 21.43 | 24.92 | 8.74 | 19.02 | 13.9 | 17 | ||
| total | 142.1 | 128 | 154.7 | 178.53 | 226.5 | 174.7 | 211.31 | 198.9 | 1545 | |
Source: Omo kura sugarz factory.
Table 3. Crop coefficient [Kc] values for sugarcane.
| Age | Growth | Canopy Cover | Kc Value | Root Depth |
|---|---|---|---|---|
| [months] | Stages | [%] | cm | |
| 0-1(30 days) | Initial | 0 - 25 | 0.55 | 30 |
| 1-4(90das) | Developmental | 25 - 50 | 0.9 | 45 |
| 4-10(180days) | Mid | 50 - 75 | 1.05 | 60 |
| above 10month | Late | 100 | 0.7 | 60 - 70 |
Discharge measurement
The measurements were taken at tertiary canal off takes. To do the work properly, velocity measurements are made at every nine off takes points of the cross section in the water depth. It would however; average flow velocity measurements were taken at 0.2m depth and 0.8 m depths at the centroid. The measurement was taken by current meter method.
Current meter (Area-velocity method)
Current meters are velocity measuring devices that sample at a point. Each point velocity measurement is then assigned to a meaningful part of the entire cross section passing flow. The velocity area method is used to compute discharge from current meter. Total discharge is determined by the summation of partial discharges. Data are usually determined over a useful range of total discharges (Figure 4).

Figure 4:Secondary canal-13 Tertiary canal cross-sections.
Data analysis
Hydraulic performance evaluation
Hydraulic performance of the irrigation scheme was evaluated using water delivery performance indicators. A water delivery performance was designated to evaluate on the secondary canal at head, middle and tail reaches. The secondary canal system performance with respect to water delivery indicators was estimated based on the monthly required and delivered discharge. Water delivery performance indicators were utilized the data like amount of actual irrigation water delivered (QD) and irrigation water requirement of the crop (QR). The amount of irrigation water supply at each tertiary off take canal was computed by measuring the flow velocity at 0.2m and 0.8m depth and it was converted into discharge (QD).
Water delivery performance indicators
Water delivery indicators are evaluating whether the system delivers water at the required rate at the right place and time and to assess whether the water delivery service is healthy. Four water delivery performance indicators, namely adequacy, efficiency, equity and dependability were used. The water delivery performance parameters like adequacy, efficiency, equity and dependability have been. According to the performance of the system was classified as good, fair or poor.
Dependability (PD)
It is defined as the temporal uniformity of the ratio of delivered amount of water to the required or scheduled amount over a region. Such parameter is defined as: Dependability indicator (PD).
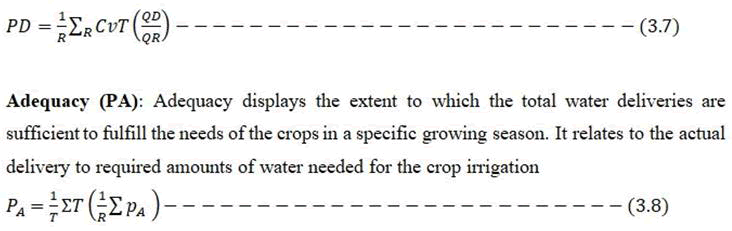
Where PA is adequacy indicator aggregated over a region R and time T, pA is a ratio of delivered to required flows at a point (offtake) i.e QD/QR. If QD≤ QR, otherwise PA=1, PA is the adequacy performance indicator, T is time and R is site where canals are located, QD is actual amount of water delivered by the system and QR is the amount of water required for crop consumptive use [3].
Equity (PE)
Equity of water distribution is a share of each individual or considered fair by all the system members. A perfectly equitable distribution will result if all locations receive an adequate water supply or if each location receives the same supply or what they are entitled to. The water allocation process principally affects the equity performance indicator. Equity indicator (PE) is given. An appropriate measure of the performance of the system with equity would be the average relative spatial variability of the ratio of amount delivered to the amount required over the time period of interest. The measure is given by:

Where CVR is the special coefficient of variation of the ratio of delivered water to required water over the region R and T is the time period.
Efficiency
In any type of irrigation system, it is useful to have the concept of efficiency to enable comparison of different management strategies for a particular system, since efficiency shows to foresee how the water resource would be conserved. Efficiency is defined as the ratio of volume of water required for a specific purpose to the volume of water delivered for this purpose. The ratio is given as:

Where; PF is the special and temporal average of the ratio QR/QD indicator over an area R and time period T for a specific time. Then, delivery system for which PF values range between 0.7 and 0.84 is measured as fairly efficient.
Deficiency
The value of deficiency is a quantitative measure of the dissatisfaction’s of users. The parameter will help the system managers and users to take corrective measurements for system improvements in deficit areas. Estimation of deficiency is given as the ratio of water deficiency to the required amount. A measure of deficiency is considered as the temporal and spatial average of the ratio of (QR-QD) and QR.
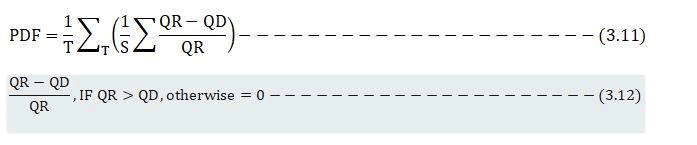
Where PDF is deficiency indicator over the system S and time period T and (QD-QD)/QD is deficiency indicator at a point for a specific time. The expression gives water deficiency over the system in each period and overall deficiency over the period. Delivery Performance Ratio (DPR) is the simplest, and yet probably the most important, operational hydraulic performance indicator. Generally delivery performance ratio is the ratio of the amount of actual delivered to the intended amount of water to be delivered. The ratio is given as;
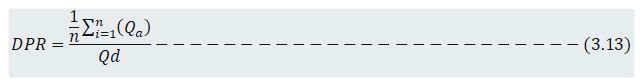
Where Qa
Actual discharges based on daily water level measurement for n days, Qd: Design or intended discharges of irrigation water n; number of monitoring period. It can be assumed that, if the delivery performance ratio value is close to one, it indicates that the management input is very high and the canal keeping its operational condition as its intended level.
Equity ratio for head and tail (ERHT)
This indicator focused on the equity of water distribution for head and tail at different levels of a system. It can assist to identify head and tail difference at the level of the system; and to address problems as a result. An equity ratio for head to tail (ERHT) components of a distribution sub-system is given as:

Where MDR is Management Delivery Ratio which is described as the amount of delivered water to the required (QD/QR), n is the number of periods monitored.
Maintenance indicators
Hydraulic performance of the scheme was also evaluated with maintenance performance indicators. It was estimated. Maintenance requirements of the system were observed according to the maintenance indicators of water surface elevation ratio, effectiveness of infrastructure, delivery duration ratio and sustainability of irrigable area. The physical structures in its operational condition were categorized as operative, nearly operative, nearly inoperative and inoperative. If at least one of the following conditions are in effect: broken and damaging of the structure, change of canal cross-section, scouring of canal section, missing of flow control and measuring structures, sedimentation and weed growth.
Effectiveness of infrastructure (EI)
The study was focused on the irrigation system components with the spillway and weir; yet the drainage and field application systems did not considered. The existing condition of the main and branch canals were inspected in its operating length alone. The ratio is:

Delivery performance ratio indicator
The delivery performance ratio enables a manager to determine the extent to which water is actually delivered as intended during a selected period and at any location in the system. It is obvious that if the actual delivered volume of water is based on frequent flow measurements, the greater the likelihood that managers can match actual to intended flows. To obtain sufficiently accurate flow data, discharge measurement structures with water level recorders must be available at key water delivery locations. The ratio is given as:
Where Qa
Actual discharges based on daily water level measurement for n days, Qd: Design or intended discharges of irrigation water n; number of monitoring period.
It can be assumed that, if the delivery performance ratio value is close to one, it indicates that the management input is very high and the canal keeping its operational condition as its intended level.
Sustainability of irrigated area (SI) is measured as the ratio of existing area under irrigation to the planned irrigated area.

Where, actual irrigated area (ha) and designed irrigated area (ha).
Crop water requirements
The reference evapotranspiration ETO of individual agro-ecological units are calculated by FAO Penman-Monteith method, using a decision support software CROPWAT 8.0 developed by FAO,. The FAO CROPWAT program incorporates procedures for reference crop evapotranspiration and crop water requirements and allows the simulation of crop water use under various climate data, crop data, cropping pattern and soil data. Kc values for initial, mid and late growth stages of annual and seasonal crops are used. Crop coefficient values (Kc) are taken from available published data and from FAO. The water requirements of a crop can be compared with the ETO by using an experimentally-derived crop coefficient (Kc) as follows:

Water surface elevation ratio (WSER)
It was computed by taking the actual water depth from the canal bottom and comparing it with the design water depth at the same position in the main canal. The parameter is defined by measuring the actual water surface elevation at intended water level recorded below the FSL. If a value is greater than one it would expect to indicate an erosion problem or over-capacity of a canal resulting from inadequate management activity. While, if the value of WSER is less than one, then there is a probability of rising canal bed level due to siltation and weed incidence in a canal [3]. WSER can be calculated as:
Where, WSER is water surface elevation ratio, AWSE and DWSE are actual and design water surface elevation respectively. The actual water surface elevation at FSL is measured from the field and the design Water surface elevation is taken from the design document.
Results And Discussion
Performance evaluation of the irrigation scheme
The results of this study have been discussed based on the irrigation scheme by dividing into sub sections i.e. head, middle, and tail and the performance assessment were used to investigate the actual, required and intended values including: the actual and required discharge of the secondary and branched canals, water surface elevation of the main canal, the irrigated area and total command area, duration of irrigation and functional and non-functional structures and total number of structures of the irrigation system. The results of this study have been discussed in the following section [4].
Evaluation of the water delivery performance
The water delivery performance of the system was evaluated based on flows monitored at each off takes. For each of the off takes, the monthly average actual delivered flows for a period of 3 months were determined from daily flow measurements by current-metering.
Irrigation water requirements
The ETO of all months in the study area was ranging from 163.8 to 117 mm/month. This greater ETO values (extends from January to March) was happening because of non-availability of sufficient amount of rainwater and higher atmospheric evaporative demand. The excess rainfall was occurred from months of March to May. In moths where rainfall and effective rain was overlapped shows rainfall was required for the normal growth of crops (Figure 5 and Table 4).

Figure 5:Rainfall and reference evapotranspiration of the study area.
Table 4. The water requirement of Sc -13 at omo kuraz irrigation project.
| Month | Jan | Feb | Mar | Apr | May | Jun | Jul | Aug | Sep | Oct | Nov | Dec |
|---|---|---|---|---|---|---|---|---|---|---|---|---|
| IR(l/s/ha) | 0.72 | 0.81 | 0.81 | 0 | 0.65 | 0.59 | 0.58 | 0.63 | 0.63 | 0.66 | 0.62 | 0.63 |
| M3/S) | 1.11 | 1.2 | 1.25 | 0 | 1.01 | 0.92 | 0.9 | 0.98 | 0.97 | 1.01 | 0.96 | 0.98 |
Average delivered and required discharge
The delivered discharge is determined by direct measurement of flow from June to August. The delivered and required discharge is used to determine the water delivery performance of the scheme in terms of adequacy, efficiency, dependability and equity. It also uses to compare the relative water supply of the irrigation scheme at the tertiary off takes. Of a total of 9 off takes considered on the secondary canal thirteen (SC-13), the first 4 are in the head reach, next 2 in the middle reach and last 3 in the tail reach which is described below (Table 5).
Table 5. Average delivered and required discharge in the tertiary off-take canals (m3/s).
| Head | Middle | Tail | ||||||||||||||||
|---|---|---|---|---|---|---|---|---|---|---|---|---|---|---|---|---|---|---|
| TC1 | TC2 | TC3 | TC4 | TC5 | TC6 | TC7 | TC8 | TC10 | ||||||||||
| Month | QD | QR | QD | QR | QD | QR | QD | QR | QD | QR | QD | QR | QD | QR | QD | QR | QD | QR |
| June | 0.082 | 0.084 | 0.076 | 0.076 | 0.096 | 0.092 | 0.104 | 0.106 | 0.135 | 0.134 | 0.104 | 0.104 | 0.126 | 0.125 | 0.117 | 0.118 | 0.077 | 0.078 |
| July | 0.085 | 0.083 | 0.083 | 0.075 | 0.085 | 0.09 | 0.106 | 0.104 | 0.135 | 0.132 | 0.104 | 0.102 | 0.126 | 0.124 | 0.116 | 0.116 | 0.086 | 0.076 |
| August | 0.096 | 0.09 | 0.099 | 0.081 | 0.093 | 0.098 | 0.098 | 0.113 | 0.14 | 0.143 | 0.112 | 0.11 | 0.122 | 0.133 | 0.129 | 0.126 | 0.092 | 0.083 |
N.B: QD and QR are the delivered and required discharge in the tertiary off take canals (TC1-TC10) respectively
Spatial and temporal water delivery performance indicators
Spatial and temporal scales were used to determine performance of water delivery of a system. The spatial average values of the performance indicators for water delivery canals were discussed below. The spatial water delivery indicators include adequacy, efficiency, dependability and equity. Spatial performance indicators are spatially-averaged values of indicators of water delivery performance of all off takes in Head, Middle and tail reach of the canal. The temporal values of performance indicators are time-based performance indicators that show the water delivery performance of canals in the system. Temporal values of water delivery performance indicators were evaluated for adequacy, efficiency, equity and dependability in three months (June, July and August).
Spatial performance indicators
Adequacy (PA)
Adequacy is an important parameter, which displays the extent to which total water deliveries are sufficient to fulfill the needs of the crops in a specific growing season and command area. The average values of spatial adequacy in the three months Period are shown below:
The spatial average values of PA were found to be 0.84, 0.92 and 1 in June, July and August respectively. In contrast, the highest PA value was found in August and the lowest PA value was found in June. According to ranges of water delivery performance standards, water delivery performance of the canal in relation to adequacy was good performance range. The spatial average value of adequacy represents about all the offtakes of the irrigation system so, the value of adequacy from June to August is increased due to the rainy season increases and the water requirement of the crop also decreased [5].
Efficiency (PF)
The Spatial average values of efficiency (PF) are given in, which was calculated by using equation 3.9. The average values of spatial efficiency of the three month period were 1.0, 1.0and 0.97 in June, July and August respectively. According to the ranges of water delivery performance standards, these values indicated that, efficiency was good throughout the investigation period. If pF value was equal to or close to 1.00, the water in the system was being used efficiently and farmers conserve more water. However, pF value was less than 0.70 indicates water in the system was not being used efficiently. In this case the PF value is greater than 0.7 therefore the water in the system was being used efficiently.
Equity (PE)
Equity of water distribution was calculated as the coefficient of variation of the adequacy values between different locations. The result is shown in Figure 4.5 and the spatial coefficient of variation (PE) of water distribution over the three month monitoring period. The results of equity displayed in figure above ranges from 0.01 to 0.05. According to water delivery performance standards given by the spatial distribution of water in the canal during all months shows water distribution in all three months was appearing in the range of good. That means equity of water distribution during the monitoring period was good over the entire system.
Deficiency (PDF)
A measure of deficiency is given as the ratio of temporal and spatial average of water deficiency to the required amount (QR). The results of spatial and temporal average value of deficit are presented in (Table 6).
Table 6. Average spatial and temporal deficiency (PDF) of system.
| Head | Middle | Tail | Spatial Ave | |||||||
|---|---|---|---|---|---|---|---|---|---|---|
| Month | TC1 | TC2 | TC3 | TC4 | TC5 | TC6 | TC7 | TC8 | TC10 | |
| Jun | 0.03 | 0 | 0 | 0.02 | 0 | 0 | 0 | 0.01 | 0.01 | 0.01 |
| Jul | 0 | 0 | 0.06 | 0 | 0 | 0 | 0 | 0 | 0 | 0 |
| Aug | 0 | 0 | 0.05 | 0.13 | 0.02 | 0 | 0.09 | 0 | 0 | 0 |
| Temporal aver at TC | 0.01 | 0 | 0.03 | 0.05 | 0.01 | 0 | 0.03 | 0.01 | 0 | 0 |
| At reaches | ||||||||||
| 0 | 0 | 0 | ||||||||
Average spatial deficit in the conveyance system has been observed in the three months. The average temporal deficits in head, Middle and Tail reach were zero. The spatial deficit is 0.01, 0.00, and 0.00 at Jun, Jul and August respectively. Average overall deficiency of the entire system is found to be 0.00 (0 percent). It shown that, the delivery system supplied was uniform at each off takes.
Temporal performance indicators
Temporal relative delivery depicts the temporally aggregated relative delivery of individual off takes. It is a time-based performance indicator that shows the water delivery performance of canals in the system. Temporal values of water delivery performance indicators were evaluated for adequacy, efficiency and dependability.
Adequacy (PA)
A temporal value of the adequacy performance indicator was assessed for all off take and reach of the system (Head, Middle, and Tail) in a month of (June, July and August).The result of temporal value of adequacy was ranging from 0.95 to 1.0. The highest PA values were found in the Tertiary canal two (TC2) and TC6, whereas the lowest value was observed at TC4. According to water delivery performance standards, adequacy of water delivery performance was good at all tertiary off takes (outlet points). Therefore, it perceived that, in all outlets, irrigation water supply is carried out well in accord with the demand in the different monitoring periods. In general, the overall adequacy, value of the system is found to be 0.99. Therefore, water delivery performance in the supply canal for the entire command during the irrigation season was found to be good.
Efficiency (PF)
Temporally aggregated efficiency indicator for individual off takes was observed .The temporal delivery of water in the system was good. The overall efficiency (PF) of a system is estimated to be 99%. According to the range of performance evaluation criteria of efficiency the efficiency performance value was good.
Deficiency (D)
The average value of temporal deficit was showed zero at the three months. The overall deficit of the irrigation project is 0%, which means that there was not deficit of irrigation [3].
Dependability
Dependability indicates the degree of temporal variability of water delivery. It is the ratio of the amount of water delivered to require over a time. The average dependability values of head, middle and tail reach of a system are ranging from 0 to 0.07 with an overall average dependability of 0.03. According to water delivery performance standards given, the reliability of flow was good at the head, middle and tail reaches of the system.
Equity ratio for head and tail (ERHT)
The Equity ratio for head to tail (ERHT) describes an equity concept in terms of the spatial variations of management delivery ratio (MDR). It provides the equity of water delivery among the distributaries with special focus on head and tail reach. ERHT was calculated using equation 3.15. It intends to estimate how water was managed and delivered fairly in head and tail reach of the canal (Table 7).
Table 7. Equity ratio for Head and Tail (ERHT (MDR)) reach of the system.
| Head | Tail | |||||||
|---|---|---|---|---|---|---|---|---|
| Month | TC1 | TC2 | TC3 | TC4 | TC7 | TC8 | TC10 | ERHT(MDR) |
| Jun | 0.97 | 1 | 0.96 | 1.02 | 0.99 | 1.01 | 1.011 | 1.33 |
| Jul | 1.02 | 1.11 | 0.94 | 1.01 | 1.02 | 1 | 1.12 | 1.3 |
| Aug | 1.07 | 1.23 | 0.95 | 0.87 | 0.91 | 1.03 | 1.118 | 1.35 |
| Ave. | 1.33 | |||||||
The value of ERHT ranges from 1.30 to 1.35. The overall average value of ERHT is found to be 1.33. All the values of the ratio (ERHT) in the table are greater than one, indicating that the MDR of the head reach of the system is higher than the tail reach. The performance of the main canal is not found in a reasonable level with respect to ERHT (MDR). The head delivery systems receive more water than the tail in all months. Generally, the overall average value of ERHT is found to be 1.33, so the performance of the system is found to be poor with respect to ERHT (MDR). This resulted from absence of adequate flow regulation [2].
Assessment of maintenance requirement
Maintenance requirements of the system were observed according to the maintenance indicators of water surface elevation ratio, effectiveness of infrastructure, delivery duration ratio and sustainability of irrigable area.
Water surface elevation ratio (WSER)
Water surface elevation ratio is an indicator suggested by aimed to assess the impact of sedimentation and erosion on the physical irrigation system. The result would help to predict the impact of sedimentation, weeds and erosion problem on the physical irrigation system [4]. It was computed by taking the actual water depth from the canal bottom and comparing it with the design water depth at the same position in the secondary canal (Table 8).
Table 8. Water surface elevation (WSE) of the secondary canal.
| Average | Head | Middle | Tail | Overall | ||||
|---|---|---|---|---|---|---|---|---|
| DEV.WSE | WSER | DEV.WSE | WSER | DEV.WSE | WSER | DEV.WSE | WSER | |
| -0.01 | 1.01 | -0.01 | 1.01 | 0.01 | 0.99 | 1 | 0.01 | |
As per the design document the intended water level depth in the secondary canal was 1.1 m at the head reach and 0.89 m at the middle and 0.71m at tail reach of the system. Hence, the overall average WSER was found to be 1. This result shows that the main canal was attained about 100 percent of WSE at FSL.
This indicator was estimated taking the ratio of currently functional structures to the total number of structures initially installed (Table 9).
Table 9. Functional and mal-functioned irrigation structures.
| Functional and mal-functional irrigation infra structures | |||||
|---|---|---|---|---|---|
| SN | Infra structures | Total number of installed structures | Functional | Mal-functional | Effectiveness of infra structures |
| 1 | Secondary head regulator | 1 | 1 | 0 | 100 |
| 2 | Secondary cross regulator | 5 | 4 | 1 | 80 |
| 3 | Division box | 5 | 5 | 0 | 100 |
| 4 | Tertiary head regulator | 9 | 9 | 0 | 100 |
| 5 | Quaternary head regulator | 95 | 84 | 11 | 88.4 |
| 6 | Tertiary cross regulator | 95 | 82 | 13 | 86.3 |
| 7 | Drop structures | 9 | 9 | 0 | 100 |
| 8 | Tertiary off takes | 9 | 9 | 0 | 100 |
| 9 | Quaternary off takes | 95 | 92 | 3 | 96.8 |
| Total | 323 | 295 | 28 | 94.62 | |
| Position (%) | 91.33 | 8.67 | |||
Effectiveness of infrastructure was estimated using equation 3.16. According to the design document, the total number of structures that were installed in the irrigation scheme was (i.e. Division box, head regulator, cross regulator, Drop structures, and off takes) 323; however 295 structures are currently functional. Hence, the value of effectiveness of infrastructure is estimated to be 94.62 percent. The value suggested that the maintenance activity of a system was excellent having sound construction, well maintained slopes and bank protection, no seepages, no visible sedimentation.
Sustainability of irrigated area (SI)
This indicator empowered to investigate the alterations or change in area actually irrigated against the planned in terms of ratio and provide valid reasons for such variation.
As per the design document, the intended command area that a scheme could potentially irrigate was about 1556.4ha. However the actual irrigated area in a cropping season is 1545.6 hectare. Hence, SI is found to be 99.3 percent using equation 3.18. The irrigated areas of the irrigation scheme are almost the same compared with the designed. Therefore, irrigated area of the scheme was reduced only by 0.7 percent compared with the previous (planned). This result shows that the inability of the scheme water supplied to the irrigated area and inadequate maintenance activity is not limiting factors for system performance. It implies that this parameter will be not intensifying the maintenance requirements of the system.
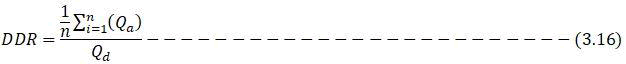
Delivery duration ratio (DDR)
Delivery duration ratio is the ratio of the actual duration of irrigation water delivery to the intended irrigation hour. In our case, the irrigation scheme is designed for 24 hours. However, due to the shifting time of irrigators and gatekeepers, the average delivery duration of the scheme is 21 hours per day [5]. The value of the delivery duration ratio was calculated by using equation 3.13. The value of delivery duration ratio was 0.875, according to the standard presented in table 2.2 the value falls in the “Good” range and the result showing the water distribution system is dependable and the system maintenance is sufficient.
Overall water delivery indicators
The overall water delivery indicators for the three months are shown in (Table 10).
Table 10. The overall result of water delivery indicators for the three months.
| Indicators | Standard Scale | Omo kuraz | |||
|---|---|---|---|---|---|
| Good | Fair | Poor | Value | Status | |
| PA | 0.9 | 0.8 | <0.8 | 0.99 | Good |
| PF | 0.85 | 0.7 | <0.7 | 0.99 | Good |
| PD | 0 | 0.11 | >0.2 | 0.03 | Good |
| PE | 0 | 0.11 | >0.25 | 0.02 | Good |
In this paper the performance of Omo kuraz irrigation scheme was evaluated at the head, middle, and tail reaches of the command area from June to August 2020. The evaluation was conducted on the basis of performance indicators within the system. The water delivery performance of the irrigation scheme as per standards proposed by was found to be good in adequacy, equity and dependability and efficiency. Likewise, the delivery system supplied had uniform water distribution at each off takes which is considered as satisfactory with respect to deficit. Whereas, equity ratio for head to tail indicated that poor; it means head delivery systems receive more water than the tail in all months because of absence of adequate flow regulation. This satisfactory performance of irrigation system could increase the productivity of the farm. Maintenance performance indicators were considered the parameter of water surface elevation ratio, effectiveness of infrastructure and delivery duration ratio. Generally, it was found that the maintenance performance of the system was good. The main reason of good maintenance performance of the scheme had been due to structures were newly installed and proper management. In general, according to the result perceived, the performance of irrigation system is good.
Based on the results of the study, the following recommendations are put forward to improve the performance of the Omo kuraz irrigation project.