Research & Reviews: Journal of Agriculture and Allied Sciences
ISSN: E 2347-226X, P 2319-9857
ISSN: E 2347-226X, P 2319-9857
Bhattu Rajesh Nayak1, K Srinivas Naik2, Raju Padiya3, G Kumara Joshi1, G Vijay Kumar1*
1Department of Genetics, Osmania University, Hyderabad, Telangana, India
2Department of Plant Molecular Biology, Osmania University, Hyderabad, Telangana, India
3Department of Biochemistry, Osmania University, Hyderabad, Telangana, India
Received: 20-Feb-2023, Manuscript No. JAAS-23-89778; Editor assigned: 22-Feb-2023, PreQC No. JAAS-23-89778 (PQ); Reviewed: 08-Mar-2023, QC No. JAAS-23-89778; Revised: 21-Mar-2023, Manuscript No. JAAS-23-89778 (R); Published: 28-Mar-2023, DOI: 10.4172/2347-226X.12.1.001
Citation: Kumar GV, et al. Studies on Correlation, Genetic Advance and Heritability for Seed Yield and its Contributing Traits of EMS Induced Blackgram (Vigna mungo L Hepper) Mutants in M3 Generation. RRJ Agri Allied Sci. 2023;12:001.
Copyright: © 2023 Kumar GV, et al. This is an open-access article distributed under the terms of the Creative Commons Attribution License, which permits unrestricted use, distribution, and reproduction in any medium, provided the original author and source are credited.
Visit for more related articles at Research & Reviews: Journal of Agriculture and Allied Sciences
The present work was carried out with blackgram accession IC436524, collected from NBPGR regional centre, Hyderabad and T-9 variety was collected from ICAR-CRIDA, Hyderabad. Correlation analysis reveals the extent to which individual attributes are linked to output, providing a measure of the connection between traits. The correlation analysis results revealed that among ten quantitative characters, number of seeds/plant was phenotypically and genotypically significantly correlated with seed yield followed by plant height (cm), number of clusters per plant, number of pods per plant, number of leaves per plant, 100 seed weight (g), number of branches per plant. The correlation results revealed that significant association (genotypic and phenotypic) between and among the most important traits viz., pods, clusters per plant, seeds and seed yield per plant. The heritability and Genetic advance estimations results revealed that the maximum heritability, Genetic advance mean value (%) recorded for the character seed yield, numbers of pods per plant and seeds per plant, clusters per plant and pods. The results also revealed that most of the characters under study were recorded higher PCV than GCV which indicates little environmental influence on the characters in the Blackgram mutants in M3 generation.
Blackgram; Correlation; Heritability; Genetic advance; Mutagenesis
Urdbean or “blackgram (Vigna mungo L. Hepper), is a commercially significant, long lasting, and nutrient rich pulse crop. It's one of a kind in its ability to convert atmospheric nitrogen into a usable form”. Since it can thrive in both semi-arid and sub-tropical climates, blackgram has become one of South-East Asia's most valuable cash crops [1].
Belonging to the genus Vigna, this legume is self-fertile and diploid, subgenus Ceratotropis, and family Leguminaceae with a somatic chromosomal number of 2n=2x=22. Blackgram is grown either as a pure crop or mixed with maize, upland rice, sorghum or bajra in India. It is cultivated during Kharif and Rabi seasons in this country. Exploiting existing genetic diversity in order to generate homozygous lines with improved yield and stability has been the primary focus of blackgram varietal development up to this point. The introduction of such pure line varieties relies on the control of genetic variability for creating efficient plant types containing gene for greater performance for yield and yield contributing attributes. Success in a breeding programme relies heavily on the diversity of genes present in the germplasm or foundational population. Since the essence lies within the genotypes, deciphering such potential needs remarkable genetic tools. The global demand for the grain legumes especially black gram has been found to increasingly greatly in the recent years because of their tremendous nutritional value. The researchers seek intense interest to improve the quality of blackgram particularly in the countries with increased population growth. This urges the necessary to induce the genetic variation for constant supply of better yielding and enhanced varieties to the producer [2-8].
Mutation breeding is an important branch of plant breeding since it allows for the improvement of a cultivar's desired attribute without altering the plant's genetic composition. Blackgram is a good candidate for the application of mutation breeding, which is an essential way of crop development. When it comes to crop improvement, mutagenesis has shown to be an effective tool for increasing variety. Various plant traits have been improved by the widespread use of mutation breeding. For autogamous crops with a small genetic pool, it is a very useful tool for plant breeders to have at their disposal. Mutation breeding, in which induced mutants are exploited in breeding programmes, has been extensively used to develop new crop cultivars and modify plant traits. This was reported by Wongpiyasatid, et al. Selection procedure is more difficult in a trait, where heritability is low or is not precisely measurable. Indirect selection in such a situation is more effective and study of correlation among different economic traits are therefore, essential for an effective selection programme because selection for one or more trait results in correlated response for several other traits and sequence of variation will also be influenced. Hence, the knowledge of genotypic and phenotypic correlation between yield and its contributing characters is very essential [9].
The promising blackgram accession IC436524 constituted the basic genetic material for the present study was obtained from NBPGR regional centre, Hyderabad and T-9 variety was collected from ICAR-CRIDA, Hyderabad. Ethyl Methane Sulphonate (EMS) was obtained from HIMEDIA laboratory limited, Mumbai, India, was used as chemical mutagen to induce the seeds of blackgram. Dry, uniform and healthy seeds of the blackgram accession were treated with Ethyl methane sulphonate at the plant genetics and molecular breeding lab, department of genetics, Osmania university, Hyderabad. M1 generation was raised by treating the seeds with EMS prepared at different known concentration viz., 0.2%,0.3%,0.4%,0.5% and control (untreated EMS) along with T9 (check). All agronomic practices were strictly followed during preparation of field, sowing and subsequent management of M1, M2 and M3 generations. Quantitative characters of M1 generation are useful in determination of the mutations created in subsequent generations to determine the desired traits [10].
M1 generation
Data was prepared accordingly and mutants with high range of morphological characters for high yielding in each row of each concentration like plant height per plant (cm), number of branches per plant, number of leaves per plant, number of clusters per plant, number of seeds per plant, seed yield (g) per plant, 100 seed weight (g), root length (cm)and root nodules per plant were screened and isolated in M1 generation (raised by inducing EMS). Seeds of M1plants were harvested separately and preserved in paper bags for next generation studies (M2 generation).
M2 generation
Data was prepared accordingly and mutants with high range of morphological characters for high yielding like plant height per plant (cm), number of branches per plant, number of leaves per plant, number of clusters per plant, number of seeds per plant, seed yield (g) per plant, 100 seed weight (g), root length (cm) and root nodules per plant in each row of each concentration were screened and isolated in M2 generation (raised by M1 progeny). Seeds of M2 plants were harvested separately and preserved in paper bags for next generation studies (M3 generation). Fifty seeds from each treatment viz., 0.2% mutants, 0.3% mutants, 0.4% mutants, 0.5% mutants, Control and T-9 (totally 300 seeds) were sown in field located at Kodad, Suryapet, Telangana to evaluate the seed yield and yield contributing traits [11].
For raising M3 generation total 300 seeds of 50 healthy seeds from each treatment were collected from high yielding mutant and control along with T9 and were sown with 10 cm x 30 cm distance between plants per row in a field in RBD (Randomized Block Design) with three replications each along with control. Similar agronomical parameters as M1 generation were practiced to rise M3 generation. Data collected on the quantitative phenotypic characters like plant height per plant (cm), number of branches per plant, number of leaves per plant, number of clusters per plant, number of seeds per plant, seed yield (g) per plant, 100 seed weight (g), root length (cm) and root nodules per plant were studied to assess the extent of induced phenotypic and genotypic variations and by genetic advance, heritability. The significance of differences between the mean values of treated mutants, control and T-9 in M3 generations. Genotypic Coefficient of Variation (GCV) and Phenotypic Coefficient of Variation (PCV), heritability, genetic advance were estimated. Significance of correlation coefficients was tested by comparing phenotypic and genotypic correlation coefficients with the correlation table values given by Fisher and Yates at (n-2) degrees of freedom where ‘n’ denotes the number of paired observations used in the calculation [12].
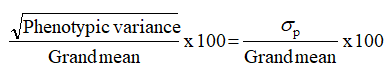
Phenotypic and genotypic coefficients of variation (%)
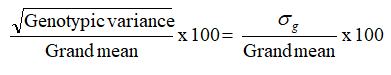
Phenotypic and genotypic coefficients of variation were calculated based on the method advocated by Burton.
•Phenotypic Co-efficient of Variation (PCV) (%)
•Genotypic Co-efficient of Variation (GCV) (%)
Categorization of the range of variation was followed as proposed by Sivasubramanian and Menon [13].
Less than 10 percent-Low
10-20 percent-Medium
More than 20 percent-High
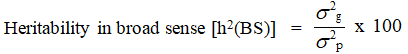
Heritability in broad sense (h2(BS)) (%)
Heritability in broad sense was estimated as per Allard and expressed in percentage
Range of heritability was categorized as suggested by Johnson et al.,
Less than 30 percent-Low
30 to 60 percent-Moderate
More than 60 percent-High
Genetic advance as percent of mean (%)
Genetic advance was estimated by the method suggested by Johnson et al.,
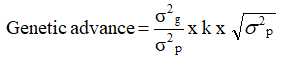
Where,
k=Selection differential which is equal to 2.06 at 5 percent level of selection intensity
Genetic advance was expressed as percentage of mean by using the following formula as given by Johnson et al.,
Genetic advance was categorized as suggested by Johnson, et al.,
Less than 10 percent-Low
10-20 percent-Medium
More than 20 percent-High
Correlation analysis reveals the extent to which individual attributes are linked to output, providing a measure of the connection between traits. Johanson, et al., created a technique for calculating phenotypic and genotypic correlation coefficients, while Dewey and Lu devised a method for calculating route coefficients. Depending on the nature and direction of the associations between characters, choosing one might have positive or negative consequences for those that are associated to it. Selecting for yield improvement based on components of yield is only useful if those components are highly connected with yield [14]. There must be positive genetic and phenotypic relationships between the parts. At the genetic level, a positive correlation results from genes controlling (untreated) two separate characteristics entering a coupling phase of linkage, whereas a negative correlation results from genes entering a repulsion phase of linkage. As such, the correlation coefficient is a useful tool for separating crucial connections from less important ones [15]. Research into correlation coefficients is crucial for the development of breeding programmes aiming at reaching the appropriate combinations of different yield components, since they allow for the simultaneous enhancement of two or more traits [16]. Therefore, the purpose of this research was to investigate the direction and degree to which component traits in the population of parents and hybrids are associated with grain yield and among each other (Tables 1 and 2) [17].
| “Phenotypic | Pl.Ht (cm) | No.Br/Pl | No.L/Pl | No.Cl/Pl | No.P/Pl | No S/Pl | S.Y (g)/Pl | 100 S.Wt (g) | R.L (cm)/Pl |
|---|---|---|---|---|---|---|---|---|---|
| Pl.Ht (cm) | 1.000 | ||||||||
| No.Br/Pl | 0.746** | 1.000 | |||||||
| No.L/Pl | 0.855** | 0.652** | 1.000 | ||||||
| No.Cl/Pl | 0.578** | 0.570** | 0.432* | 1.000 | |||||
| No.P/Pl | 0.602** | 0.520** | 0.430* | 0.890** | 1.000 | ||||
| No S/Pl | 0.782** | 0.648** | 0.707** | 0.739** | 0.750** | 1.000 | |||
| S.Y (g)/Pl | 0.817** | 0.713** | 0.725** | 0.803** | 0.797** | 0.958** | 1.000 | ||
| 100 S.Wt (g) | 0.835** | 0.762** | 0.771** | 0.427* | 0.478** | 0.742** | 0.722** | 1.000 | |
| R.L (cm)/Pl | 0.839** | 0.650** | 0.804** | 0.611** | 0.519** | 0.808** | 0.757** | 0.819** | 1.000 |
| No.R.N/Pl | 0.550** | 0.690** | 0.338 NS | 0.224 NS | 0.274 NS | 0.257 NS | 0.331 NS | 0.683** | 0.418*” |
*Statistically significant at the 0.05 percent and **level (0.01 percent and 0.05%, respectively)
Pl.Ht (cm): Plant Height; No.Br/Pl: Branches Plant-1; No.L/Pl: Leaves Plant-1; No.Cl/Pl: Clusters Plant-1; No.S/Pl: Number of Seeds Plant-1; No.P/Pl: Pods Plant-1; S.Y (g)/Pl: Seed Yield Plant-1; 100 S.Wt (g): 100 Seed Weight; R.L (cm)/Pl: Root length (cm) Plant-1; No.R.N/Pl: Root Nodules Plant-1.
Table 1. Genetic analysis of seed yield and yield contributing characteristics in blackgram mutants during M3 generations.
| “Genotypic | Pl.Ht (cm) | No.Br/Pl | No.L/Pl | No.Cl/Pl | No.P/Pl | No S/Pl | S.Y (g)/Pl | 100 S.Wt (g) | R.L (cm)/Pl |
|---|---|---|---|---|---|---|---|---|---|
| Pl.Ht (cm) | 1.000 | ||||||||
| No.Br/Pl | 0.800** | 1.000 | |||||||
| No.L/Pl | 0.970** | 0.669** | 1.000 | ||||||
| No.Cl/Pl | 0.609** | 0.603** | 0.435* | 1.000 | |||||
| No.P/Pl | 0.580** | 0.532** | 0.350 NS | 1.016** | 1.000 | ||||
| No S/Pl | 0.839** | 0.651** | 0.658** | 0.908** | 0.916** | 1.000 | |||
| S.Y (g)/Pl | 0.868** | 0.725** | 0.710** | 0.973** | 0.959** | 0.954** | 1.000 | ||
| 100 S.Wt (g) | 0.944** | 0.840** | 0.873** | 0.558** | 0.500** | 0.859** | 0.779** | 1.000 | |
| R.L (cm)/Pl | 0.915** | 0.666** | 0.855** | 0.574** | 0.595** | 0.939** | 0.832** | 1.018** | 1.000 |
| No.R.N/Pl | 0.938** | 1.091** | 0.903** | 0.489** | 0.394* | 0.741** | 0.744** | 0.968** | 0.849**” |
*Statistically significant at the 0.05 percent and **level (0.01 percent and 0.05%, respectively)
Pl.Ht (cm): Plant Height; No.Br/Pl: Branches Plant-1; No.L/Pl: Leaves Plant-1; No.Cl/Pl: Clusters Plant-1; No.S/Pl: Number of Seeds Plant-1; No.P/Pl: Pods Plant-1; S.Y (g)/Pl: Seed Yield Plant-1; 100 S.Wt (g): 100 Seed Weight; R.L (cm)/Pl: Root Length (cm) Plant-1; No.R.N/Pl: Root Nodules Plant-1.
Table 2. Genotypic association between blackgram mutants in M3 generations for seed yield and yield contributing characteristics.
In M3 generation study, the correlation stastical analysis data revealed that highly significant both phenotypical and genotypical correlation among all the morphological characters under study. Positive and significant phenotypical and genotypical correlation was observed for the character seed yield (g/pl) vs. plant height (rp=0.817**, rg=0.868**) followed by vs. number of branches per plant (rp=0.713**, rg=0.725**), number of leaves per plant (rp=0.725**, rg=0.710**), number of clusters per plant (rp=0.803**, rg=0.973**), number of pods per plant (rp=0.797**, rg=0.959**), number of seeds per plant (rp=0.958**, rg=0.954**), 100 seed weight per plant (rp=0.722**, rg=0.779**), root length (cm) per plant (rp=0.757**, rg=0.832**), number of root nodules per plant (rp=0.331 NS, rg=0.744**). The correlation analysis results revealed that among ten quantitative characters, number of seeds/pl was phenotypically and genotypically significantly correlated with seed yield (rp=0.958**, rg=0.954*) followed by plant height (cm) (rp=0.817**, rg=0.868**), number of clusters per plant (rp=0.803**, rg=0.973**) number of pods per plant (rp=0.797**, rg=0.959**-), number of leaves per plant (rp=0.725**, rg=0.710**), 100 seed weight (g) (rp=0.722**, rg=0.779**), number of branches per plant (rp=0.713**, rg=0.725**”) (Tables 1 and 2). The correlation results revealed that significant association (genotypic and phenotypic) between and among the most important traits viz., pods, clusters per plant, seeds and seed yield per plant were reported earlier in blackgram by Goyal et al; Chaudary et al; Laskar et al; Raina et al. and Wani et al., in Lentil [18-25] (Table 3).
| “Characters | Heritability (%) | Genotypic coefficient of variations | Phenotypic coefficient of variations | Genetic advance | Genetic advance value % means |
|---|---|---|---|---|---|
| Pl.Ht (cm) | 59.498 | 15.051 | 19.513 | 10.848 | 7.674 |
| No.Br/Pl | 70.795 | 16.263 | 19.329 | 0.682 | 12.06 |
| No.L/Pl | 53.271 | 14.315 | 19.613 | 2.746 | 13.894 |
| No.Cl/Pl | 62.527 | 19.686 | 24.895 | 3.549 | 40.563 |
| No.P/Pl | 61.913 | 19.969 | 25.378 | 14.339 | 37.231 |
| No S/Pl | 66.923 | 18.124 | 22.154 | 54.305 | 43.352 |
| S.Y (g)/Pl | 74.947 | 21.474 | 24.805 | 2.465 | 65.935 |
| 100 S.Wt (g) | 64.843 | 11.213 | 13.925 | 0.590 | 14.234 |
| R.L (cm)/Pl | 53.586 | 9.400 | 12.840 | 3.024 | 4.695 |
| No.R.N/Pl | 43.846 | 10.514 | 15.878 | 19.700 | 24.958” |
Pl.Ht (cm): Plant Height; No.Br/Pl: Branches Plant-1; No.L/Pl- Leaves Plant-1; No.Cl/Pl-Clusters Plant-1; No.S/Pl: Number of seeds Plant-1; No.P/Pl: Pods Plant-1; S.Y (g)/Pl: Seed Yield Plant-1; 100 S.Wt (g): 100 Seed Weight; R.L (cm)/Pl: Root Length (cm) Plant-1; No.R.N/Pl: Root Nodules Plant-1.
Table 3. Heritability (narrow sense) estimates, genetic gain, GCV, and PCV for quantitative characteristics in black gram mutants in the M3 generation.
For the character plant height, the Phenotypic Coefficients of Variation (PCV) recorded was 19.513, Genotypic Coefficients of Variation (GCV) observed was 15.051. Heritability estimations were 59.497, and genetic progress was 7.674 percent above the norm. The Phenotypic Coefficient of Variation (PCV) for the trait number of branches per plant was measured at 19.329, whereas the Genotypic Coefficient of Variation (GCV) was measured at 16.263. Heritability estimations were found to be 70.795%, and the observed genetic improvement was 12.06% of the mean. The Phenotypic and Genotypic Coefficients of Variation (PCV and GCV) for the character of leaves per plant were 19.613 and 14.315, respectively [26]. The observed genetic improvement as a percent of the mean was 13.894, and the heritability estimates were 53.271. The observed Genotypic Coefficient of Variation (GCV) was 19.686, while the phenotypic PCV for the character number of clusters per plant was 24.895. Heritability estimations were 62.527, and genetic improvement was estimated to be 40.563% of the mean. The Phenotypic Coefficient of Variation (PCV) for the character of pods per plant was found to be 25.372, whereas the observed Genotypic Coefficient of Variation (GCV) was 19.969. Estimates of heritability were 61.912, and genetic progress was 37.231% above the mean. PCV of 22.154 was found for the phenotypic of seeds produced per plant, whereas a GCV of 18.124 was found for the corresponding genotypic correlation. A heritability estimate of 66.923 was found, while the observed rate of genetic progress as a percentage of the mean was 43.351. Seed yield (g/pl) had a PCV of 24.805, while the GCV was 21.474%. Heritability estimations were 74.947, and genetic advancement was estimated to be 64.935 percent of the mean. The observed Genotypic Coefficient of Variation (GCV) was 11.213 while the phenotypic PCV for the feature 100 seed weight (g) was 13.925. Heritability estimations were 64.843 and genetic progress was 14.23% above the mean. The observed genotypic coefficient of variation was 9.400 and the phenotypic PCV was 12.840 for the character root length (cm) [27]. Estimates of heritability were 53.585, and genetic improvement was reported as 4.695% of the mean. Phenotypic and genotypic coefficients of variation were both 15.878 and 10.514, respectively, for the character root nodule count per plant. The observed genetic improvement as a percentage of the mean was 24.957, and the observed heritability was 43.845. The heritability and genetic advance estimations results revealed that the maximum heritability, genetic advance mean value (%) recorded for the character seed yield (74.947% and 65.935%) numbers of pods per plant (61.913%) and seeds per plant (66.923%) are next, with clusters per plant (62.527%) and pods (40.563%) (Table 3). Consistent findings were also reported in blackgram by Konda, et al., Arulbalachandrarn, et al., Neelavathi and Govindarasu, Reni, et al., Kumar, et al., Panigrahi and Baisakh. According to the PCV data, the average number of clusters per plant was 24.895, the average number of seeds produced was 24.805, and the number of seeds per plant was 24.895, 22.154).The results also revealed that most of the characters under study were recorded higher PCV than GCV which indicates little environmental influence on the characters in the Blackgram mutants in M3 generation. Higher PCV and GCV for the traits clusters, pods and seed yield in blackgram under induced mutagenic treatment was also reported by Devi and Mullianathan, Cherian; Singh, et al.,; Manju and Sreelatha kumary.
The correlation results revealed that significant association (genotypic and phenotypic) between and among the most important traits viz., pods, “clusters per plant, seeds and seed yield per plant. The heritability and genetic advance estimations results revealed that the maximum heritability, genetic advance mean value (%) recorded for the character seed yield. The results revealed that most of the characters under study were recorded higher PCV than GCV which indicates little environmental influence on the characters in the blackgram mutants in M3 generation.
In the doctoral dissertation, the current research is included. We acknowledge Osmania university, Hyderabad for providing the lab and outdoor research locations. We also acknowledge the contribution of seed for the blackgram accession from ICAR-CRIDA, Hyderabad, and the NBPGR Regional center, Hyderabad.
[Crossref] [Google Scholar] [PubMed]
[Google Scholar] [PubMed]