
 Menu
Menu987-65-4329
987-65-4329

 555-666-0606
 M.Sudhanthiralingammal, S. kannan*
1Department of Environmental Studies, Madurai Kamaraj University, Palkalai Nagar, Tamilnadu, India
Received: 05-Sep-2022, Manuscript No. JEAES-22-73776; Editor assigned: 07-Sep-2022, PreQC No. JEAES-22-73776 (PQ); Reviewed: 21-Sep-2022, QC No. JEAES-22-73776; Revised: 03-Jan-2023, Manuscript No. JEAES-22-73776 (R); Published: 11-Jan-2023, DOI: 10.4172/2347-7830.11.1.002
Physico-chemical analysis; Biological oxygen; Dissolved oxygen; Fresh water resources; Limnology
Water is the most vital resource of all kinds of life. Water forms a medium in which physical, chemical and biological significance takes place. Water is an elixir of the body and it is a primary need of all living organisms. Water is considered as a valuable commodity available in very limited quantities to man and other living beings. Water serves as a major source for agricultural growth of crops, drinking purposes, industrial developments. Living organisms are facing the problem of ever widening threat of water pollution due to invasion modern technology leads to modernized civilization and occurrence of industrialization. The increasing industrialization, urbanization and developmental activities, to cope up the population explosion have brought inevitable water crisis and the demand for freshwater has already exceed its supply in different parts in the world. It has become a major problem all over the world, be it a developed, developing or underdeveloped country, though there exists a disparity in the water use pattern of these countries. Though water is a renewable resource, reckless usage and improper management of water systems [1].
An aquatic ecosystem is an ecosystem that is based in water. Inland water resources, in India are diversified, as reservoirs, lakes, tanks and ponds are exhibit distinct seasonal fluctuations in their physico-chemical and biological features. The assessment of water quality physico-chemical and biological parameters play very important role is essential. The study of different water bodies is very important in understanding of the metabolic events in aquatic ecosystems. A number of workers from India and different parts of the world have made great contribution in the field of limnology for a long time.
Water quality is needed to the entire life of fish as it provides the necessary requirement for the welfare of fish such as reproduction, breathing, feeding and growth. Reservoir is a water body which facilitates for studying the effect of scale on the relat ive importance of factors that determine diversity of organisms especially fish fauna. The Western Ghats is the richest region in India with respect to endemic freshwater fishes. Indian reservoirs preserve a rich variety of fish species, which supports to the commercial fisheries. There is an increasing interest in reservoir water quality, in view of multitude of benefits (water supply, flood control, hydropower generation, navigation, fish culture and wild life conservation, recreation etc.) they offer to the mankind, the dam water is basically used for domestic, agricultural purposes and fisheries activity. In India, still now several researchers have done study on physicochemical and biological characteristic of standing and running water resources (Figures 1 and 2).
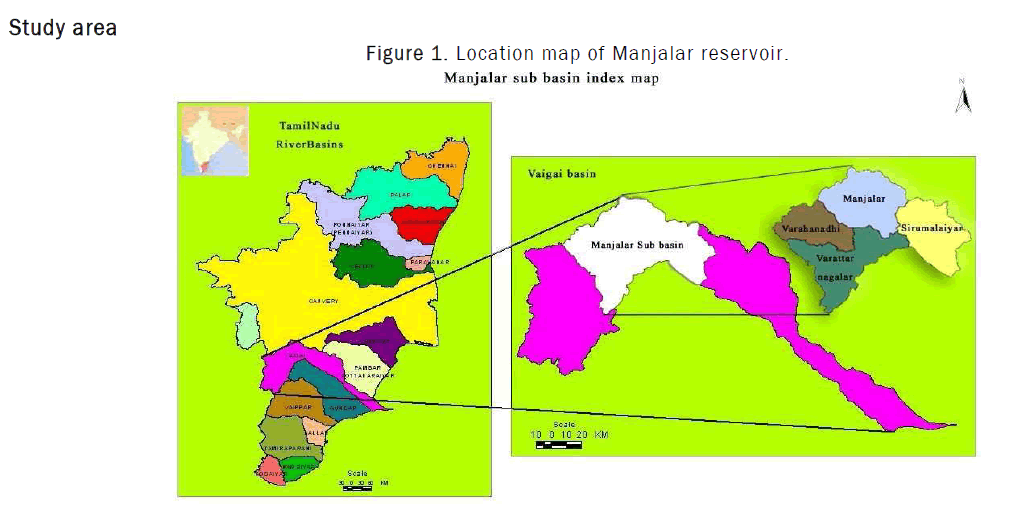
Figure 1: Location map of Manjalar reservoir.
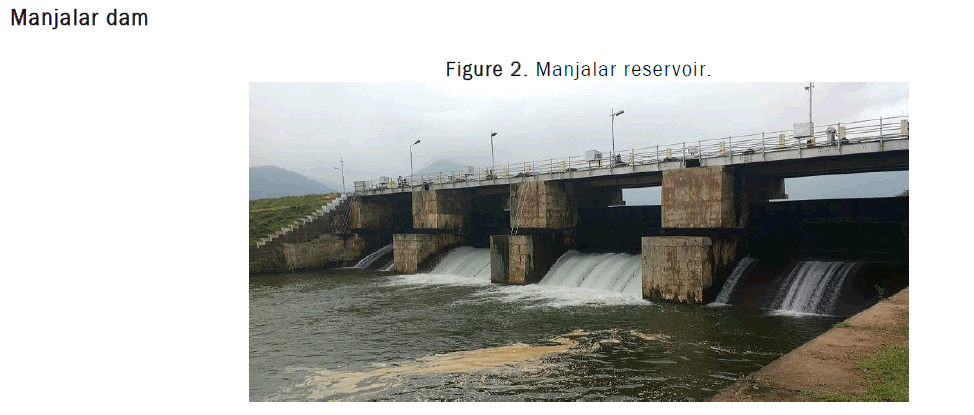
Figure 2: Manjalar reservoir.
Many workers have reported the status of water bodies both lentic and lotic in India and their levels of pollutants in water (physical, chemical and biological) quality were reported. Hence the objectives of the study in the present investigation is to assess the hydrobiology by studying the relationship between different parameters of Manjalar reservoir located on the Palani Hills, Western Ghats [2].
Manjalar reservoir a fresh water body was selected for the present study. Manjalar reservoir built in the year 1967 for irrigation purpose. It originates from Palani hills and run towards East and joins the Vaigai river. Having small branched into a number of regulates like Mulliur, Varattar, Iruttar and Maruthanadhi. The Reservoir extends up to Manjalar road located about 5.5 kms North from NH-36 at Devadanapatti town in Theni district. The Manjalar reservoir latitude-10.21 North, longitude-77.62 East, alttitude-359.00 m/1177.82 Ft, and elevation–597 m/1959 feet. 14 number of freshwater fish species are present. The reservoir type is earthen surrounded by mango farms and has been constructed for irrigation purposes. The reservoir is mainly acts as breeding place for tilapia fishery [3-8].
Sample collection
For estimation of Physico-chemical parameters, water samples were collected twice per month on fortnight basis. Samples were collected from four different permanent stations. Surface samples were collected using a clean plastic container for the study of various physico-chemical and biological parameters. All the sample collection and observations were made in the morning time (i.e 8:00 am to 10:00 am) and some of the parameters were calculated at the collection point and other parameters were estimated in the lab throughout the study period. Water samples collected for the estimation of various parameters were brought to the laboratory and subjected to analysis immediately as far as possible. Standard methods for estimation of water (water and waste 20th edition, 2005 (APHA, AWWA) was followed in this investigation [9].
Analysis of water samples
Physico-chemical characteristics of water such as air temperature, water temperature, pH, electrical conductivity, Total Dissolve Solids (TDS), Dissolved Oxygen (DO), Chemical Oxygen Demand (COD), Biochemical Oxygen Demand (BOD), total hardness, alkalinity, chloride, sulphate, phosphate, nitrate, nitrite, and free carbon dioxide, were analyzed according to standard methods APHA; Trivedi and Goel.
The water quality parameters of the samples analyzed have been presented and discussed with references to the variations of physicochemical parameters of Manjalar reservoir water samples were observed results and discussed below [10].
Atmospheric temperature
Temperature influences the biological reaction in water. A temperature of about 40°C is permissible limit for drinking water. According to Jhingran the bet suitable temperature range for fish culture is 25-31°C. The air temperature is one of the important factors in aquatic environment, since it regulates physico-chemical as well as biological activities. In the present study investigated, atmospheric temperature was recorded as maximum of 33°C in the month of March and minimum of 27°C in the month of December (Figure 3). Similar pattern of changes in the atmospheric and Water temperature was reported by Sathe, et al. [11-14].
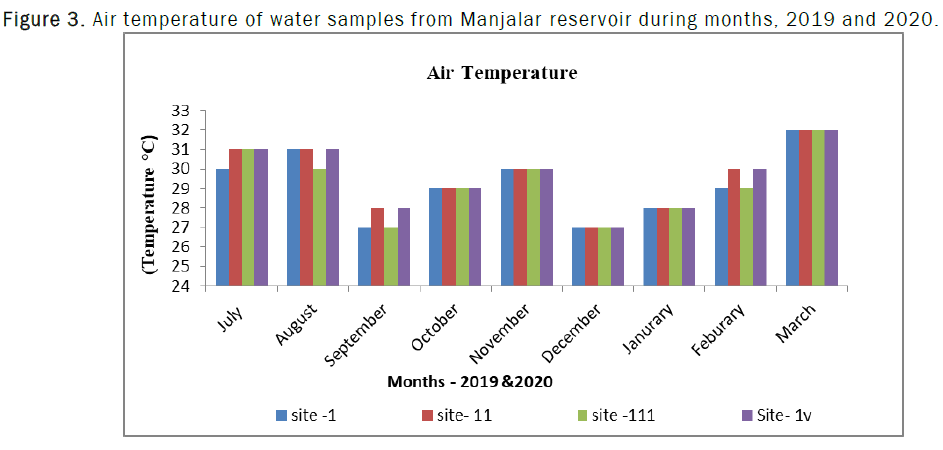
Figure 3: Air temperature of water samples from Manjalar reservoir during months, 2019 and 2020.
Water temperature
Temperature is a physical factor that alters the water characteristics and consider as an important factors which determines the population of flora and fauna as well as the functioning of aquatic ecosystems. Water temperature measurement is an indicator for various chemical, biological activities.
In the present study investigated, Water temperature recorded as maximum of 31°C in the month of March and minimum of 25°C in the month of December (Figure 4). Similar study was findings in atmospheric and water temperature were noticed during summer season and lowest was recorded during the winter season. This observation has been true for several water bodies in India [15].
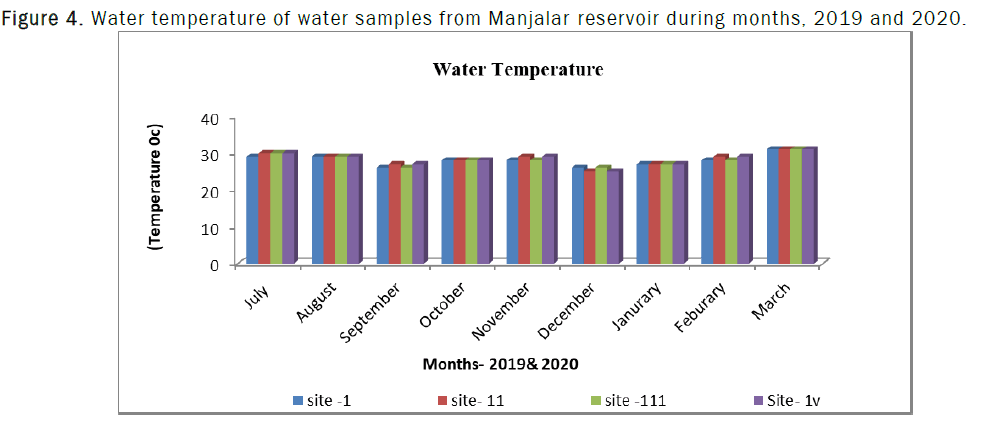
Figure 4: Water temperature of water samples from Manjalar reservoir during months, 2019 and 2020.
pH
pH is maintains the acidic or basic property of water bodies. pH is a vital factor for any aquatic ecosystem, since all the biochemical activities and retention of physico-chemical attributes of the water are greatly dependent on pH of the water. Aquatic organisms need the pH of their water body to be a certain range of optimal for the survival. The permissible limit of pH scale in drinkable water is 6.5-8.5 consistent with bureau of Indian normal. The WHO and BIS recommendation of pH is 6.5-8.5. In the current study the pH range is a safe for fish production and drinking water. The high level of pH in summer was observed in present investigations may be due to increased photosynthesis.
In this study the present investigation, was highest pH values 7.6 were observed in March and lowest values 6.5 were recorded in the month of July. (Figure 5). Similar results were observed. According to Jhingran the pH range from 7 to 9 is considered good for fish culture [16].
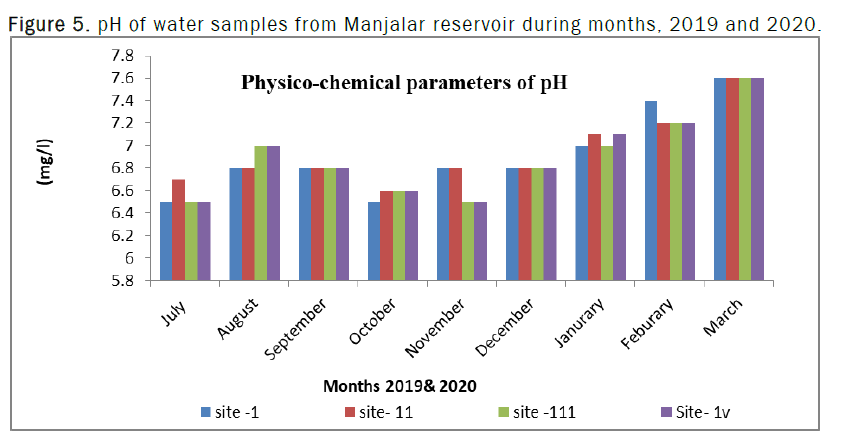
Figure 5: pH of water samples from Manjalar reservoir during months, 2019 and 2020.
Electrical Conductivity (EC)
Electrical conductivity is a numerical value. This is the ability of an aqueous solution to take away the electric current. The purity of water is evaluated by EC (Electrical Conductivity) and therefore it is a useful tool to check the purity of water. EC values for all the investigated samples were found to be in the range 300-490 μS/cm. These were greater than the limits prescribed by WHO (300 μS/cm.). The standard limit of EC in drinking water prescribed as 1000 μs/cm BIS (as per IS 2296). The KEBS permissible limit for electrical conductivity 1400 μScm-1 [17].
In the present investigation, electrical conductivity maximum values of 215 μS/cm was observed in the month of December and minimum values of 120 μS/cm was recorded in the month of March (Figure 6). Jayalakshmi, et al. reported that electrical conductivity values of 225 μS/cm, Elala river were within standard permissible unit which are similar to our present findings [18].
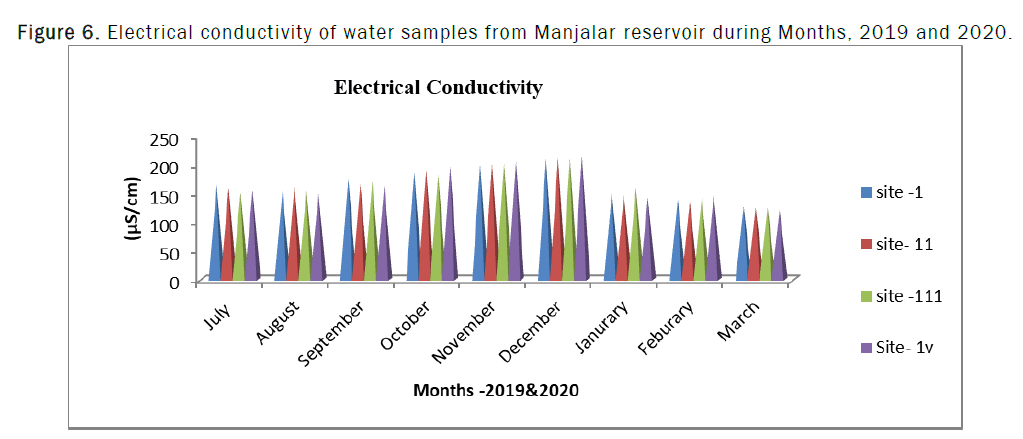
Figure 6: Electrical conductivity of water samples from Manjalar reservoir during Months, 2019 and 2020.
Total Dissolved Solids (TDS)
Total dissolved solids are the total amount of mobile charged ions, including minerals, salts or metal dissolved in a given volume of water in mg/l. Total dissolved solids, might impact on water quality adversely in many ways. A different kind of minerals which is present in water is denoted by total dissolved solids. TDS is directly associated with the purity of water and also the quality of water [19].
In the present study investigated, total dissolved solids were recorded as maximum 188 mg/l in the month of August and minimum 110 mg/l in the month of March (Figure 7). A more or less similar trend was observed by Bhutiani, et al. As per IS: 10500-2012, acceptable limit is 500 mg/l and permissible limit is 200 mg/l.
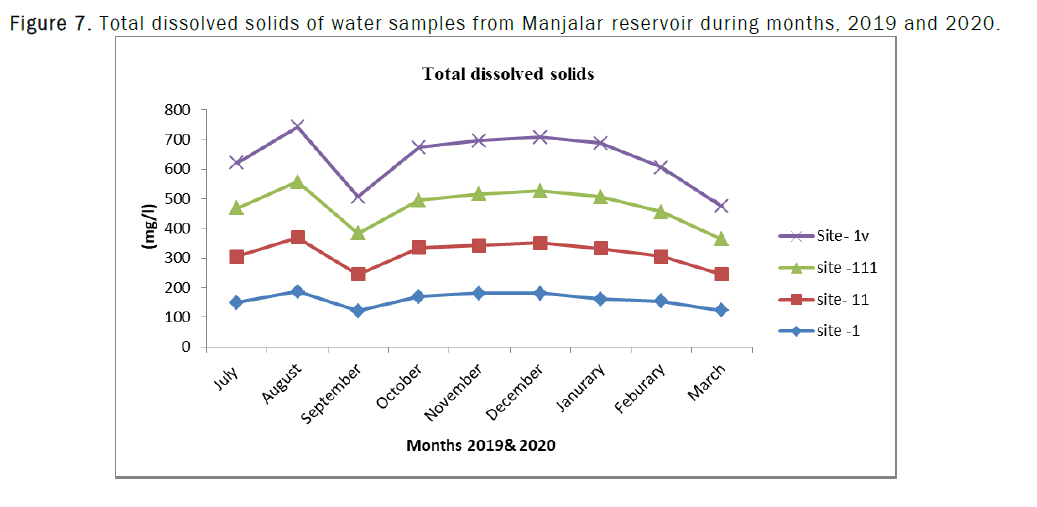
Figure 7: Total dissolved solids of water samples from Manjalar reservoir during months, 2019 and 2020.
Chloride
Chloride is one of the major inorganic anions in water and waste water. Chlorides are not utilized directly or indirectly by the aquatic plants and hence it exists in the aquatic systems. It is responsible for a large amount of organic matter, which in turn causes eutrophication. The permissible limit of chloride according to WHO is ranging from 200–600 mg/l where as 250–1000 mg/l by BIS. The BIS suggested the standard of having set a desirable limit of chloride in drinking water to be 250 mg/l and permissible value has been prescribed to be 1000 mg/l.
In the present study investigated, chloride was recorded as maximum level of 49 mg/l in the month March and minimum of 20-22 mg/l in the month of July and August (Figure 8). The chloride reached maximum during summer season when the water level was low. Such condition were observed by and reported that the rising level of chlorides may be due to increased summer temperature and evapotranspiration [20].
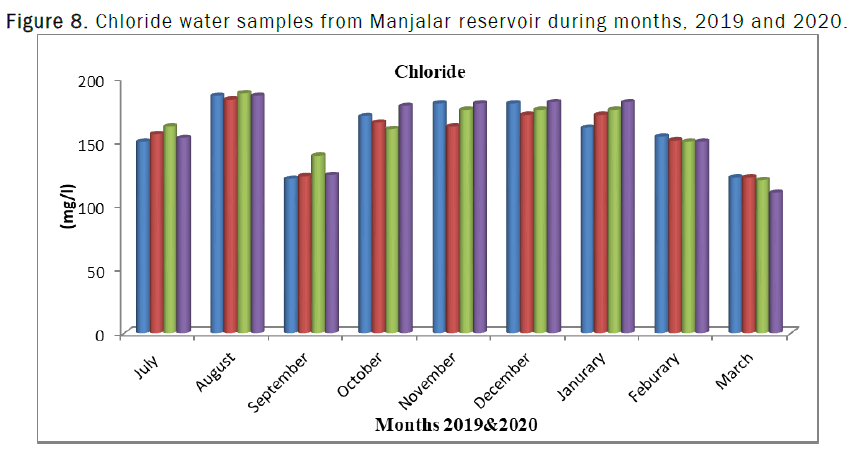
Figure 8: Chloride water samples from Manjalar reservoir during months, 2019 and 2020.
Mukherji and Nandi, Sakhare, et al., 2011, made similar observations and recorded highest value of chloride during summer (40.21 mg/l), and lowest value during winter (35.14 mg/l) of Sai reservoir district Lautr, Maharastra. Recently, Lingampally, et al., observed high concentration of chloride during summer and low concentration during winter.
Total alkalinity
Total alkalinity was considered as nutrient rich. The richness of nutrients also makes water body good for fish culture. Alkalinity is an important quality aspect of water and it is the water’s property to neutralize acids. Alkalinity of a fresh water body depends upon the presence of carbonate and hydroxide compounds of calcium, sodium and potassium. Alkalinity could be a chemical activity of water and ability to neutralize acid, Hydroxide, carbonate and bicarbonate are the major components for the alkalinity in natural water. In potable water 120 mg/l is the acceptable limit of alkalinity. The KEBS permissible limit is 500 mg/l.
In the present study investigated, total alkalinity recorded as maximum 56 mg/l in the month of March and minimum 32 mg/l in the month of November and December (Figure 9). The alkalinity was recorded during summer and minimum during winter season. Recently in Pagara reservoir maximum total alkalinity was recorded (55 to 135 mg/l) during summer and minimum during winter. The higher alkalinity in summer may be attributed to increased rate of decomposition, during which carbon dioxide is liberated which reacts with to water from HCO3 increasing the total alkalinity in summer. Similar results were reported by Kaur H, et al.
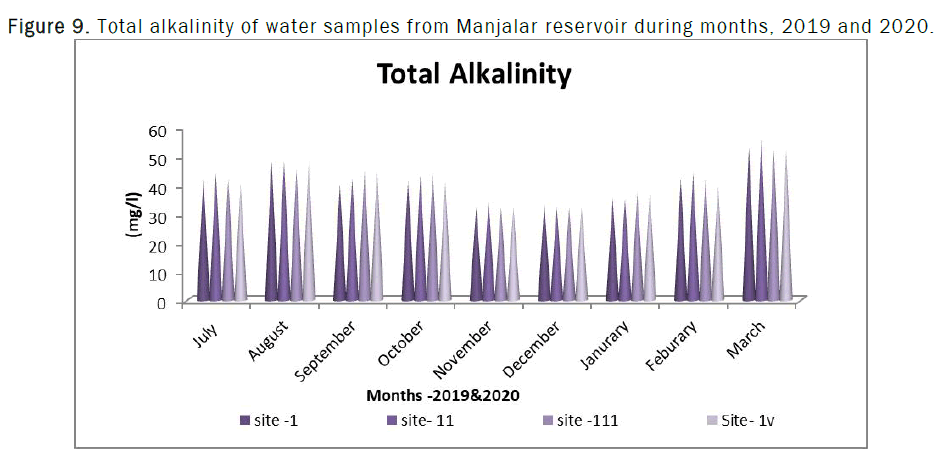
Figure 9: Total alkalinity of water samples from Manjalar reservoir during months, 2019 and 2020.
Dissolved oxygen
Dissolved oxygen is one of the most important factors in any aquatic ecosystem. It is an indication of the physical, chemical and biological processes that are taking place in water. There are no specifications for dissolved oxygen standards as per the KEBS but the research reveals that sufficient level of dissolved oxygen in water is important. Lower oxygen level in water indicates corrosion of chemical substances which raise the temperature level. The standard value for DO is 5 mg/L. the water will be good quality and will support fish production. The optimum level of DO helps in proper growth of the aquatic life living in the bandh.
In the present study investigated, Dissolved oxygen recorded as maximum 4.4 mg/l in the month November and minimum 3.2 mg/l in the month of March (Figure 10). Lower dissolved oxygen values were observed during summer season due to increased temperature and oxygen level increased during winter season because decreased temperature.
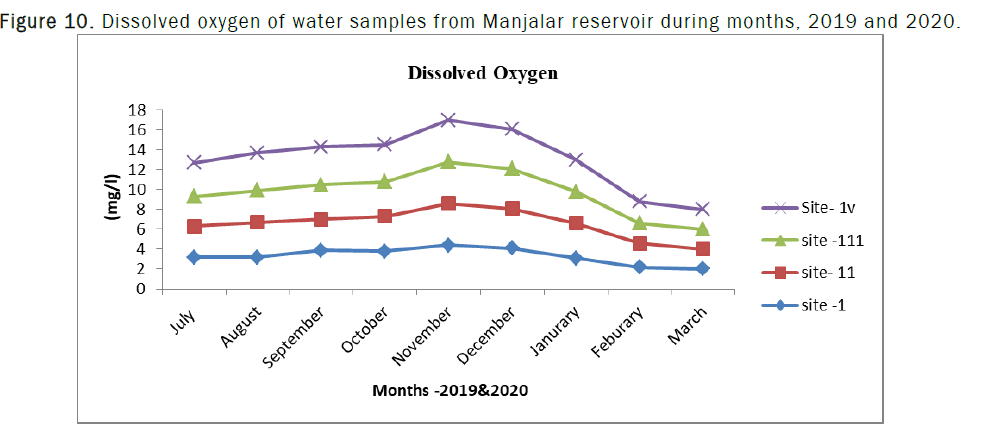
Figure 10: Dissolved oxygen of water samples from Manjalar reservoir during months, 2019 and 2020.
The same trend of dissolved oxygen maximum in winter and minimum summer season. The range of dissolve oxygen recorded 4.8- 8.2 mg/l show the water to be of good and will support fish production.
Free carbon dioxide
Free carbon dioxide CO2 is vital in the life of plant and microorganisms. Free carbon dioxide CO2 is produced as a result of respiration of aquatic organisms. Carbon dioxide (CO2) is present in water supplies in the form of dissolved gas. Typically, surface water contain less than 10 mg/L free carbon dioxide while ground waters may have much higher concentrations. Carbon dioxide is particularly influential in regulating pH, organic decomposition, respiration, photosynthesis, diffusion and run off etc. It absence or low concentrations recorded in most of the times may be due to the alkaline nature of the water in both the reservoirs.
In the present study investigated, free carbon dioxide recorded as maximum 3.8 mg/l in the month November and minimum 1.4 mg/l in the month of March (Figure 11). Similar reported the value of free CO2 maximum during summer and minimum winter followed by monsoon. Garg, et al., recorded high values of free CO2 (6.32 mg/l) in Ramsagar reservoir.
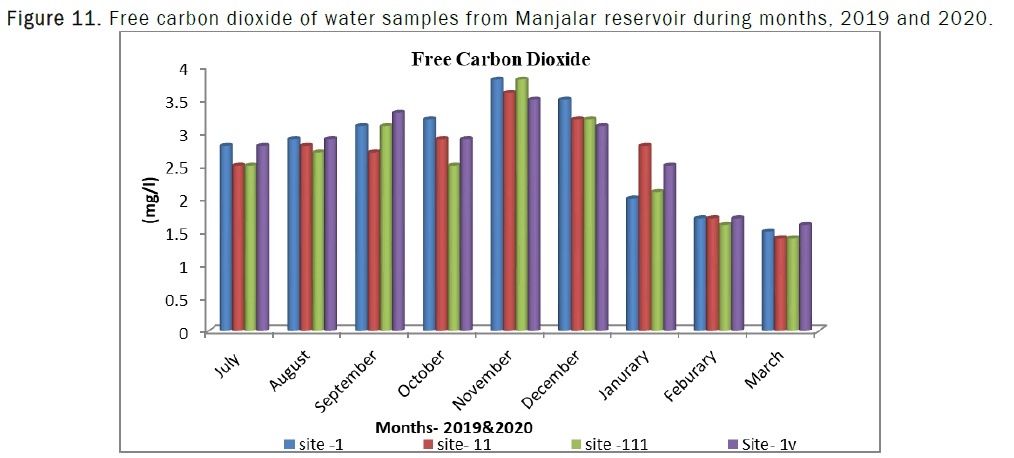
Figure 11: Free carbon dioxide of water samples from Manjalar reservoir during months, 2019 and 2020.
Total hardness
Total hardness is defined as the sum of calcium and magnesium hardness in mg/L as Caco3. Hardness of water is a measure of its capacity to form precipitates with soap and scales with certain anions present in the water. Water hardness arises due to the presence of cations such as calcium, magnesium and anions such as bicarbonates, chlorides and sulfides. Total hardness in fresh water is usually in the range of 15 to 375 mg/L as Caco3. Calcium hardness in freshwater is in the range of 10 to 250 mg/L. A high concentration of hardness may be due to leaching of calcium from of the soils or due to the high background concentration of the waters. WHO permissible limit for total hardness of water is 150 mg L-1 and desirable limit was 300 mgL-1. The sum of calcium and magnesium hardness in mg/l is equal to the total harness. The degree of hardness of potable water has been classified in terms of equivalent CaCo3 concentration as follows: Soft-0-60 mg/l, medium–60-120 mg/l, Hard–120-180 mg/l, terribly hard->a hundred and eighty mg/l.
In the present study investigated, Total hardness recorded as maximum 87 mg/l in the month of March and minimum 40-42 mg/l in the month of November and December (Figure 12). High hardness during summer month which might have caused increased concentration of salts by excessive evaporation as also observed. Many scientist consider hardness the same as total alkalinity, since both are expressed as calcium, seasonally on an average hardness of the water was found to be 155 mg/l and 80 mg/l in summer and winter season respectively.
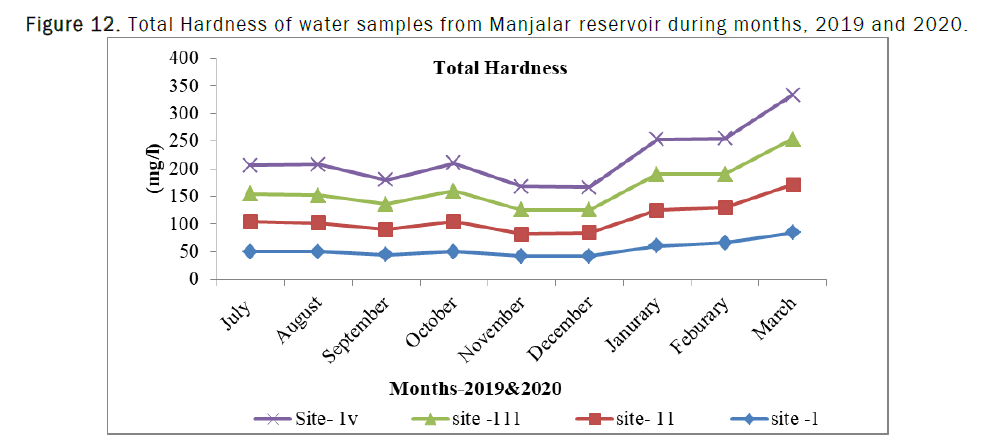
Figure 12: Total Hardness of water samples from Manjalar reservoir during months, 2019 and 2020.
Similar report has been observed by Pathak and Mudgal, In Virla reservoir, Khargone (India). The reported total hardness was high during summer than monsoon and winter season, High value of hardness during summer can be attributed to decrease in water volume and increase the rate evaporation of water. Similar results were obtained in the present study.
Biochemical oxygen demand
Biochemical oxygen demand is nothing but the amount of oxygen utilized by microorganisms to stabilize the organic matter. BOD is a measure of the water that is required by the aerobic organisms. The biodegradation of organic materials exerts o2 tension in the water and increases the biological oxygen demand. BOD determines the strength, effluents and other polluted waters and provides data on the pollution load in all natural waters. Biochemical oxygen measures the amount of oxygen that microorganisms consume while decomposing organic matter, it also measures the chemical oxidation of inorganic matter, BOD is a measure of organic material contamination in water, specified in mg/ L. BOD values for water samples were found 2-4.8 mg/l. the permissible limit for drinking water is 30 mg/l.
In the present study investigated, biological oxygen demand recorded as maximum 4.8 mg/l in the month of December and minimum 2 mg/l in the month of March (Figure 13). Similar reported by Srinivas Reddy, et al. BOD was ranged between 3 to 5.8 mg/l. The reported maximum 1.55 mg/l and minimum 0.57 mg/l. potential were recorded in winter and summer season respectively.
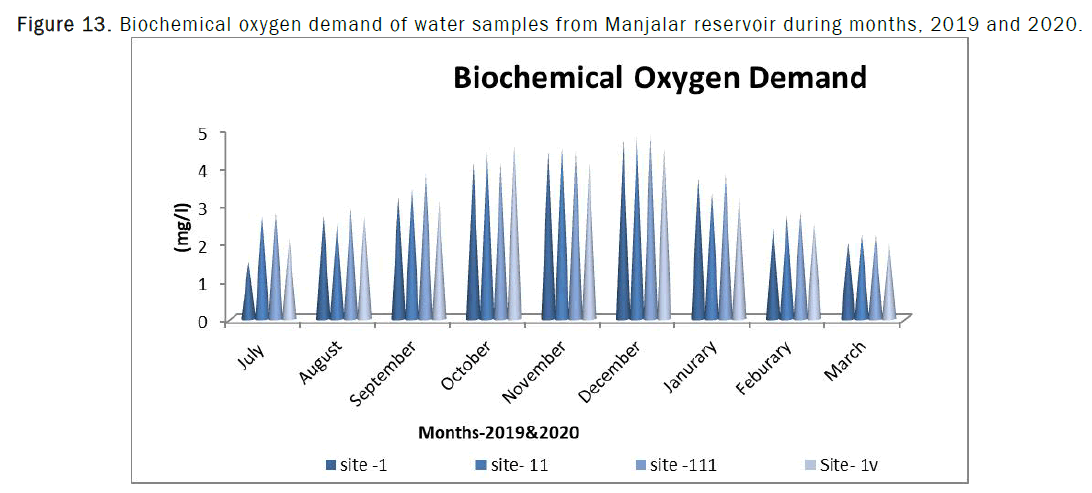
Figure 13: Biochemical oxygen demand of water samples from Manjalar reservoir during months, 2019 and 2020.
Chemical Dissolved Oxygen (COD)
Chemical Dissolved Oxygen (COD) is a measure of oxygen required to oxidize the organic matter by a strong chemical oxidant. It is used to measure the pollution strength of domestic and industrial wastes. COD gives an idea of concentration of substances, which may undergo immediate chemical oxidation. All organic compounds with little exception can be oxidized by the action of strong chemical oxidants under acidic conditions. The chemical oxygen demand test procedures is based on the chemical decomposition of organic and inorganic contaminants, dissolved or suspended in water. COD is a measure of pollution in aquatic ecosystems. Higher COD is summer months may be due to high temperature and higher concentration of suspended and dissolved solids. The measure of COD determines the quantities of organic matter found in water. This makes COD useful as an indicator of organic pollution in surface water. In the present study investigated, chemical oxygen demand recorded as maximum 6.8 mg/l in the month of December and minimum 3.1 mg/l in the month of March (Figure 14). Similar results were observed by Balakrishna Dhatrika, Agarwal et al., and Uniyal.
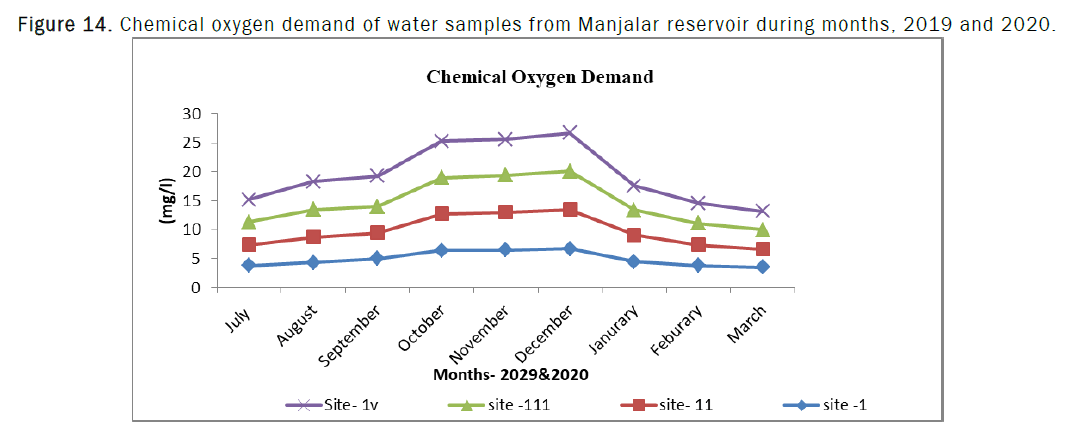
Figure 14: Chemical oxygen demand of water samples from Manjalar reservoir during months, 2019 and 2020.
Nitrate
Nitrate is naturally occurring inorganic ions present our environment. Nitrate is the most highly oxidized from of nitrogen commonly present in natural waters. It is produced by aerobic decomposition of organic nitrogenous matter. The permissible limit of nitrate in water is 10 mg/l which it’s concentration above the guidelines causes blue baby syndrome or methaemoglobinaemia in infants and gastric cancer in human.
In the present study investigated, nitrate recorded as maximum 4.8 mg/l in the month of August and minimum 2.3 mg/l in the month of December (Figure 15). Similar results were recorded in highest values nitrates recorded during rainy season and lowest during winter season. Generally, water bodies polluted by organic matter exhibit higher values of nitrates.
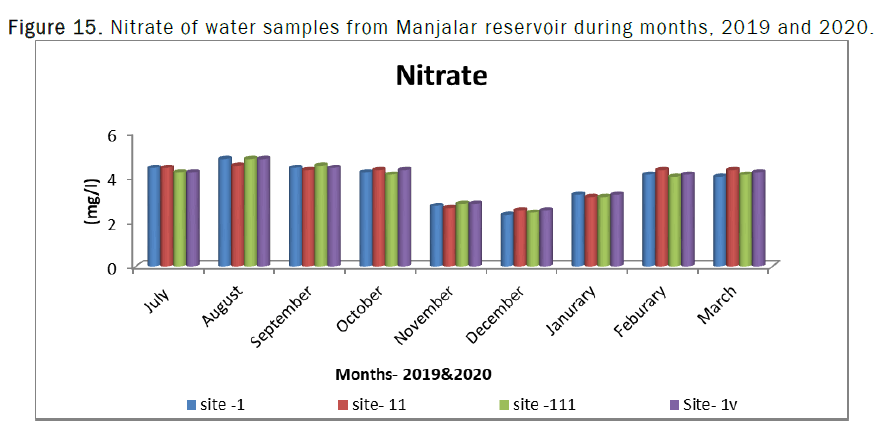
Figure 15: Nitrate of water samples from Manjalar reservoir during months, 2019 and 2020.
Nitrite
Nitrite being intermediate oxidation state between ammonia and nitrate can appear as a transient species by the oxidation of ammonia or by the reduction of nitrate and also often released in to the water as an extracellular product in to planktonic organisms. Levels in unpolluted waters are normally low, that is below 0.03 mg/dm3 NO2. Values greater than this indicate sewage pollution WHO 1993. All drinking water sources also should be tested for bacteriological contamination. Particularly if the nitrate-nitrogen level exceeds the 10 mg/l standard. The U.S public health service recommended a limit of 10 mg/l No3-N drinking water is used by the EPA as the maximum contaminant level for public water systems.
It was found out that in the present study nitrite recorded as maximum level of 0.05 mg/l in the month of October and minimum 0.02 mg/l in the month of March (Figure 16). Similar results were recorded in minimum summer month 0.014 mg/l and maximum 0.048 in winter season. It also inversely related to temperature.
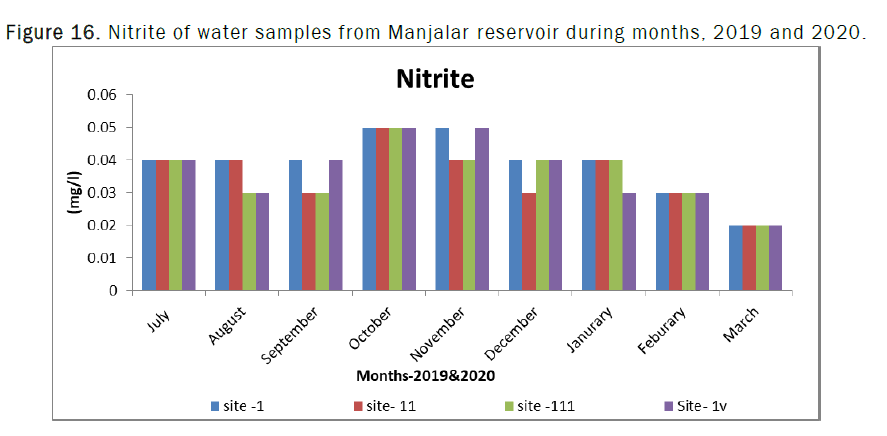
Figure 16: Nitrite of water samples from Manjalar reservoir during months, 2019 and 2020.
Sulphate
Sulphate it is measured by nephelometric method, in which the concentration of turbidity is measured against the known concentration of synthetically prepared sulphate solution. Sulphate is widely distributed in nature and may be present in natural waters. The main source of sulphur is the rocks present near the water bodies and biochemical action of anaerobic bacteria. Sulphate form an important constituent of hardness and used by organisms for protein synthesis. It enters in to water body by weathering of sedimentary rocks, bathing, washing cloths. Sulphur is utilized by all living organisms in the form of both mineral and organic substances. The highest concentration of sulphates was observed during monsoon may be due to the dilution and utilization of sulphate by aquatic plants. However, the low sulphate concentration was noted during winter may be due to biodegradation and low water level.
In the present study investigated, sulphate recorded as maximum 5 mg/l in the month of July and minimum 3 mg/l in the month of December (Figure 17). Similar results have been reported observed high value in monsoon.
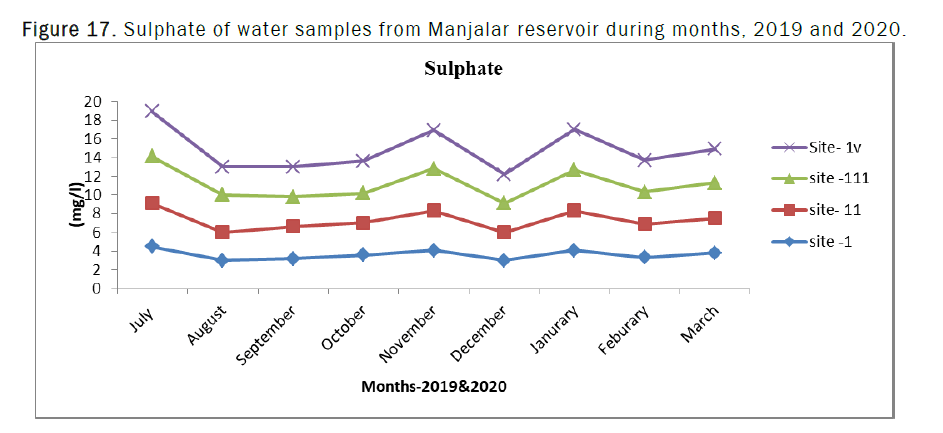
Figure 17: Sulphate of water samples from Manjalar reservoir during months, 2019 and 2020.
Phosphate
Phosphorus is generally recognized as a key nutrient in deciding the fertility of a water body. It frequently limits plant production and ultimately influences fish production. It’s occurrence in ground water as a result of leaching form domestic sewage and detergents. Phosphorus is regarded as one of the most essential nutrients limiting the growth of autotrophic organism which are the primary producers and sources of aquatic system. It occurs solely as phosphate in both natural as well as wastewater. It may also occur in water as are result of agricultural effluents with fertilizers and industrial waste water. High concentration of phosphate therefore is an indicative of ground water contamination.
In the present study investigated, phosphate recorded as maximum 0.06 mg/l in the month of March and minimum 0.01 mg/l in the month of December (Figure 18). Similar results have been reported the phosphate content in Vuyyuru, Andhra Pradesh was found in the range of 0.31 to 0.66 mg/l and it was within the limit (Table 1).
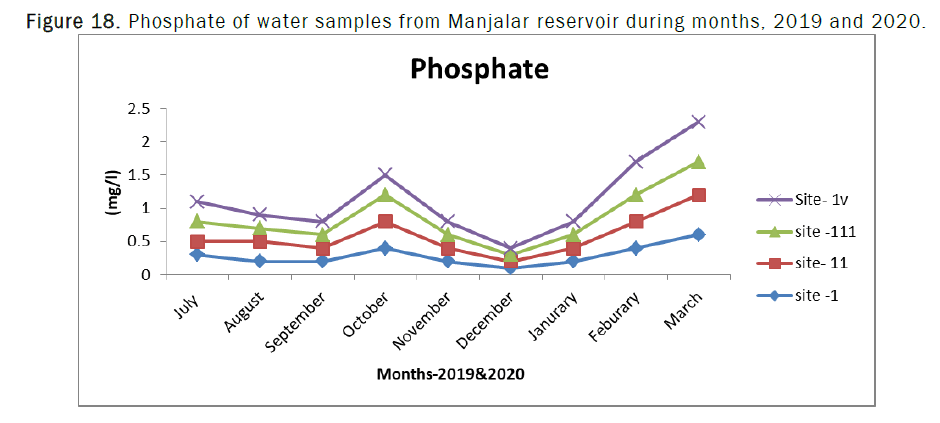
Figure 18: Phosphate of water samples from Manjalar reservoir during months, 2019 and 2020.
| Parameters | USEPA | WHO | ISI | ICMR | CPCB | BIS |
|---|---|---|---|---|---|---|
| PH | 6.5-8.5 | 6.5-8.5 | 6.5-8.5 | 6.5-9.2 | 6.5-8.5 | 6.5-8.5 |
| Turbidity | - | - | 10 | 25 | 10 | - |
| Conductivity (mg/l) | - | - | - | - | 2000 | - |
| Alkalinity (mg/l) | - | - | - | - | 600 | 200/600 |
| Chlorides (mg/l) | 250 | 200 | 250 | 1000 | 1000 | 250/1000 |
| Total hardness (mg/l) | - | 500 | 300 | 600 | 600 | - |
| Calcium (mg/l) | - | 75 | 75 | 200 | 200 | - |
| Magnesium (mg/l) | - | 50 | 30 | - | 100 | - |
| Nitrate (mg/l) | - | - | 45 | 100 | 100 | 45 |
| Nitrite (mg/l) | 10 | 10 | - | - | - | 5 |
| Sulphate (mg/l) | - | - | 150 | 400 | 400 | 200 |
| Phosphate (mg/l) | - | - | - | - | - | 5 |
| TDS | - | 500/1500 | - | - | - | |
| Dissolved oxygen | - | 5 | - | - | - | - |
| COD | 40 | 10 | - | - | - | - |
| BOD | 5 | 6 | - | - | - | - |
Table 1. Comparison of different physico-chemical parameters with suggested water standards by WHO and BIS for drinking water supply.
The result of present investigation indicated the parameters of temperature, pH, electrical conductivity, dissolved oxygen, total dissolved solids and chloride were highest in the summer season, and lowest winter season. The nutrient parameters nitrates, and sulphates increased during rainy season, and lowest during summer season. It was concluded that all the physico-chemical parameters of Manjalar reservoir water samples ranged in permissible limit of APHA and WHO for drinking water. The study indicates that the water of Manjalar reservoir is suitable for drinking purpose. Different parameters indicate that the water is suitable for fish culture, irrigation, agriculture and domestic purposes. Hence it is recommended that regular monitoring is needed to maintain water quality.
[Crossref] [Google Scholar] [PubMed]
[Google Scholar] [PubMed]