ISSN ONLINE(2319-8753)PRINT(2347-6710)
ISSN ONLINE(2319-8753)PRINT(2347-6710)
P.Satish1, V. Lakshmana Rao2,
|
| Related article at Pubmed, Scholar Google |
Visit for more related articles at International Journal of Innovative Research in Science, Engineering and Technology
The Air pollution study is most predominant in present situation. This case study mainly states that the concentrations of the air pollutants over coastal and urban areas by using histograms. The observing parameters are SO2, NO2, RSPM, and SPM in μg/m3 from the time period is 2006 to 2009. The concentration of TSPM (Total Suspended Particulate Matter) is high in both urban and coastal industrial areas when compared with other parameters. There is a small variations between Hyderabad and Visakhapatnam in the year of 2007 mainly the stations are Seetammadhara, Police Barracks in Visakhapatnam and Paradise in Hyderabad. In the year of 2008 the annual concentration over Hyderabad is higher than the Visakhapatnam. In Hyderabad area (Charminar) the pollution concentration is same over all the months but in Visakhapatnam concentration is high from January to July. After that gradually decrease from August- December it may rainfall activity. In the Sensitive areas the annual concentration over Hyderabad is greater than Visakhapatnam. But in the year of 2009 annual concentration is little greater over Visakhapatnam than Hyderabad.
Keywords |
| Coastal, Urban, Rainfall and Air pollution |
INTRODUCTION |
| Air pollution in urban areas comes from a wide variety of sources. The sources responsible for high emission loads are grouped into several sectors such as transport, domestic, commercial and industrial activities for anthropogenic sources and NMVOCs from biogenic sources. Transport sector includes mainly motor vehicles, trains, aircraft, ship and boats while industry and domestic activities include fuel combustion including wood, coal, and gas for heating and production. Besides, biogenic (natural) emissions include NOx and VOC emissions from vegetation and soils (Guenther et al., 2006). Today, urban air quality is a major concern throughout the world. Molina (2002) indicated that the quality of the air we breathe is fundamental to the quality of life for the growing millions of people living in the world's burgeoning megacities and deteriorating urban air quality threatens the public health. Furthermore, airborne emissions from major urban and industrial areas influence both air quality and climate change. This challenge is particularly acute in the developing world where the rapid growth of megacities is producing atmospheric pollution of unprecedented severity and extent. Mage et al. (1996) reviewed the difficulties in finding solutions to the air pollution in the megacities. Baldasano et al. (2003) examined the air quality for the principal cities in developed and developing countries. According to the study, the current state of air quality worldwide indicates that SO2maintains a downward tendency throughout the world, with the exception of some Central American and Asian cities, whereas NO2 maintains levels very close to the WHO guideline values in many cities. However, in certain cities such as Kiev, Beijing and Guangzhou, the figures are approximately three times higher than the WHO guideline value. In the Asian databases consulted, only Japan showed really low figures. Surface ozone levels presents average values that exceed the selected guideline values in all of the analysis by regions, income level and number of inhabitants, demonstrating that this is a global problem with consequences for rich and poor countries, large and medium cities and all the regions. More than 75 per cent of the rainfall is received during the south-west monsoon season, i.e., from June to September, July being the month when it rains. September is the month, when there are rains. The south-west monsoon sets in by the 7th of June. Its advent is sudden and the rainfall increases from less than 5 per cent (of the annual) in May to 15 per cent in June. Humidity during the monsoon season is very high exceeding 75% from July to September. In the dry months of March, April and May, humidity is comparatively low with an average of 25 to 30%.According to India Meteorological Department, the summer months of April & May 2009 recorded the warmest temperatures since 1901, with mean maximum temperatures hovering frequently at around 42°C with maximum temperature touching 45°C. |
II. DATA AND METHODOLOGY |
| In this study we taken major air pollutants are TSPM (Total suspended particulate matter), RSPM(Respirable suspended particulate matter), SO2 and NO2 in different regions in the Visakhapatnam urban region those are Mindi (BHPV), IE Marripalem (Industrial Area), PoliceBarracks (Transportation), Gnanapuram (Industrial Port area), Veerabahu (INS Kalinga) Seetammadhara (Domestic area) in the years 2006-2009. While in the Hyderabad region also have been taken in different areas those are CITD Balanagar, Uppal, and Nacharam (Industrial Areas), ABIDS Circle, Charminar, Jublee Hills , and Paradise (Residential Areas) and Zoo Park (Sensitive Areas). In this study mainly we observed the concentration of Air pollutants over an urban and coastal industrial area. |
III. RESULTS AND DISCUSSIONS |
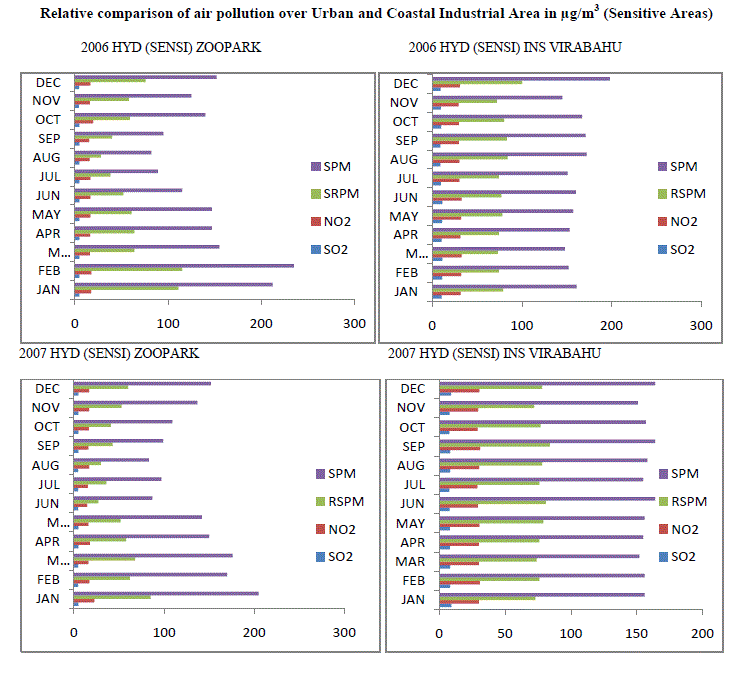
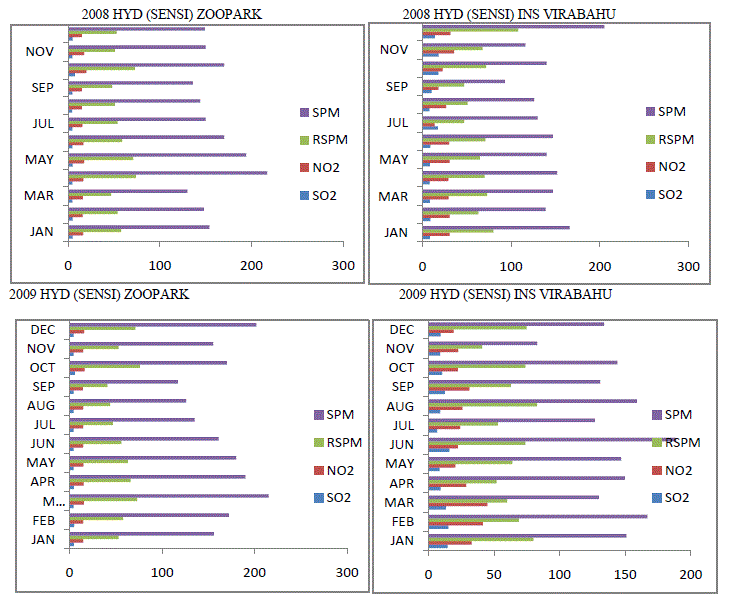
| The histograms show the coastal industrial area and urban areas from the time period is 2006 – 2009. The left panel indicates the pollutants concentration over urban industrial area (Hyderabad), while the right panel indicates the concentration of pollutants over the coastal industrial area (Visakhapatnam). The concentration of TSPM (Total Suspended Particulate Matter) is high in both urban and coastal industrial areas when compared with other parameters in 2006. In residential area the concentration considered over Visakhapatnam higher than the Hyderabad residential area especially in the months of June, September and October highly situated. Over Visakhapatnam in the month of July and August the pollution concentration decrease it may washout by rain during monsoon season. |
| Visakhapatnam in the months of September and October concentration increased may break condition of monsoon. The high concentrated pollution over Visakhapatnam observed than the Hyderabad the observing areas are ABIDS Circle in Hyderabad while Gnanapuram in Visakhapatnam in the year of 2006. In the sensitive area of Visakhapatnam (INS VEERABAHU) there are no prominent changes all these months in 2006. While in the same year Hyderabad also situated and the concentration of TSPM gradually decreases from February to August. But in the Hyderabad there are more changes from January to December. In the months of January, February and March the concentration is higher than the Visakhapatnam. There is a small variation between Hyderabad and Visakhapatnam in the year of 2007. The pollution concentration over the sensitive area of Visakhapatnam (INS Veerabahu) is greater than the Hyderabad (Zoo Park) in the year of 2007. In the year of 2008 the annual concentration over Hyderabad is higher than the Visakhapatnam. In the residential area the no. of changes observed between Hyderabad and Visakhapatnam. In Hyderabad area (Charminar) the pollution concentration is same over all the months but in Visakhapatnam concentration is high from January to July. After that gradually decrease from August- December it may rainfall activity. In the year of 2008 the pollution concentration is higher than the Visakhapatnam. In the Sensitive areas the annual concentration over Hyderabad is greater than Visakhapatnam. In the year of 2009 the pollution concentration over Visakhapatnam and Hyderabad almost same up to December mainly observed small decreasing in both stations with same concentrations. In the year of 2009 residential areas concentration almost same in all stations over the Visakhapatnam. While the Hyderabad also has same situation and annual concentration approximately near between Hyderabad and Visakhapatnam. In the sensitive areas pollution concentration is nearly equal in both stations of Zoo Park (HYD) and INS Veerabahu (Visakhapatnam). But annual concentration is little greater over Visakhapatnam than Hyderabad. But in the Hyderabad consider the small decreasing order from January to September and again increase. |
IV. CONCLUSIONS |
| Overall study points out that May, September and October months recorded high pollution potential over Visakhapatnam when compared to Hyderabad. The concentration over the Visakhapatnam gradually decreases but in the months of April, May, due to high concentration of temperature there is a small increased observed over Visakhapatnam. ). The concentration of TSPM (Total Suspended Particulate Matter) is high in both urban and coastal industrial areas when compared with other parameters. While the concentration of other pollutants which are RSPM, SPM, So2 and No2 are high concentrated in the industrial area of coastal city of Visakhapatnam (Industrial Area) in 2006 than the industrial city of Hyderabad (CITD Balanagar). Because of the humidity condition in the atmosphere is may high over Visakhapatnam than the Hyderabad and also during the monsoon time period (June - September) the concentration high in Visakhapatnam than Hyderabad. Because of sea breeze also one of the reason. The temperature increase over the areas of CITD Balanagar. In the year of 2007 over residential areas concentration decrease gradually up to June. After that in the post monsoon period again increase up to December while in the Visakhapatnam also increases mainly over the Gnanapuram area. |
Relative comparison of air pollution over Urban and Coastal Industrial Area in μg/m3 (Industrial Areas) |
 |
 |
 |
 |
 |
 |