ISSN ONLINE(2319-8753)PRINT(2347-6710)
ISSN ONLINE(2319-8753)PRINT(2347-6710)
K. SaiLakshmi, V.LakshmanaRao
|
| Related article at Pubmed, Scholar Google |
Visit for more related articles at International Journal of Innovative Research in Science, Engineering and Technology
The air pollution is most predominant present situation. This case study mainly states that the concentration of air pollutants over coastal and urban areas by using histograms. In this article the important parameters are SO2, NO2, RSPM and TSPM in μg/m3 from the period of 2009 to 2013.The concentration of TSPM (Total Suspended Particulate Matter) in both stations is high when compared with other parameters. The aim of this case study is consider the pollution concentration over coastal industrial area (Visakhapatnam) and urban metropolitan city of Vijayawada especially in Industrial and residential areas. In the month of January the pollution concentration is present high in Visakhapatnam than the Vijayawada. But in the year of 2009 the annual pollution concentration is higher in Vijayawada when compared with Visakhapatnam area. In the year of 2010 the pollution concentration is greater in Vijayawada from January to December. Over Visakhapatnam city the pollution concentration is higher in the months of April and May when compared with Vijayawada station. But in the monsoon (June to September) season the concentrations are less than Vijayawada. But in the post monsoon period over the Vijayawada high concentration is present than Visakhapatnam in the year of 2011.In Vijayawada city in the year of 2012 annual concentration is greater than Visakhapatnam over the industrial areas. While in the year 2013 also presents same condition.
Keywords |
| Pollutants, Industrial area and Urban area, monsoon and metropolitan area. |
INTRODUCTION |
| According to Seinfeld (1986), Air pollution may be defined as any atmospheric condition in which substances are present at concentrations high enough above their normal ambient levels to produce a measurable effect on man, animals, vegetation or materials. By ‘substances’ we mean any natural or manmade chemical elements or compounds capable of being airborne. These substances may exist in the atmosphere as gases, liquid drops or solid particles. Our definition includes any substance, whether noxious or benign; however, in using the term ‘measurable effect’ we will generally restrict our attention to these substances that cause undesirable effects. According to Altshuller, A.P and Bufalini, JJ (1965), Materials that are emitted in the atmosphere are subjected to a number of interesting and unusual reactions. These reactions lead too many products whose deleterious effects have now been recognized as one of the most pressing problems in urban areas throughout the world. These effects can be observed in reduced visibility eye irritation, plant damage, cracking of rubber and corrosion of metals. Many of the problems confronting chemists participating in the study of the photochemical aspects of air pollution have been roughly reviewed by Leighton (43). |
| Mainly the actions of the people are the primary cause of pollution increases, the attendant pollution problems also increase proportionately. The first significant change in man’s impacts on nature came with the discovery of fire. Prehistoric man built a fire in his cave for cooking, heating and to provide light. The problem of air pollution came into existence at that time. Since then man is making rapid strides of progress in science and technology in utilizing the natural resources for better comforts. His eagerness to increase comforts l e a d s to rapid industrialization a n d urbanization. The adverse effects of increase in industrialization and urbanization are obsolescence of the infrastructure, the pollution of the city atmosphere, the lack and bad quality of drinking water, overcrowding and traffic difficulties, the decreases in areas of greenery etc. |
| Man uses the atmosphere not only as a resource but also a place for dumping wastes. He takes from it oxygen, a necessary ingredient for his own survival and return to it a mixture of gases and solids, the byproducts of combustion, respiration and other energy transferring activities thus tampering the ecosystem. Increased urbanization and industrialization leads to increase in the concentration of conventional pollutants are emitted as a result of burning of fossil fuels like coal, petrol, natural gas, diesel oil etc. The adverse effects of air pollutants are now well documented. The atmosphere is having tremendous capacity to dilute and disperse air pollutants. The winds carry them, the turbulence mixes well them, the heat energy transforms them, the precipitation washes them down but yet there is a limit to this dilution. In urban centers, when the emissions are more, the concentrations built up (in spite of dilution) and ask for concerted efforts to control air pollution. |
| While estimating the air pollutants in coastal stations, the local mesoscale circulation circulations like sea and land breezes are too estimated. The air pollutants are subjected to local wind circulations like sea breeze, which promote the flushing action of the pollutants. So while considering air pollution aspects of coastal stations, a scientific study. |
| The sampling locations are chosen here in the coastal Industrial area of Visakhapatnam (17°42'N; 82°18'E) h i g h l y industrialized coastal metropolitan city on the East coast of India and Vijayawada city. Especially the study areas are mainly industrial and residential areas in both cities. This Indian Coastal city is suppose to be one of the rapidly cities in the world. Here in this study we taken major air pollutants are TSPM (Total suspended particulate matter), RSPM (Respirable suspended particulate matter), So2 and No2. From the years of 2011 to 2013. In the sampling location we have collected the meteorological parameters also. Here in this case we are comparing the all pollutants. Vijayawada is a commercial city and historical city situated at the geographical centre of the AP state in India. It is situated on the banks of river Krishna. (Latitude 160 03’ 11’’ N and longitude 80o 03’91’’E) the climate is tropical with hot summers and moderate winters. The city is peculiar in its own geographical setting. The city is surrounded by hills on all sides with Indrakiladri Hills range on the west where the famous shine of the Kanaka Durga is situated on the east side there is Mogalrajpuram hill range with a famous temple of the holy mother mary. At present Vijayawada is having all the bad situations of typical urban centre. The canals in the summer will have nothing but drainage affecting the health of the surrounding population in the neighborhood. |
DATA AND METHODOLOGY |
| Sources of Air pollution in Vijayawada City |
| Industries: there are major and minor industries in and around Vijayawada one of the major industry is the Vijayawada Thermal Power Station (VTPS) located at Ibhrahimpatnam on the west side of Vijayawada. There are two industrial estates around the city, Autonagar industrial estate located on the eastern part of the city covering 340 Acres. The other industrial estate is at Kondapalli on the western side of the city extending over an area of 439 Acres. As for as the meteorological wind directions are concerned the population arising from Kondapalli moves away from the city during the south west monsoon season however Autonagar pollution spreads to the city interior so the location of the Kondapalli industrial area is better compared to Autonagar. |
| Traffic Pollution: Vijayawada is well connected to the rest of the country by national highways NH-5, NH-9 and NH-221. There are a number of heavy trucks, busses, lories, cars, three wheeler autos as well as scooters playing on this national highways besides the floating pollution all major streets within the city are connected with local public transport as well as individual transports like car and scooters the three wheeler autos are the major sources of transportation for middle class population. All these contribute to traffic air pollution in the city. In the present article we observed the pollution levels at two places. |
| 1. Benz Circle which is predominantly traffic polluted and |
| 2. Autonagar which is predominantly industrial pollution area. |
| The pollution levels at this two sampling points where presented for the years 2011, 2012 and 2013. |
| Sources of Air pollution in Visakhapatnam City |
| The sampling locations are chosen here in the coastal Industrial area of Visakhapatnam (17°42'N; 82°18'E) h i g h l y industrialized coastal metropolitan city on the East coast of India. Especially the study areas are mainly industrial and residential areas. This Indian Coastal city is suppose to be one of the rapidly cities in the world. Located on the East coast of India, in 17o42' North latitude and 82o02' East range of hills. Based on topographical conditions, the city and its environs can be divided into four categories viz. Hilly region, Upland tracks, Rolling plains and Plains. The major hill ranges of the city are Kailasa and Yarada hill ranges. The Kailasa hill range stretches from Simhachalam to MVP Colony on the north flank of the city. The city which appears like a small basin is surrounded by the Yarada hill popularly known as Dolphin’s nose (358m) on the side of the Kailasgiri hills on the north, with the Bay of Bengal forming the eastern wall. The coastal line runs from north east to south west over a distance of six kilometres. On the west there is an extensive tidal basin called Upputeru now under reclamation. Beyond Yarada there is a valley followed by another range of hills. The climate of Visakhapatnam has no appearcial season changes. Being close to the sea the level of humidity is high. The fluctuations in temperature is fairly is uniform in character, except during the dry months when the rise in temperature is higher than it is during the monsoon period. |
RESULTS AND DISCUSSIONS |
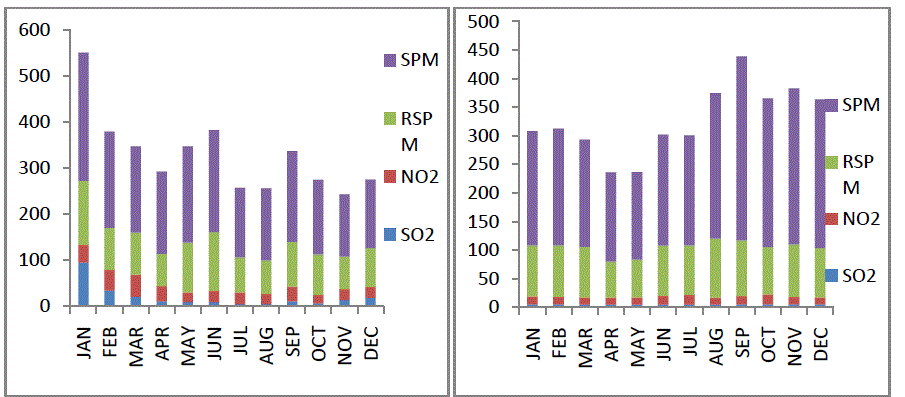
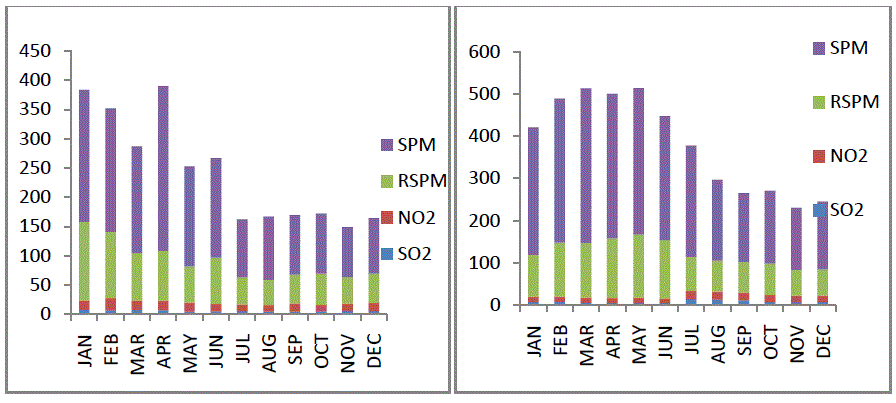
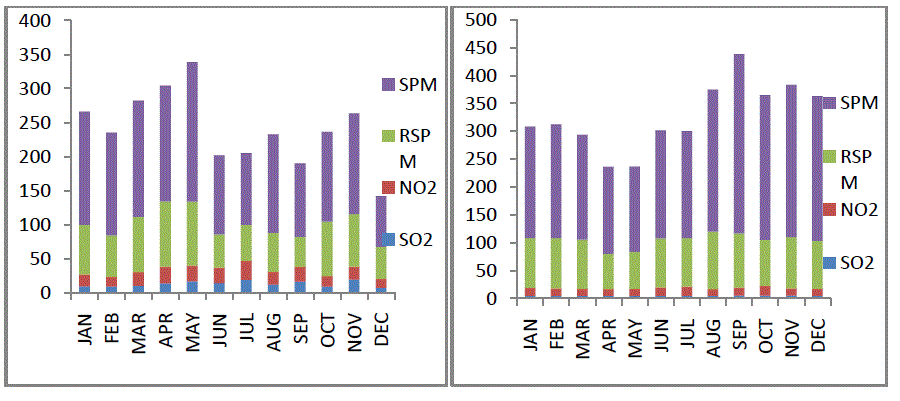
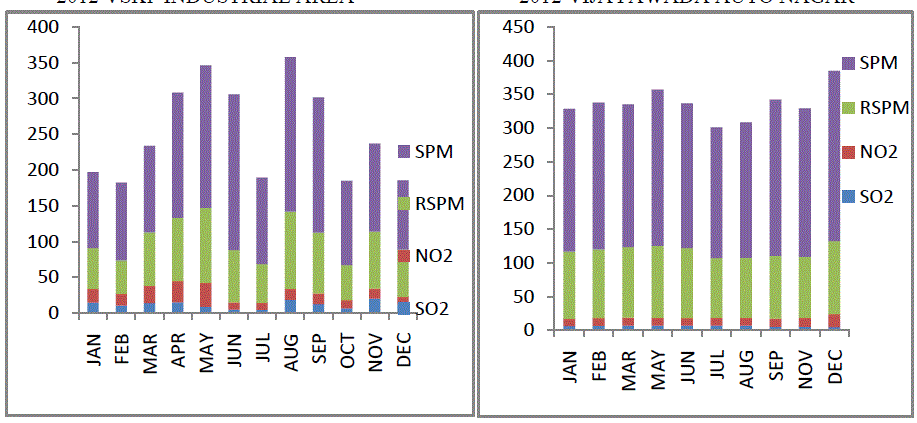
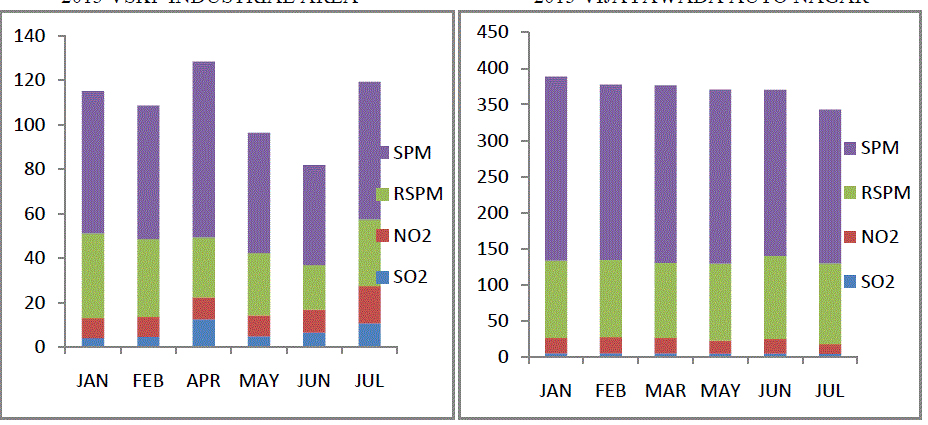
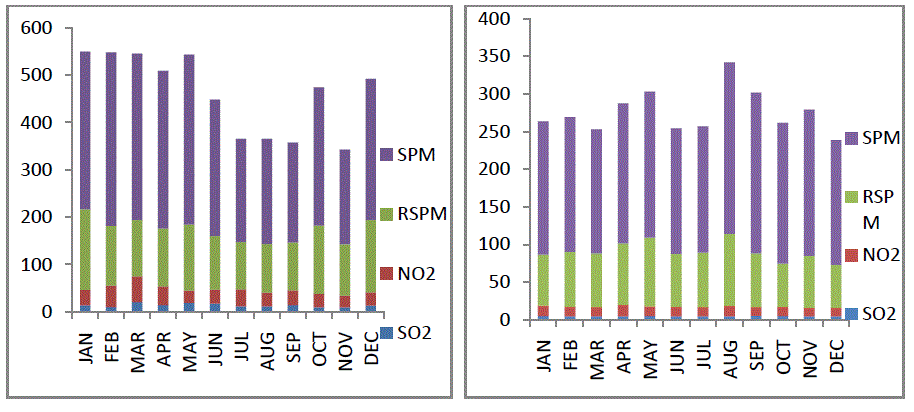
| Histograms are shows the concentrations of air pollutant over the cities are of coastal city of Visakhapatnam and urban area of Vijayawada in the years of from 2009- 2013for different areas. Selected stations are Industrial area (Autonagar) in Vijayawada and Industrial estate in Visakhapatnam While residential area Benz circle in Vijayawada and Gnanapuram in Visakhapatnam. Observed parameters are in this study So2, No2, RSPM and SPM. The left panel indicates pollution concentration in Visakhapatnam city and right panel indicates concentration in Vijayawada. In the month of January the pollution concentration is present high in the Visakhapatnam than the Vijayawada. But in the year of 2009 the annual pollution concentration is higher in Vijayawada when compared with Visakhapatnam area. In the year of 2010 the pollution concentration is greater in Vijayawada from January to December. Over Visakhapatnam city the pollution concentration is higher in the months of April and May when compared with Vijayawada station. But in the monsoon (June to September) period concentration is lesser than Vijayawada. In the post monsoon period over the Vijayawada high concentration is present than Visakhapatnam in the year of 2011.In Vijayawada city in the year of 2012 annual concentration is greater than Visakhapatnam over the industrial areas. While in the year 2013 also presents same condition. In this study we considered the overall pollution concentration is greater in Vijayawada when compared with Visakhapatnam from the time period is 2009 to 2013. |
SUMMARY AND CONCLUSSIONS |
| Overall study points out that March, April and May pollution concentration is greater over Visakhapatnam than Vijayawada. It may be due to the humid condition in the pre monsoon period and sea breeze also one of the supported condition for increasing pollution concentration. While in the months of September, October, November and December the concentration is greater in Vijayawada city compared to Visakhapatnam. It may due to thermal condition and industrial effect. The concentration of SPM is greater in both stations when compared with other parameters in all seasons. In this study we considered the overall pollution concentration is greater in Vijayawada when compared with Visakhapatnam from the time period is 2009 to 2013. The Concentrations are observed for three consecutive years namely 2009, 2010, 2011, 2012 and 2013. In the present article the air pollution concentrations of conventional pollutants like SO2, NO2, RSPM and TSPM have observed at two stations of two cities, those are Vijayawada( Autonagar and Benz circle) and Visakhapatnam (Residential area and Gnanapuram) also Industrial and residential areas. |
| RELATIVE COMPARISION OF AIR POLLUTION CONCENTRATION IN (μg/m3) OVER VISAKHAPATNAM & VIJAYAWADA (INDUSTRIAL AREAS) |
 |
 |
 |
| RELATIVE COMPARISION OF AIR POLLUTION CONCENTRATION IN μg/m3 OVER VISAKHAPATNAM & VIJAYAWADA (RESIDENTIAL AREAS) |
 |
 |
 |
References |
|