International Journal of Innovative Research in Science, Engineering and Technology
ISSN ONLINE(2319-8753)PRINT(2347-6710)
ISSN ONLINE(2319-8753)PRINT(2347-6710)
Kamath1, Lokeshappa2
|
| Related article at Pubmed, Scholar Google |
Visit for more related articles at International Journal of Innovative Research in Science, Engineering and Technology
The present investigation was carried out to significant of air pollutant concentrations at Residential, Industrial &Sensitive Areas Bangalore. Sulphur dioxide (SO2), oxides of nitrogen (NOX) and R.S.P.M were collected over six sites in Bangalore. First sampling station location at Victoria Hospital, second sampling station location at Graphite Industrial Area, and third sampling station location at Amco Apartments, fourth sampling station location at Peenya Industrial Area, fifth sampling station location at Yeshwantapur Residential Area and sixth sampling station location at K.H.B Industrial Area. All the sampling stations selected are located in Residential, Industrial and Sensitive areas. Meteorological parameters like Temperature, Relative humidity, Wind speed, Wind direction & Rain fall data were also recorded simultaneously during the sampling period. Monthly and seasonal variation of these pollutions have been observed and recorded. The annual average and range values have also been calculated. It has been observed that the concentrations of the pollutants are high in summer in comparison to the Pre monsoon and post monsoon seasons. In the present study, it was noticed that the R.S.P.M levels at all selected sites exceeds the prescribed limits as stipulated by Central Pollution Control Board (CPCB) New Delhi. A part from this the SO2 and NOX levels in industrial areas remain under prescribed limits of CPCB.
Keywords |
| Air Quality Index, Pollutants, Air Quality Criteria, Index calculation. |
I. INTRODUCTION |
| Air pollution is a serious worldwide public health problem. The short-term health impacts of air pollution have been studied extensively since the London fog in the mid-20th century and the subsequent series of dramatic episodes in industrialized countries. However, the magnitude of effect estimates varies across cities and countries, hindering interpretation and generalization of the causal association between air pollution and health. Some investigators have attempted to explain the heterogeneity of effects estimates among regions in terms of different levels of air pollutant, specific city characteristics and potential confounders including temperature and humidity. After decades of industrialization, air pollution has become a major environmental issue for both developed and developing countries. Poor air quality has both acute and chronic effects on human health (Sadhana et al. 2013). |
| About 60 per cent of air pollution in Indian cities is due to automobile exhaust emission. The vehicular emission contains more than 450 different organic chemical compounds either in gaseous or in particulate or in the combined forms. The emission loads in Indian urban cities are in the range of thousands of tons per day. The gains achieved through reduced standalone vehicle emissions are offset by the rapid rise in volume of vehicles. Internal combustion engines, the prime movers for automobiles emit carbon monoxide, hydrocarbons, oxides of nitrogen, lead, road and tire dust, carbon particles, and aldehydes. Some of these compounds react in sunlight to produce secondary, genotoxic, cytotoxic, fibro genic, and carcinogenic compounds like benzene, the class A human carcinogen (sadhana et ai. 2013). |
| The present-day atmosphere is quite different from the natural atmosphere that existed before the Industrial Revolution in terms of chemical composition. If the natural atmosphere is considered to be “clean”, then this means that clean air cannot be found anywhere in today‟s atmosphere. The chemical composition of the pre-industrial (i.e., before the 18th century), natural global atmosphere is compared to current composition (Aaron et al. 2011). |
| Defining “air pollution” is not simple. One could claim that air pollution started when humans began burning fuels. In other words, all man-made (anthropogenic) emissions into the air can be called air pollution, because they alter the chemical composition of the natural atmosphere. The increase in the global concentrations of greenhouse gases CO2, CH4, and NO2 (shown in Table 1), can be called air pollution using this approach, even though the concentrations have not found to be toxic for humans and the ecosystem. One can refine this approach and only consider anthropogenic emissions of harmful chemicals as air pollution. (Aaron et al. 2011). |
.II. MATERIALS AND METHODOLOGY |
| 2.1 Study Area |
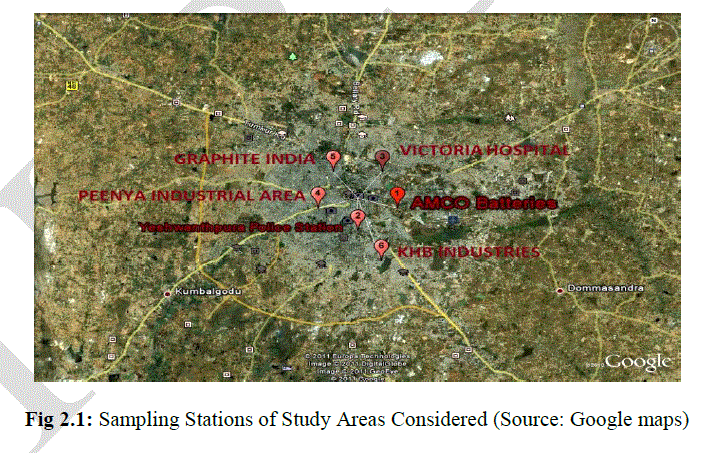
| To establish AQI of urban Area, for present study, Bangalore city, capital of Karnataka was selected. Bangalore, the 5th Metro of India, occupies important position not only in the state but also in the country. The Bangalore City Corporation limits are enclosed within 12º58' north and 77º35' east longitude at an average elevation of about 900 meters and situated at a height of over 3000 feet above sea level. It is considered as one of the major Industrial, commercial and educational center in southern India and also as Information Technology and Bio Technology center. Urbanization in India is more rapid around national capital and state headquarters. The city has taken dubious distinction of being the fastest growing metropolis in the country. The polarized development has significant impact on culture, economy and growth of not only surrounding areas but also on the city itself. Fig 3.1 shows the sampling stations of study pockets considered. |
 |
| 2.2 Selection of Sampling Stations |
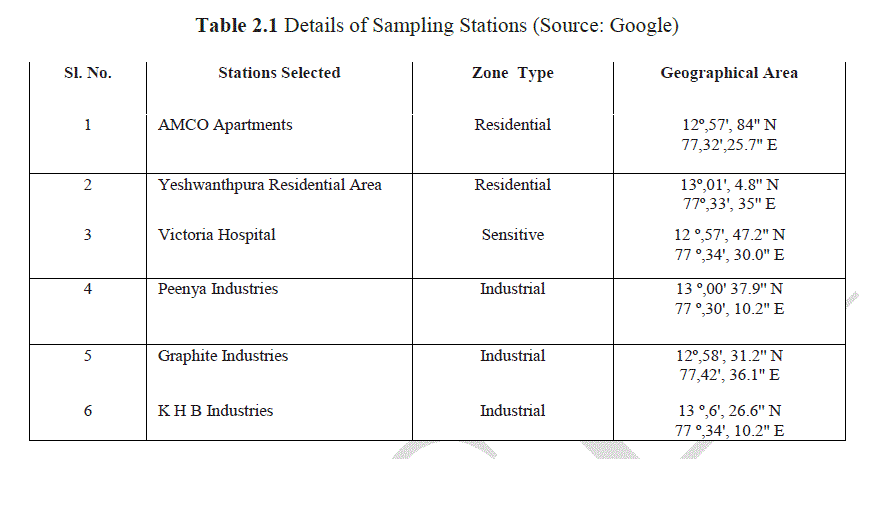
| Six sampling stations were selected for establishing AQI. Out of these six sampling stations- two were residential, one was sensitive area (hospital) and three were industrial Areas. The Table 3.1 shows the details of sampling stations selected for study. |
 |
| 2.3 Parameters Considered and Duration |
| The parameters affecting air quality varies widely. However, by keeping in mind the industrial activities in the study area and vehicular movement, four air quality parameters viz., SO2, NOx & RSPM were selected for establishing AQI. AQI data of selected sampling stations were collected for 5 years period viz., 2008-09, 2009-10, 2010-11, 2011-12 and 2012-13. The data was collected from Karnataka State Pollution Control Board (KSPCB) Bangalore. |
| 2.4 Methods Adopted for AQI Calculation |
| AQI can represent the overall air quality status in a better way since the cumulative effect of all the pollutants and the related standard can be taken into account. As a result an equation, which transforms the parameter, values by means of numerical manipulation into a more simple and precise form can be obtained. The index of specific pollutant is derived mainly from the physical measurement of pollutants like SPM, RSPM, SO2 and NOx . There are several methods and equations used for determining the AQI. In the present study AQI for each location in the study area has been estimated with the help of a mathematical equation given below. |
| AQI=1/3[{SO2/SSO2} + {NOX/SNOX} +{RSPM/SRSPM}}]*100 |
| Where, |
| SO2 = Individual Values of sulphur dioxide |
| NOX = Individual values of oxides of nitrogen |
| RSPM= Individual values of Respirable suspended particulate matter and |
| SSO2, SNO2 and, SRSPM = Standards of ambient air quality of sulphur dioxide, oxides of nitrogen, Respirable suspended particulate matter. |
 |
| 2.5 Air Quality Index |
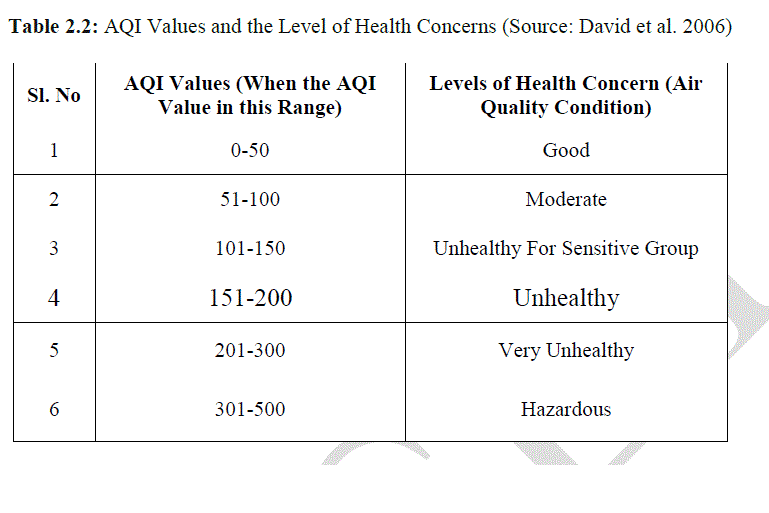
| The Air Quality Index (AQI) (also known as the Air Pollution Index (API) or Pollutant Standard Index (PSI) is a number used by government agencies to characterize the quality of the air at a given location. As the AQI increases, an increasingly large percentage of the population is likely to experience increasingly severe adverse health effects. To compute the AQI requires an air pollutant concentration from a monitor or model. The function used to convert from air pollutant concentration to AQI varies by pollutant, and is different in different countries. Air quality index values are divided into ranges, and each range is assigned a descriptor and a color code. Standardized public health advisories are associated with each AQI range. An agency might also encourage members of the public to take public transportation or work from home when AQI levels are high.(Srinivas et al. 2013) |
| 2.5.1 Definition |
| An „Air Pollution Index‟ can be defined as a scheme that transforms the (weighed) values of individual air pollution related parameters (for examples Sulphur dioxide concentration or Resipirable suspended particulate matter) into single number or set of numbers. As a result, we get an equation which transforms the parameter values by means of a numerical manipulation- into a more simple and precise form. However, it should be noted that the complexity of the problem of air pollution makes it difficult, if not impossible, to develop an index that is really meaningful |
| Data collected to meet the objectives of the study and the results obtained with regard to the random/sample air quality monitoring of the selected pocket are documented in this chapter. The data and results are presented in Tables and are also presented by graphs for convenient of analysis. Based on the data and results documented discussions were made, inferences were drawn. Further, the AQI for different areas, for different study pockets established and comments there-of are also presented in this chapter. |
 |
IV. CONCLUSION |
| To meet the objectives of this present proposed study, air quality data of different Areas of Bangalore city were collected and also to assess the air quality at these pockets for the year 2014, the monitoring was also carried out. The results are represented in tables and graphs. Based on the data and results obtained discussions were made and inferences were drawn. Finally following conclusions have been drawn. |
| In general, increasing / decreasing / defined trends in the concentration of parameters studied from year to year has not been observed and this trend is attributed to meteorological conditions which might have resulted in dispersion/diffusion. |
| At all the Areas studied SO2 concentration in the ambient air was found to be within the permissible limit. Similarly NO2 concentration in the ambient air not exceeding the permeable limit was observed at all the pockets except at Victoria Hospital. |
| RSPM concentration exceeding 4.5 times than acceptable limit was observed in the ambient air at Yeshwanthpur Residential Area during 2014 ( RSPM - 274μg/m3) |
| Air quality at Victoria Hospital which is very sensitive area is found to be much deteriorated in terms of NO2, SPM and RSPM concentrations. Thus it is concluded that situation is alarming and unwarranted. |
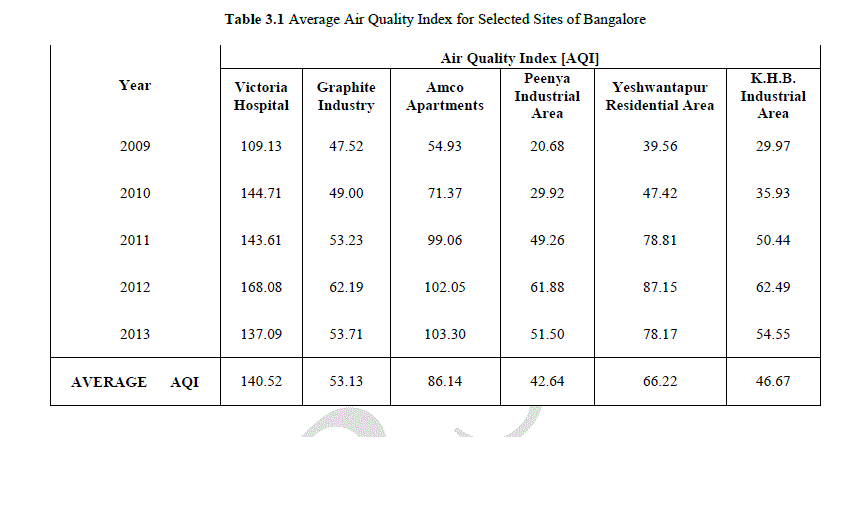
| The results revealed that the air quality at Yeshwanthpur Residential Area, Victoria Hospital (Sensitive Area) in terms of RSPM concentrations is deteriorated and these concentrations exceeded the permissible limit. Further based on the average AQI of different Areas studied, it was concluded that sensitive area viz., Victoria Hospital has unhealthy air quality followed by Yeshwanthpura Residential Area unhealthy for sensitive group. Moderate air quality condition was detected at industrial area namely near Graphite India Ltd., and at AMCO Residential Area. |
| AQI established for the month of April for Victoria Hospital (187.88) indicated the hazardous level of health concern. Even the Yewshwanthpura Area exhibited very unhealthy level of health concern (191.50). Thus the AQI values warn that there is a urgent need to take steps to mitigate the deterioration of air quality. |
References |
|