ISSN ONLINE(2319-8753)PRINT(2347-6710)
ISSN ONLINE(2319-8753)PRINT(2347-6710)
Nischitha.K1, Mahendra Rajan.V 2 , Ramesha K3
|
| Related article at Pubmed, Scholar Google |
Visit for more related articles at International Journal of Innovative Research in Science, Engineering and Technology
The goal of image deblurring is to restore an image within a given area, from a blurred specimen. It is well know that the convolution operator integrates not only the image in the field of view of the given specimen, but also the part of the scenery in the area bordering it. The given results demonstrate the importance of accurate phase recovery, where even a relatively small phase error can have a dramatic effect on the quality of image deconvolution. Under such conditions, the proposed method produces image reconstructions of a superior quality, as compared with the case of Classical Compressed Sensing . Moreover, comparing the results one can see that DS only slightly outperforms Derivative Compressed Sensing in terms of Peak Signal to Noise Ratio and Image estimate obtained with the CCSbased method for phase recovery Structural Similarity Index Measurment .
Keywords |
| Deconvolution, derivative compressive sampling , inverse problem, Shack–Hartmann interferometer (SHI). |
INTRODUCTION |
| Images, in particular digital images will be procured to evaluate object through image(s). While obtaining the Image say digital image, the clarity of the image may not be satisfactory. 0ne of the reason is blurring. Various researches has proved that image noise is a major reason for blurring in a image(s). hence removal of blurring caused by noise becomes a necessity. Deblurring in an image will arise in all kinds of astronomical scientific, medical, industrial, consumer images of the various techniques adopted, reconstruction of the original image is one of the solution for the above said problems. Image restoration as been attempted by various researches by removing image noise/ minimizing image noise. For a successful reconstruction of digital image blurred by noise, one as to ascertain the nature and kind of noise causing blurring in the image is necessary. Thereafter the scope of the damage caused by image noise is measured. Further we have to predict the original counter part of the blurred image by using Point Spread Function (PSF). The next process includes the normalization of the given image followed by reconstruction of the original counter part by applying deconvolution process which is an simple inversion of the given image followed by reconstruction based on the available relevant information. However before deconvolution the noisy status of the image will be normalized by adding additional noise. The deconvolution process in briefly is of two types namely, Blind deconvolution and the hybrid deconvolution : blind deconvolution method by adopting Shack-Hartmann Interferometer (SHI). Whereas hybrid deconvolution method includes process through Derivative Compressed Sensing (DCS) algorithm. In the hybrid technique we are adopting the prevailing SHI method to acquire discrete noisy measurement the said output of SHI is compressed by adopting DCS algorithm. while performing deconvolution process variation in lenslets is performed SHI stage) for linear measurement we are adopting iteration method, and for calculation of mean value we are applying error propagation method as mathematical tool. For measurements of intensity variation we are using Fourier transformer. The result of the unified process is applied for image reconstruction. The entire process of deconvolution as represented by simple algorithm is presented in this paper as stated here under. |
A. Problem Statement |
| While capturing images, we may not get satisfactory quality images due to blurring caused by variation in illumination and / or camera condition and/ or movement. For the said blurred image we have to extract information regarding the nature and kind of original image and thereafter by minimizing the image noise followed by image reconstruction using the information extracted from the blurred image. The entire process of reading the blurred image and collecting information regarding the exact properties of the original image, ending in reconstruction and restoration of original image is briefly designated as deconvolution process. The efficient, speedy, economical and accurate algorithm for deconvolution process of a blurred image is the challenging task before the researchers. Various attempts of the researches in this regard ended in finding two classic methods of deconvolution identified as blind deconvolution or SHI process and DCS method (derivative compressed sensing). But both this methods failed to solve the problem stated above. Hence a unified technique of adopting shack- Hartmann interferometer method through DCS method is suggest as an unique an stale method for solving the problem of reconstruction of deblurred images is suggested by us. |
LITERATURE SURVEY |
| J. Yang et al., [3] presented a new approach to single-image super resolution, based upon sparse signal representation. Research on image statistics suggests that image patches can be well-represented as a sparse linear combination of elements from an appropriately chosen over-complete dictionary. Inspired by this observation, we seek a sparse representation for each patch of the low-resolution input, and then use the coefficients of this representation to generate the high-resolution output. Theoretical results from compressed sensing suggest that under mild conditions, the sparse representation can be correctly recovered from the down sampled signals. J. A. Cadzow et al., [4] proposed Classical deconvolution is concerned with the task of recovering an excitation signal, given the response of a known time-invariant linear operator to that excitation. Deconvolution is discussed along with its more challenging counterpart, blind deconvolution, where no knowledge of the linear operator is assumed. This discussion focuses on a class of deconvolution algorithms based on higher-order statistics, and more particularly, cumulants. These algorithms offer the potential of superior performance in both the noise free and noisy data cases relative to that achieved by other deconvolution techniques. This article provides a tutorial description as well as presenting new results on many of the fundamental higher-order concepts used in deconvolution, with the emphasis on maximizing the deconvolved signal's normalized cumulant. S. Geman and D. Geman et at., [8] presented an analogy between images and statistical mechanics systems. Pixel gray levels and the presence and orientation of edges are viewed as states of atoms or molecules in a lattice-like physical system. The assignment of an energy function in the physical system determines its Gibbs distribution. Because of the Gibbs distribution, Markov random field equivalence, this assignment also determines an MRF image model. The energy function is a more convenient and natural mechanism for embodying picture attributes than are the local characteristics of the MRF.. |
BLOCK DIAGRAM |
| Pre-Processing: |
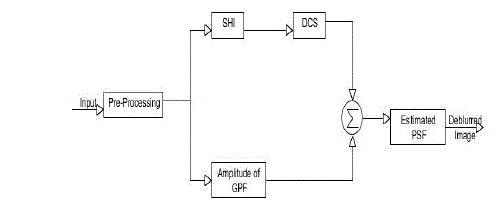
| In this paper we are going to take an blurred image has input image to the pre-processing unit. In this process exposed optical image is measured through atmospheric turbulence. In tracking process, variations in optical wavelength are randomly measured and at the same time amplitude and phase are evaluated independently. |
 |
| Shack Hartmann Interferometer (SHI): |
| This an optical system dedicated to metrological control of optical parts, by measuring and computing the input wavefront. Nowadays, this method is used in the field of adaptive optics to measure in real time the wavefront distortions induced by the seeing (turbulence). Compared to the Hartmann method, this is a much more accurate method. Moreover, it can use fainter stars, because the Shack-Hartmann system uses the whole pupil, which is not the case using the Hartmann test, where the amount of holes is limited to some along one axis. A light wavefront may be defined as the virtual surface defined by the point on all possible rays having equal optical path length from a spatially coherent source. The wavefront of light emanating from a point light source is a sphere. The wavefront created by an ideal collimating lens mounted at its focal length from a point source is a plane. A wavefront sensor may be used to test the quality of a transmissive optics system, such as a collimating lens, by detecting the wavefront emerging from the system and comparing it to some expected ideal wavefront. Such ideal wavefronts may be planar, spherical, or have some arbitrary shape dictated by other elements of the optical system. The optical system might be a single component or may be very complex. A Shack-Hartmann Wavefront Sensor is a device that uses the fact that light travels in a straight line to measure the wavefront of light. |
 |
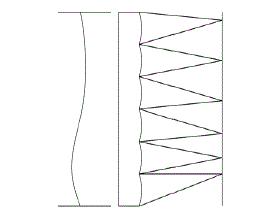
| The device consists of a lenslet array that breaks an incoming beam into multiple focal spots falling on a optical detector as illustrated in Fig .2. By sensing the position of the focal spots the propagation vector of the sampled light can be calculated for each lenslet. The wavefront can be reconstructed from these vectors. Shack-Hartmann sensors have a finite dynamic range determined by the need to associate a specific focal spot to the lenslet it represents. A typical methodology for accomplishing this is to divide the detector surface into regions (Areas-of-Interest or AOI’s) where the focal spot for a given lenslet is expected to fall. If the wavefront is sufficiently aberrated to cause the focal spot to fall outside This region or not be formed at all, the wavefront is said to be out of the dynamic range of the sensor. In practice these sensors have a much greater dynamic range than Interferometric Sensors. This range may be tens to hundreds of waves of optical path difference. |
| Estimation of Phase using SHI Method: |
 |
| DCS: Numerous applications are known in which one is provided with the measurements of the gradient of a multidimensional signal, rather than of the signal itself. Central to such applications, therefore, appears the problem of reconstruction of signals from their partial derivatives subject to some a priori constraints. One of such applications, which has been chosen to exemplify the major contribution of this note, is the problem of phase unwrapping. Note that solving this problem is known to be a standard procedure in, e.g., optical and synthetic aperture radar (SAR) interferometer, stereo vision, blind deconvolution, etc. In this paper we are taking the Derivative compressed Sensing algorithm to get the deblurred output by using SHI followed by estimated PSF. DCS processing will be done by adopting iteration technique and gradient values are measured linear. In this DCS method we are going to recover an image with respect to phase. Finally PSF estimation is done to get good quality or deblurred image. |
TECHNICAL PREMILARIES |
| In short-exposure imaging, due to phase aberrations in the optical wavefront induced by atmospheric turbulence, the PSF of an imaging system in use is generally unknown. To better understand the setup under consideration, we first note that, in optical imaging, PSF i is |h|2. The ASF, in turn, is defined in terms of a GPF P(x,y)that is given by |
 |
ALGORITHM |
| Shack–Hartmann interferometer provides measurements of the optical wavefront through sensing its partial derivatives. In such a case, the accuracy of wavefront reconstruction is proportional to the number of lenslets used by the interferometer how it measures the phase described by following steps |
| Estimation of Phase |
| Step 1: It predicts the Partial Derivatives ’s of phase with co-rdinates for every iteration of the equation .It predicts the value of gradient phase. |
| Step2: This gradient value can be added with the phase value to get subsequent values for finding this we need the position of pixels x,y. coordinates |
| Step3: This Cartesian coordinates x and y are converted to polar coordinates |
| Step4: By knowing the x and y coordinates we need to find set of all x,y point on the image which forms the geometric centre of the lenslets on the image As we know lenslets are elliptical. |
| Step 5: The focal displacement measured at some (x,y) is belongs set of all spatial co-ordinates is related to value of gradient phase After getting the values we apply that in a objective function of minimization a matrix of discrete values of the partial derivatives of the Zernike polynomials, is a measurement (column) vector of length , and is a vector of the representation coefficients of phase. |
| Estimation PSF Using DCS Method |
| Step 1: Data- take GPF function p(x,y) it is expressed in terms of polar form |
| Step 2:Estimation of A(x,y) via Aperture geometry |
| Step3: This SHI would get Partial Derivatives of the phase (x,y) |
| Step 4: We use DCS it reduces the under sampling i.e the PD’s |
| Step5: Phase recovery: Starting with an arbitrary c(0) and P(0)=0, iterate method until convergence to result in an optimal c*. Use the estimated (full) partial derivatives WTxc* and WTyc* to recover the values of over Ω. |
| Step 6: Compute the inverse Fourier transform of P=Aejø to result in a corresponding ASF h. Estimate the PSF i as i=h2. |
| Step7: Estimate PSF deconvolution with blurred image to obtain good quality of image. |
| Algorithm for Image Deblurring |
| Step 1: We take original image as input image. |
| Step 2 : original image is then convoluted into with PSF. PSF is obtained by Amplitude phase function (APF)determined interms of Generalized pupil function(GPF). |
| Step 3 : Convoluted output is added with additive noise ( to get uniform noise) called dithering |
| Step 4 : In dithering process we get blur and noisy images. |
| Step 5 : The output of noisy image is then de-convoluted with PSF. |
| Step 6 : After de-convoluted we get the de-blurred image. |
RESULTS |
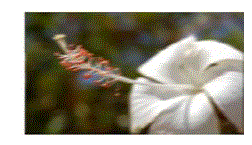
| The proposed algorithm is implemented in MATLAB for computer simulations. GUI environment is created using tool box for loading the input image. The input blurred image as shown in fig 3 below. In fig 4 , shows the restoration of blurred, noisy image using estimated NSR (Convoluted output). In this figure it shows some blur and noises which are presented in the input image, these are estimated by NSR. |
 |
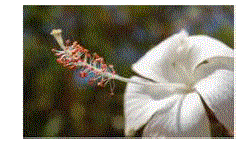
| The image is browsed when pressing the button load image and data can be loaded by pressing the button data image. Once when required input image and data is browsed, then code is executed. Fig.5 shows convolution output image, blurred and noisy version image, finally de-convolution output means good quality of image compare to other methods and PSNR also improved |
 |
| Estimates PSF using DCS algorithm, original image convolution with PSF to get blurred image then adding the additive noise to get blurred with noisy image after de-convoluion with blurred image and estimated PSF to get deblurred image and here calculated PSNR also. |
| The above Table:1 gives the comparison for different images in deblurring process which used in this project. Here, the value of PSF are varied for different images and we are getting PSNR ratio for different images. |
 |
CONCLUSION |
| In this paper, the applicability of DCS to the problem of reconstruction of optical images has been demonstrated. It was shown that, in the presence of atmospheric turbulence, the phase of GPF is a random function, which needs to be measured using AO. To simplify the complexity of the latter, a CS-based approach has been proposed. As opposed to CCS, however, the proposed method performs phase reconstruction subject to an additional constraint, which stems from the property of to be a potential field. The DCS algorithm has been shown to yield phase estimates of substantially better quality as compared with the case of CCS. In this paper, our main focus has been on simplifying the structure of the SHI through reducing the number of its wavefront lenslets while compensating for the effect of under sampling by means of DCS. The solution was computed using the Bergman algorithm, which provides a computationally efficient framework to carry out the constrained phase recovery. Moreover, the resulting phase estimates were used to recover their associated PSF, which was subsequently used for image deconvolution. It was shown that the DCS-based estimation of phase with r=0.3 results in image reconstructions of the quality comparable to that of DS while substantially outperforming the results obtained with CCS. |
References |
|