Research & Reviews: Journal of Medical and Health Sciences
ISSN: 2319-9865
ISSN: 2319-9865
1Department of Biotechnology, St. Joseph’s College (Autonomous), Trichy- 2, Tamil Nadu, India.
2Department of Botany, St. Joseph’s College (Autonomous), Trichy- 2, Tamil Nadu, India.
Received: 29/12/2012 Accepted: 15/02/2013
Visit for more related articles at Research & Reviews: Journal of Medical and Health Sciences
This study deals with feature extraction of Bio Medical signals using the continuous wavelet transform CWT and corresponding coefficients. The signal features are analyzed, in various points of time and at different localization levels with multiple scales of the cwt. The digital data were collected using the electrocardiogram for finding the heart disease considering data sets of twenty different disease cases using mat lab. The ECG data was filtered for hum noise and muscle noise, using a series of filters and applied the zero cross algorithm for finding the no of zero crossings and the heart rate of each disease case.
ECG, wavelet, feature extraction, hum noise.
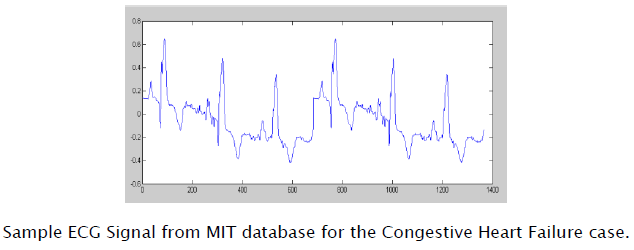
In recent years, ECG signal plays an important role in the primary diagnosis, prognosis and survival analysis of heart diseases. Electrocardiography has a profound influence on the practice of medicine. The ECG signal allows the analysis of anatomic and physiologic aspects of the whole cardiac muscle. Different ECG signals are used to verify the proposed method using MATLAB software.
In fact, beat detection is necessary to determine the heart rate, and several related arrhythmias such as Tachycardia, Bradycardia. The ECG feature extraction system provides fundamental features (amplitudes and intervals) to be used in subsequent automatic analysis. Producing an algorithm for the detection of the P wave, QRS complex and T wave in an ECG is a difficult problem due to the time-varying morphology of the signal subject to physiological conditions and the presence of noise [1,2].
The ECG is a graphic record of the direction and magnitude of the electrical activity that is generated by depolarization and depolarization of the atria and ventricles. One cardiac cycle in an ECG signal consists of the P-QRS-T waves.
A normal ECG signal consists of the P-QRS-T. The QRS part of the ECG signal is useful in estimating the heart rate of the person in most of the cases. The two basic diseases or defects found in the heart function are APC and PVC. APC is Atria Premature Contraction and PVC is Premature Ventricular Contraction. The QRS complex and the R to R interval are used to find the Arrhythmic beats and some famous algorithms are used to detect the QRS complexes using an algorithmic approach. An ECG is the combination of (P wave + QRS complex + T wave) and in general QRS complex is considerably larger than the P wave.
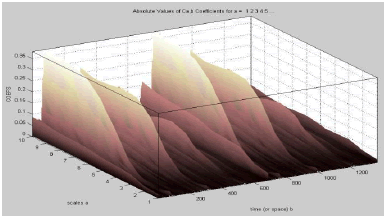
The wavelet transform is an emerging signal processing technique that can be used to represent real-life non stationary signals with high efficiency. By virtue of its multi-resolution representation capability, the wavelet transform has been used effectively in vital applications such as transient signal analysis, numerical analysis, computer vision, and image compression, among many other audiovisual applications.
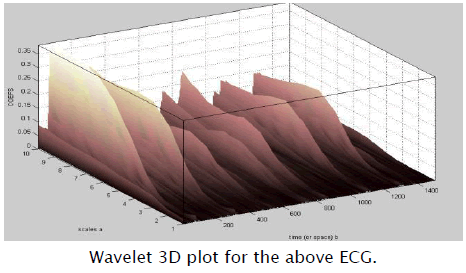
In matlab we use the function “cwt and apply the wavelet using morlet” mother wavelet.
The larger is the wavelet scale the more we can localize in to the signal and more is the computational complexity.
The peak values in the base signal correspond to negative valued wavelet coefficients and vice versa.
The wavelet generated for the initial scales is proportional to the signal taken or the ECG signal
Collection of Bio Medical data.
Collection of Reference data.
Conversion in to digital values.
Applying CWT and gathering the coefficients.
Manual & Algorithmic approach for finding the disease.
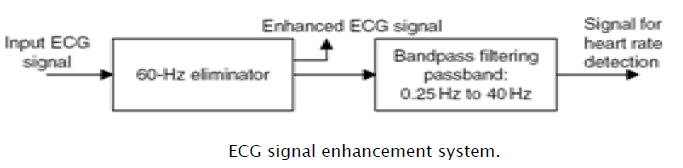
Heart Rate detection using notch filtering and band pass filtering with the use of 60-Hz Hum Eliminator and Heart Rate Detection Using ECG.
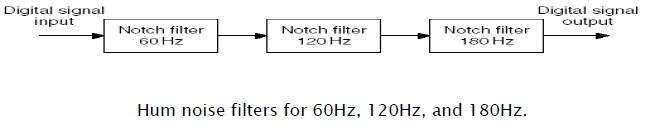
In this report we have explained the implementations on ECG data sets collected at 250Hz sampling rate. Hum noise created by poor power supplies, transformers, or electromagnetic interference sourced by a main power supply is characterized by a frequency of 60 Hz and its harmonics.
If this noise interferes with a desired audio or biomedical signal (e.g., in electrocardiography [ECG]), the desired signal could be corrupted. If such interference is severe the recorded ECG data becomes useless and we apply the signal enhancement to the ECG recording as shown in figure 5.It is sufficient to eliminate the 60-Hz hum frequency with its second and third harmonics in most practical applications. We can complete this by cascading with notch filters having notch frequencies of 60 Hz, 120 Hz, and 180 Hz, respectively.
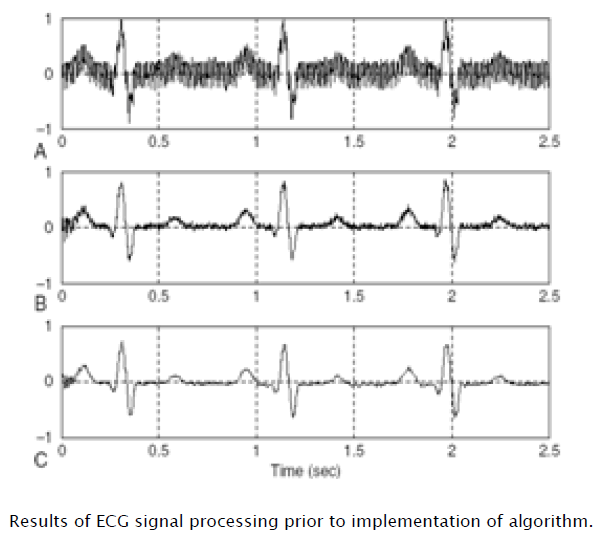
The first figure shows the ECG signal with Hum noise, the second one is the signal removed or filtered from the 60,120,180 Hz hum noise, the third one is the ECG signal filtered from the muscle noise.
Notch filter coefficients were designed using pole zero placement method for 60,120 and 180 Hz components removal. Band pass filter coefficients for removing muscle noise between 0.25Hz to 40Hz is done using bilinear transformation method.
Another cause is magnetic induction in the power line, whereby current in the power line generates a magnetic field around the line.
The ECG data after filtered with 3 stages of notch filters and finally sent through band pass filter is considered for the heart rate calculation using the zero cross algorithm.
The algorithm has some prerequisites to be assigned with, according to the size and sampling frequency of the considered data.
After detecting the total number of zero crossings, the number of the peaks will be half the number of the zero crossings. The heart rate in terms of pulses per minute can be determined by
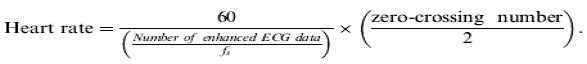
Calculation of heart rate from the no of zero crossings, Where fs = Sampling frequency.
All results are with reference to data sets of different sampling frequency with Zero cross algorithm applied individually.
Heart rate in beats per minute calculated using the zero cross algorithm for various disease cases.
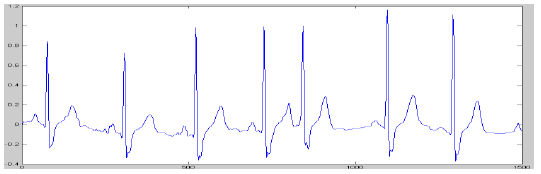
Actual ECG signal
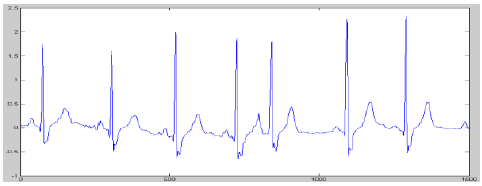
ECG signal filtered for hum noise and muscle noise.
Output of the Algorithm:
1) No of Zero Crossings = 14.
2) Heart Rate in (Beats/Min) = 17.
We conclude that the above implementation helps for the detailed analysis of the biomedical data for finding the diseases and severity.