ISSN ONLINE(2319-8753)PRINT(2347-6710)
ISSN ONLINE(2319-8753)PRINT(2347-6710)
Divya J1, Belagali S.L2
|
| Related article at Pubmed, Scholar Google |
Visit for more related articles at International Journal of Innovative Research in Science, Engineering and Technology
The use of chemical fertilizers to the agricultural farm lands has increased many folds during recent years. In order to study residual impact of the chemical fertilizer as well as nutrients inflow into the water resources has considerably increased water pollution problems. During the present study, seasonal variations of chemical fertilizer residues along and selected water quality parameters have been carried out. From the experimental results, it can be concluded that, a significant variations in urea and DAP residues was observed in all the three seasons. The maximum concentration of chemical fertilizers residues was observed during winter, followed by summer season, which implies, during rainy season urea and DAP residues were carried into nearby water resources, which may persist during winter season. In case of water quality parameters, except, nitrate and phosphate majority of the parameters were found to be within the desirable limits of WHO standards.
Keywords |
| Seasons, Urea, DAP, Nitrate, Seasons. |
INTRODUCTION |
| The use of chemical fertilizers has rapidly increased during recent years, due to the rising demand for food production in the mid 20th century. Currently, urea-based nitrogen fertilizers and phosphate fertilizers are the most commonly used source of nitrogen and phosphorous in agriculture throughout the world. Although there are benefits to urea fertilizers (high nitrogen content, high solubility, and low cost), its rapid decomposition to ammonia and carbon dioxide could lead to environmental and human health problems. Urea, as a nitrogen fertilizer, commonly under goes various processes such as, hydrolysis, volatilization, nitrification and denitrification processes that decide the fate of applied urea [1]. Once urea is applied to soil, it hydrolyses to form NH4 +. Upon nitrification converts NH4 + into NO2 - and in acidic condition the nitrite is transformed into NO3 - [13, 14]. Denitrification removes NO3 - from the soil system as N2 gas [12]. However, N-transformation processes are complicated and dependent on the characteristics of soils. In India, several studies have reported on surface and ground water contamination by nitrate and phosphate due to intensive agriculture practices [1, 2, 3, 6, 10]. Several researchers studied effect of agrochemicals on surface and ground water resources [18, 19].From the literature survey of various research papers, it can be concluded that, excessive application of chemical fertilizers will not increase crop yield but will only increase nitrogen and phosphorous concentration in surface and ground water [12]. During the present investigation, attempts have been made to assess the seasonal variation in the chemical fertilizer residues and physico-chemical characteristics of water samples collected around agricultural area of Nanjangud Taluk. In the study area, extensive work has been carried out on water quality parameters around industrial areas, but, not much work has been reported with respect to contamination of water resources by agrochemicals such as, chemical fertilizers. In order to study role of chemical fertilizers on water quality, it is important to understand the nature and the chemistry of surface and groundwater change that may occur due to physical process and anthropogenic activities. Without the assessment of water resources, it is not possible to have complete knowledge of quality characteristics as such as, physical, chemical and biological constituents. So, in order to assess the pollution levels of water resources around agricultural areas of Nanjangud taluk, the present study has been undertaken with an objective to study the influence of chemical fertilizers on water quality parameters. |
II MATERIALS AND METHODS |
| Study area: Nanjangud is one of the taluks in Mysore district, which is spread over, from 120 61 3911 N longitude 760 331 4611 E latitude to 120 071 5611 N longitude to 760 421 911 E latitude with annual rain fall of 697 mm. The total geographical area of Nanjangud taluk covers around 98,541 hectares, out of which, 61,552 hectares of land is used for agricultural purpose. Agriculture is the major occupation in the study area, which is greatly influenced by fertility and type of soil. One can find major part of land having red sandy and laterite soils. Study area is chosen with good irrigation facilities, it helps greatly in getting high productivity from agriculture. The commonly used chemical fertilizers in study area are, urea and DAP. Land use patterns and agricultural activity: The agricultural lands cover most of the area in Nanjangud taluk. The main cropping season is from September to January. During this period, the river and ground water sources are used for irrigation. The second cropping season is from February to May when paddy, vegetables, pulses and groundnut are grown as a rotaion crop for different seasons. These crops are mainly dependent on lake/pond and ground water. Rice and other crops are sometimes grown in some parts of the area during May to September, which mainly dependent on groundwater. The most commonly used fertilizer for paddy in this site is urea, NPK complex (20:0:20), diammonium phosphate and muriate of potash (KCl) are used during farming season. The recommended rate of nitrogen fertilizer application is 100-120 kg N/ha for paddy, 160 kg N/ha for sugarcane (per year) and 40– 100 kg N/ha for other crops. The amount of chemical fertilizers used varies within the study area depending on the type of crop and the actual rate of application varies depending on the farmer’s practice. Collection of water samples: Ten water samples were collected from selected agricultural lands of Nanjangud taluk., Mysore district, which includes ground, lake and channel water samples. Water samples were collected in clean polyethylene bottles. The sampling bottles were soaked in 1:1 diluted HCl solution for 24 h, washed three times with deionized water, and were washed again prior to each sampling . In case of bore wells, the water samples were collected after pumping the water for 10 min. Samples collected were transported to the laboratory on the same day, and filtered using 0.45 Millipore filter paper and acidified with ultra-pure nitric acid for cation analyses. For anion analyses, these samples were stored below 40C. The samples were analyzed for nutrients and major ions as per the procedure given in APHA (1989). Analysis of water samples: The urea residues were quantified by diacetyl monoxime method and diammonium phosphate residues were calculated by using amount of phosphate present in water sample, considering molecular weight of DAP and atomic weight of phosphate in DAP fertilizer. The pH and EC were measured by using pH meter and conductivity meter. Carbonates and bicarbonates were determined by titrimetric method. Calcium and magnesium were determined titrimetrically using standard EDTA method, sodium and potassium were determined by flame photometric method, chloride was determined by argentometric titration method. Nitrate was determined by phenoldisulphonic acid method. |
III. RESULTS AND DISCUSSION |
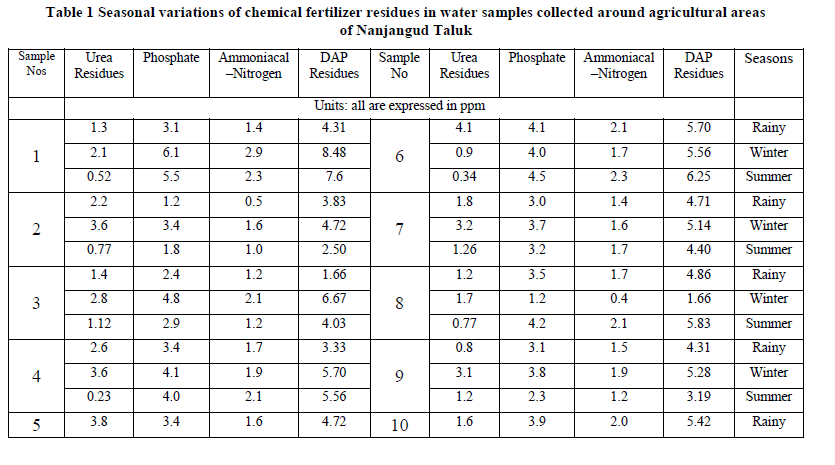
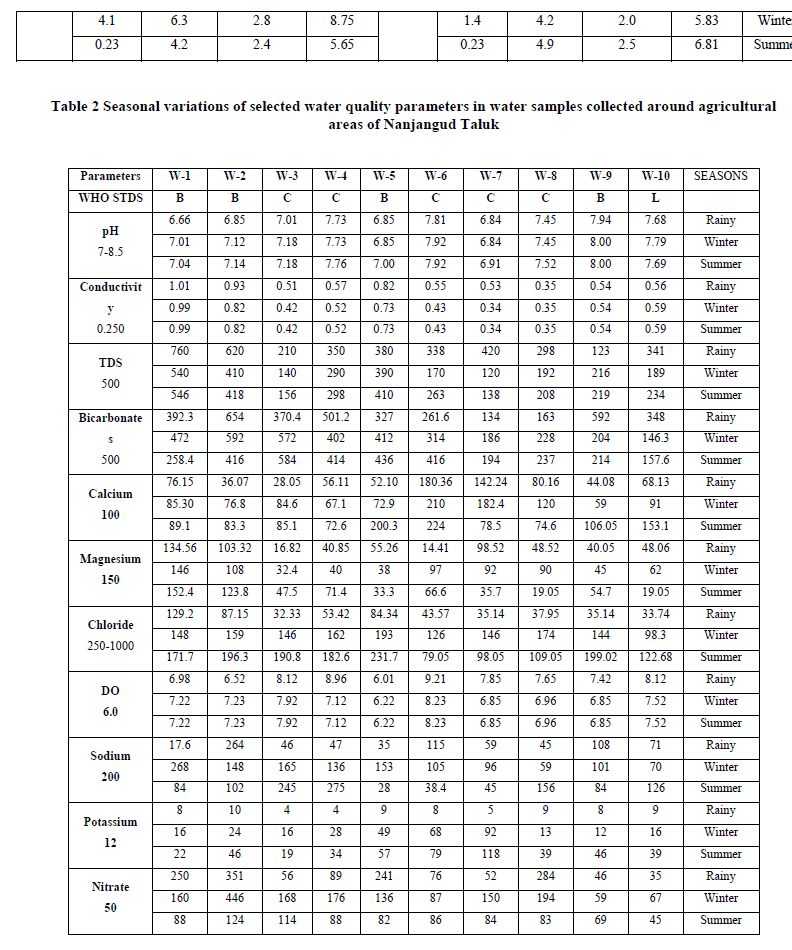
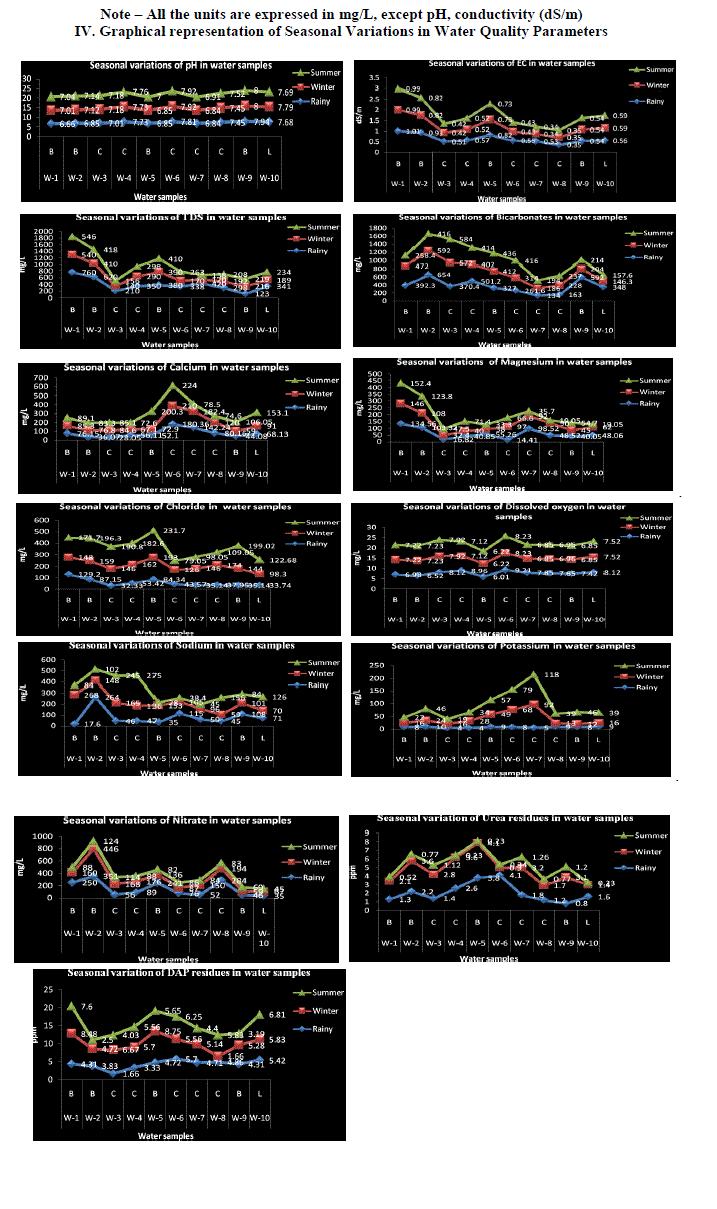
| Urea: Urea is one of the nitrogenous fertilizers which has received wider attention in agriculture, because of its potential role for seedling damage, ammonia volatilization and water pollution problems. Urea enters surface and ground water through leaching and surface run off from agricultural lands. Its entry into ground water depends on physical properties of soil like texture. During the present investigation, in Nanjangud taluk water samples, the urea residues ranged from 0.8 to 4.1 ppm in monsoon season. 0.4 to 4.1 ppm in post-monsoon season and during summer season, the value ranged from 0.11 to 0.88 ppm. Highest concentration was recorded during monsoon season, which could be due to surface run-off from agricultural lands. Diammonium phosphate residues (DAP): The DAP residues in Nanjangud taluk water samples ranged from a minimum of 1.66 ppm to a maximum of 4.70 ppm in monsoon season. 1.66 to 8.62 ppm in post-monsoon season and during summer season, the value ranged from 2.50 to 9.79 ppm. Highest concentration was recorded during summer season, which indicates that, the amount of fertilizers applied was not completely taken up by the crops. Since the study area was having good irrigation facilities though out the year, the phosphate entry into water resources through surface run-off was expected to be high. pH: pH is the measure of acidity or alkalinity of water. During the present study, pH of water samples in Nanjangud taluk ranged from a minimum of 6.66 to a maximum of 7.94 during rainy season. Similarly, in winter season, the variation of pH ranged from 6.84 to 8.00 and during summer season, the values ranged from 6.91 to 8.0. Highest values were recorded during winter season. During the present investigation, the variation in pH was found to be within the permissible limits of WHO standards. The results also show that, the alkaline pH is particularly due to presence of cations like Calcium, Magnesium and Sodium, Which was in conformity with the findings of Azeez et.al (2000). Electrical conductivity: Electrical conductivity is the measure of capacity of water to carry electric current. It signifies the amount of total dissolved salts present in solution. During the present study, electrical conductivity of Nanjangud taluk water samples ranged from a minimum of 0.35 to a maximum of 1.01 dS/m during rainy season. Similarly, during winter season, the values ranged from 0.34 to 0.99 dS/m and during summer season, the values ranged from 0.34 to 0.99 dS/m. The EC values in all the water samples were found to be within the permissible limits of WHO Standards. Highest value was recorded during monsoon season, which implies, enrichment of nutrients during monsoon season could be due to leaching and surface run-off from near-by agricultural lands. Total dissolved solids (TDS): The total dissolved solids indicate the nature of water quality. During the present investigation, the TDS values for water samples of Nanjangud taluk ranged from a minimum of 123 mg/L to a maximum of 760 mg/L in rainy season. Similarly, during winter season, the values ranged from 120 to 540 mg/L and during summer season the values ranged from 138 to 546. The desirable limit of TDS in water samples was up to 500 mg/L. The season wise TDS concentration was found to be high during rainy season, during which leaching and surface run-off of nutrients from agricultural fields was high compared to other seasons. The TDS concentration upto 1000 mg/L is permissible for drinking and agricultural purposes. From the present study, it can be concluded that, the water can be used for agricultural and drinking purpose. |
| Bicarbonates: Alkalinity of water is the capacity to neutralize a strong acid in a solution. During the present investigation, the carbonate values in Nanjangud taluk ranged from a minimum of 134 to a maximum of 654 mg/L during rainy season. 146.3 to 592 mg/L during winter season and during summer season, the values ranged 157.6 to 584 mg/L. During the present study, in some of the water samples, during all the seasons, bicarbonates concentration was found to be higher, which is normally due to the presence of carbonates, bicarbonates and hydroxides of Calcium and Magnesium. Calcium and Magnesium: Calcium and Magnesium are directly related to hardness of water. The Calcium and Magnesium of Nanjangud taluk water samples ranged from, a minimum of 28.05 to a maximum of 180.36 mg/L and 14.41 to 134.56 mg/L respectively during rainy season. Similarly, in winter season, the values ranged from 59 to 210 mg/L and 32.4 to 146 mg/L and during summer season, the values ranged from 72.6 to 200.3 mg/L and 19.05 to 152.4 mg/l. In some of the water samples, Calcium was found to be above the WHO standards. In all the water samples, magnesium concentration was found to be within the permissible limits of WHO standards. Highest concentration was recorded during summer season fallowed by winter season. High concentration of Calcium is not desirable for domestic purposes. Although the sources of Calcium in ground water resources are mainly associated with kondalitic rocks, the prolonged agricultural activities prevailing in the study area may also directly or indirectly relates to the dissolution of mineral in water resources Chloride: Chloride occurs naturally in all types of water samples. Chloride in natural water results from agricultural activities or some times, it could be due to dissolution of chlorides from chlorine containing rocks. During the present study, the chloride values in Nanjangud taluk were from a minimum of 32.33 to a maximum of 129.2 mg/L during rainy season. Similarly, during winter season, the value ranged from 98.3 to 174 mg/L and during summer season, the values ranged from 79.05 to 199.02 mg/L. In all the water samples during all the seasons, chloride concentrations were found to be within the permissible limits Dissolved oxygen (DO): During the present investigation, the dissolved oxygen in Nanjangud taluk water samples ranged, from a minimum of 6.01 to a maximum of 9.21 mg/L during rainy season. Similarly, in winter season, the values, ranged from 6.22 to 8.23 mg/L and during summer season the values ranged from 6.23 to 8.23 mg/L. In all the sampling places, all the seasons, the dissolved oxygen content was found to be higher than the permissible limits, which indicates the presence of high oxygen content in water samples. The higher level of nutrient load and other factors result in decreased level of dissolved oxygen in water samples. |
| Sodium and Potassium: The sodium and potassium concentrations in Nanjangud taluk water samples range from a minimum of 17.6 to a maximum of 264 mg/L and 4 to 10 mg/L respectively, during rainy season. Similarly, during winter season the values ranged from 59 to 268 mg/L and 12 to 68 mg/L and during summer season, the values ranged from 28 to 275 mg/L and 19 to 118 mg/L. High sodium concentration was reported in post-monsoon season and high potassium concentration was reported in summer season. In ground water surface water samples, the potassium contamination can result from the application of potassium fertilizers greater than the required concentration. Potassium leaching from the soil is important from the perspective of plant nutrition. If the fertilizer use and application to irrigation water exceeds the crop requirement, excess water will carry with it, soluble salts including Potassium, which implies, enrichment of Potassium in surface and ground waters which is due to influence of urea fertilizers Nitrate: The nitrate concentration in Nanjangud taluk water samples was from a minimum of 35 to a maximum of 351 mg/L during rainy season. Similarly, during winter season, the values ranged from 59 to 446 mg/L and during summer season the values ranged from 45 to 124 mg/L. In all the water samples, nitrate concentration was found to be above the permissible limits. Highest concentration of nitrate was recorded during post-monsoon season fallowed by rainy season In the soil, when urea is applied, it gets transformed to ammonium ion (NH4 +) by soil enzymes, which tends to be strongly, get adsorbed on soil particles. This adsorption inhibits the movement of ammonium ions through the soil. Ammonium ion is an energy rich and certain soil bacteria can utilize this energy by decomposing the ammonium ion to nitrate (NO3 -). Unlike ammonium ion, nitrate ion is not adsorbed on soil particles and therefore, moves readily with water in the soil. Nitrate that is not taken up by plant roots or soil micro-organisms can be transported to ground and surface water by a variety of mechanisms. |
| Phosphate: The phosphate content in Nanjangud taluk water samples was from a minimum of 1.2 to a maximum of 4.1 mg/L during monsoon season. Similarly, during post-monsoon season, the values ranged from 1.2 to 6.3 mg/L and during summer season, the values ranged from 1.8 to 7.0 mg/L. Highest phosphate concentration was reported during summer season. In the studied area, intensive crop production, continuous application of phosphate fertilizers and farmyard manure have been used at levels exceeding crop requirements was in practice throughout the study period, which indicated that, diammonium phosphate was the major source of enrichment of phosphate in water samples. |
 |
 |
 |
V. CONCLUSION |
| The present study confirms that, the application of chemical fertilizers has greater influence on water quality. In all the water samples during all the seasons urea and DAP residues were detected. The highest concentration was recorded during monsoon season. Among the water quality parameters pH and conductivity were found to be within the permissible limits except few a water samples. In case of cations and anions concentrations was found to be higher during rainy, winter, fallowed by summer seasons, which indicates that, the amount of fertilizers applied was not completely taken up by the crops. As the study area is having good irrigation facilities, though out the year, the nitrate and phosphate entry into water resources through surface run-off was expected to be more. In order to overcome water pollution problems, introduction of legislation by the state government, restricting the application of chemical fertilizers, splitting of fertilizer dose at required concentrations will help to reduce pollution of surface and ground water. |
ACKNOWLEDGMENT |
| One of the authors, Miss Divya J is grateful to University Grants Commission, New Delhi for providing financial assistance, in the form of Senior Research Fellowship. |
References |
|