ISSN ONLINE(2319-8753)PRINT(2347-6710)
ISSN ONLINE(2319-8753)PRINT(2347-6710)
Niranjana R1, Shanmugam P2
|
| Related article at Pubmed, Scholar Google |
Visit for more related articles at International Journal of Innovative Research in Science, Engineering and Technology
Most CETPs use Reverse Osmosis technology in their tertiary treatment. The major problem in this technology is the disposal of RO concentrate. The present disposal methods for the RO reject are energy intensive. This paper focuses on the concept of generating biogas from RO reject by codigesting it with secondary treatment plant sludge. Biochemical methane potential test were conducted for different ratios of RO reject and secondary treatment sludge, to examine the optimum ratio for biofuel generation. From the results obtained it was observed that the mixture containing one part of seed sludge and two part of RO reject were the optimum ratio.
Keywords |
| RO reject, Seed sludge, Biochemical methane potential test. |
INTRODUCTION |
| The leather manufacturing process comprise of various steps that involves conversion of raw skin which is a highly putrescible to leather, a stable material. These conversion processes normally involve a sequence of chemical reactions and mechanical processes generating large quantity of pollutant at each stage. The generation of pollution is significantly high in the pre-tanning operations compared to the post-tanning operations causing health hazards and intensifies environmental pollution. |
| Many tanneries have been close down because of their incapability to accommodate the emission standards and environmental regulations. The only way to cope up with the increasing standard stringency is to increase the innovation and viable alternative technology for the effluent treatment. |
| Reverse Osmosis is one of the prominent methods adopted by the industries for the reclamation of wastewater. The main reasons for numerous industries to adopt RO technology includes low energy consumption, the high rate of contaminant removal, simple design and operation, waste stream volume reduction. |
| While RO is an effective method for handling wastewater, what to do with that can be an issue. Mickley et al. [1] has presented a survey of drinking water plants that included 137 plants where 48 % dispose of the concentrate to surface water, 23 % dispose to the head-works of wastewater treatment plants, 12 % utilize a land application process, 10 % dispose via deep well injection, and 6 % use evaporation ponds. |
| ESCWA (2012) [2], stated that cost plays an important role in the selection of a brine-disposal method. The cost of disposal ranged from 5 – 33 % of the total cost of desalination for all methods. The cost of disposal depends on the characteristics of reject brine, the level of treatment before disposal, means of disposal, volume of brine to be disposed of, and the nature of the disposed environment. |
| Joo et al. [3]reviewed the characteristics of brine disposal from desalination plants and state that brine disposal comes in a different category than sewage disposal. There is no way to reduce brine to simpler and harmless compounds as they are already the simplest of inorganic compounds. The study also state that no good way exists to reclaim the carrying water from the dissolved solids, for if there were, it could be used in the desalting process. While the quantities of materials are very large, emphasized that these materials do not look attractive economically. |
| Del Bene et al. [4] state that there are various options for the disposal of reject brine from inland desalination plants. These include waste minimization, discharge to surface water, deep wells, land application, evaporation ponds, and wastewater evaporators. |
| Khordagui et al. [5] identified the following options for disposal of reject brine from RO plants: pumping into specially designed, lined evaporation ponds; deep-well injection; disposal into surface water bodies; disposal through pipelines to municipal sewers; concentration into solid salts; and irrigation of plants tolerant to high salinity (halophytes). |
| Squire et al. [6] conducted a study. This study indicate that removal of endocrine disrupting chemicals (EDCs) and pharmaceuticals or personal care products (PPCPs) with chemical processes are insignificant, whereas coupled adsorption and advanced oxidation processes are effective for degrading some EDCs and PPCPs. The biological treatments are ineffective as they are limited to theremoval of polar contaminants. Hence to balance wastewater reuse against increased water consumption, a more advanced and cost-effective treatment should be developed. |
| The applications of anaerobic digestion and employment of halophilic bacteria are effective in treating RO concentrates.Compared to other treatment methods, this system is capable of effectively removing organic colouring components, bad odours, volatile organic compounds, radionuclides, ammonia, sulfur, phosphorus, and various heavy metals. While an environmental treatment method that adds chemicals for an adsorptive effect or utilizes additional processes may not be economical or efficient due to the costs of electricity, equipment, and chemicals associated with these additional processes. Hence the objective of this research is to assess the feasibility of bio energy production by anaerobically treating the RO concentrates. |
II. MATERIALS AND METHODS |
| The RO concentrate sample was collected from the Pallavaram common effluent treatment plant. The required amount of sample for the experimental purpose was preserved in a closed airtight container. The sample was taken from the collection tank where the RO concentrate is stored before sending to the evaporator. |
| Sometimes an image may contain text embedded on to it.Detecting and recognizing these characters can be very important, and removing these is important in the context of removing indirect advertisements, and for aesthetic reasons.Secondary treatment plant sludge from the same CETP was collected and used as an inoculum in the experiment. After the collection of the sludge, it was let to settle under gravity for 14 days and then it was dewatered manually. To the dewatered sludge, nutrients were added for microbial and was maintained in an anaerobic condition for 5 days before starting the experiment. The nutrients added to the sludge is given in Table 1. |
 |
III. EXPERIMENTAL SETUP |
| The experiment was performed in 500 ml serum bottles. The effective volume of the reactor was maintained as 400 ml, rest was left free for gas collection. Anaerobic seed sludge and the substrate was mixed at different ratio and added to the bottles. Then the batch system is sealed with a rubber cork throughout the experiment. The reactors were stirred by daily shaking and swirling. A retention time of 30 days was maintained for the reactors. |
| An aspirator bottle was filled with 5% NaOH and was tightly clapped with a cork. A tube is inserted through the cork such a way that one end of the tube was submerged in the sodium hydroxide solution and the other end a syringe. This syringe was connected to the rubber cork of the serum bottle to measure the gas production by displacement method. This setup is done to minimize the contact of oxygen. NaOH solution was chosen because for its capacity to absorb CO2. |
| The BMP test was conducted for three different ratios of RO concentrate and seed sludge. The ratios were taken in the following order in four serum bottle and a duplicate set of these ratios were also made. |
| ïÃâ÷ Seed sludge (500ml) |
| ïÃâ÷ RO reject sample(250ml) + seed sludge(250ml) |
| ïÃâ÷ RO reject (334ml) + seed sludge(166 ml) |
| ïÃâ÷ RO reject (375) + seed sludge(125 ml) |
| One set of the ratios were used to analyse the gas production. The gas production was measured once in 3 days using water displacement method. The other set of the ratios were used for analysing parameters such as COD, ammonia, alkalinity and VFA in regular intervals. All the parameter analysis were carried out according to APHA methods. |
IV. EXPERIMENTAL RESULTS |
| For the RO concentrate collected from Pallavaram common effluent treatment plant, the initial characteristic analysis was done. The results are given in Table 2. |
 |
| The BMP assay test was performed for 4 different ratios of RO concentrate and seed sludge. The ratios were named as |
| ïÃâ÷ Seed sludge (1:0) |
| ïÃâ÷ 1 part of seed sludge + 1 part of RO concentrate (1:1) |
| ïÃâ÷ 1 part of seed sludge + 2 part of RO concentrate (1:2) |
| ïÃâ÷ 1 part of seed sludge + 3 parts of RO concentrate (1:3) |
| The below graph shows the comparative analytical results obtained from the BMP test |
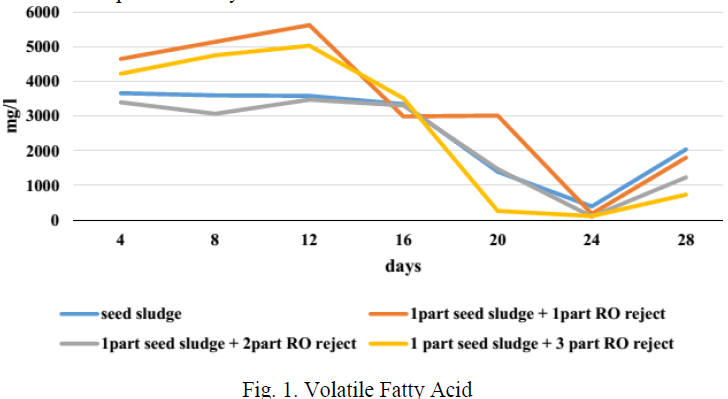 |
| Fig. 1 shows the volatile fatty acid level in four bottles over a period of 28 days. VFA is an important intermediate for the production of methane. The methanogens should consume these VFAs as soon as they are produced so that the pH remains in tolerable range. If not so, VFA may happen to accumulate in the reactor. VFA accumulation affect the pH which in turn will affect the methanogens which are pH sensitive [7]. When the methanogens are affected, the biogas production decreases drastically. From the VFA graph it can be interpreted that the reactor containing only seed sludge and the reactor containing one part of seed sludge and two part of RO reject dint have any VFA accumulation. |
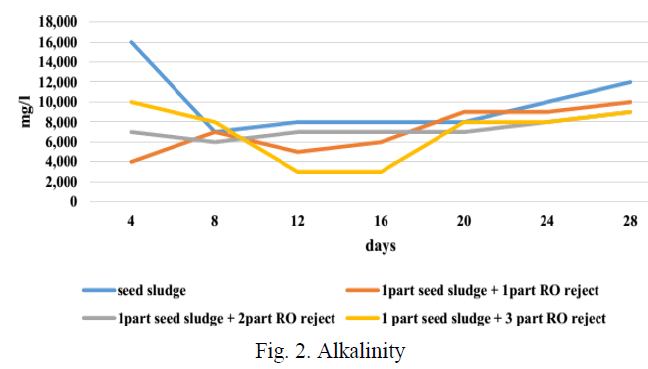 |
| Fig 2 shows the alkalinity content in the reactors. Alkalinity is the buffering capacity of substrate and mostly present in the form of bicarbonate in liquid phase. When there is wide and frequent variations in the alkalinity concentration in the reactor, it will affect the pH and in turn the gas production [8]. The graph shows variation in the in the alkalinity concentration in all the reactor, except the one containing one part of seed sludge and two part of RO reject. The steady alkalinity concentration in the reactor increases the buffering capacity of the substrate against VFA. |
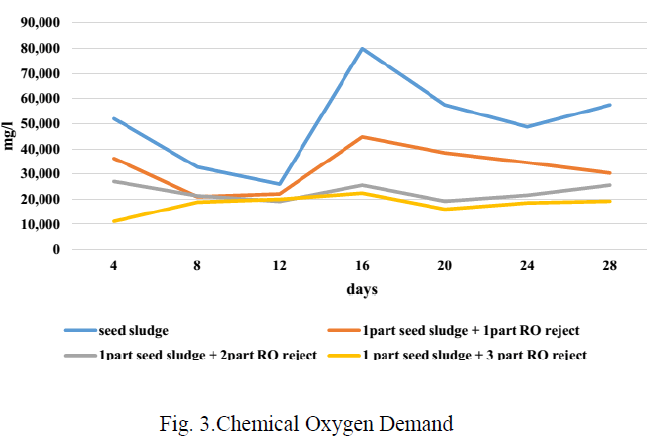 |
| Fig 3 shows the trend of COD during the BMP test period. As the bacteria feed on the organics present in the substrate, the COD should fall during digestion and at the end, as there will be no more organics, COD may rise due to the accumulation of dead bacterial population with corresponding fall in gas production. Though there is not much variation in the COD concentration in ratio 1:1 and 1:2, the COD concentration has decreased compared to the initial concentration, while it has increased in the other two ratios. |
| Fig 4 depicts the concentration of ammonia in each bottle during the period of BMP test. Increase in ammonia concentration beyond 800 mg/l inhibits methanogenesis [9]. As a result VFA accumulation occurs in the reactor and this results in a consequent reduction in pH. This condition is called ammonia toxicity. The graph shows that the maximum of 352 mg/l of ammonia was produced in due course of the study. The ammonia concentration has been steady in all the reactor, hence the ammonia concentration has no interference with the gas production in this study. |
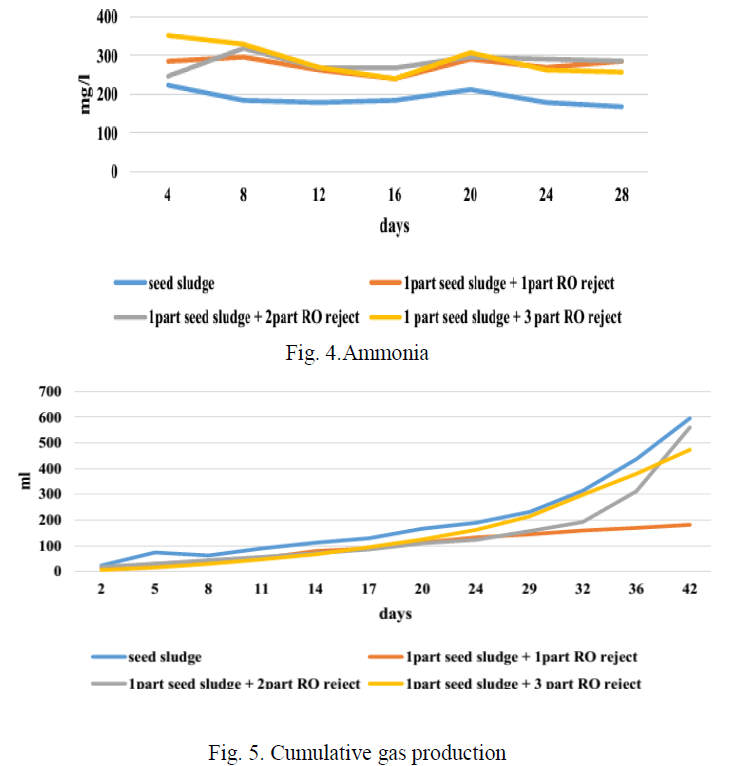 |
| FromFig.5, it can be seen that the ratio containing only seed sludge has the maximum gas production. When the reactors containing RO reject is studied, the reactor containing one part of seed sludge and two part of RO reject produced the maximum biogas. |
V. CONCLUSION |
| From evaluating the results, it can be inferred that the ratio of one part of seed sludge and two parts of seed sludge is optimum for gas proportion as it generates a constant and steady volume of biogas throughout the batch period. It also had a steady alkalinity level and minimal amount of VFA accumulation. This ratio also showed some amount of COD removal at the end of the experiment period. |
References |
|