Research & Reviews in Pharmacy and Pharmaceutical Sciences
e-ISSN:2320-1215 p-ISSN: 2322-0112
e-ISSN:2320-1215 p-ISSN: 2322-0112
Hang-Xing Xiong, Hong-Lin Wang, Hua-Xin Zhang and Li-Wei Li*
College of Chemical and Pharmaceutical Engineering, Jingchu University of Technology, Jingmen, Hubei 448000, People’s Republic of China
Received date: 04/04/2016 Accepted date: 22/04/2016 Published date: 28/04/2016
Visit for more related articles at Research & Reviews in Pharmacy and Pharmaceutical Sciences
Fluorescence quenching and fluorescence resonance energy transfer (FRET) theories are widely used in drug-protein binding study, but the inner filter effect is not always being corrected, which may cause inaccurate results. In view of this, the interaction of aspirin (ASP) with human serum albumin (HSA) was studied by three-dimensional fluorescence spectra, ultraviolet spectra, circular dichroism (CD) spectra, and molecular modeling methods. The inner effect was subtracted from raw data of the fluorescence when evaluating the number of binding sites, equilibrium constants, and thermodynamic parameters. The results showed that only one binding site formed on HSA and it obviously impaired by increasing temperature. The negative Gibbs free energy change (Gθ) suggested the binding was spontaneous. Meanwhile, negative enthalpy change (Hθ) and entropy change (Sθ) indicated hydrogen bonds had an important influence in the formation of ASP-HSA complex. The distance between donor and acceptor was calculated according to Förster’s non-radiation resonance energy transfer theory using the corrected fluorescence data. Synchronous spectra implied the polarity of tryptophan residue increased, which gave a clue to binding location. CD spectra were employed to detect the secondary structural changes of HSA. Based on experimental results, molecular modeling was carried out to calculate the most optimized docking mode, in which both panorama and details were involved.
Aspirin, Human serum albumin, Energy transfer, Inner filter effect, Molecular modeling.
One of significant factors to be considered on the pharmaceutical action of drugs is their binding tendency to plasma proteins [1]. The extent of protein binding in the plasma or tissue controls the volume of distribution and affects both hepatic and renal clearance [1,2]. Human serum albumin (HSA), generally regarded as a nonspecific transport protein, is a monomeric multi-domain macromolecule, representing the main determinant of plasma oncotic pressure and the main modulator of fluid distribution between body compartments [3], being primarily protein model in drug-protein binding research [4]. Aspirin, also known as acetylsalicylic acid (ASP; formula: C9H8O4; CAS Registry number: 50-78-2), is a salicylate drug, clinically used in the treatment of a wide range of conditions, including fever, pain, rheumatic fever, and inflammatory diseases, such as rheumatoid arthritis, pericarditis [5]. ASP also has an antiplatelet effect by inhibiting the production of thromboxane, which under normal circumstances binds platelet molecules together to create a patch over damaged walls of blood vessels and the platelet patch can become large enough to block blood flow, locally and downstream [6]. Lower doses of ASP have also shown to reduce the risk of death from a heart attack or the risk of stroke in some circumstances [7]. There is some evidence that ASP is effective at preventing colorectal cancer, particularly colorectal cancer, though the mechanisms of this effect are unclear [5,8].
For such an important drug, it's not surprising to find documents regarding to its interaction with serum albumins [9,10]. Binding equilibrium and binding geometry were involved in some references employing fluorescence method [11-13], but the inner filter effects were not corrected in calculation, which might impair the accuracy of partial results [14,15]. In addition, previous work did not give the thermodynamics of the interaction, which made it difficult to evaluate the nature of binding forces.
The purpose of this work was to investigate the binding reaction of ASP to HSA under simulated physiological conditions (ionic strength=0.1 mol·L−1; pH 7.40; aqueous solution) by multiple spectroscopic methods, to calculate binding constant, the number of binding sites and binding location using the data that have subtracted inner filter effects, to analyze the nature of binding forces from thermodynamic parameters, to detect structural changes of HSA, and to model the molecule structure of new complex according to experimental data.
Materials
HSA was purchased from Sigma (USA, 99%). ASP, Tris, HCl, NaCl were purchased from Shanghai Chemical Reagent Company (China). All other chemicals were of analytical grade. Stock solutions of HSA (10-5 mol·L-1), ASP (10-3 mol·L-1), NaCl (0.5 mol·L-1) and Tris-HCl buffer (0.05 mol·L-1 Tris, 0.15 mol·L-1 HCl) of pH 7.40 were prepared by directly dissolving the original reagents. Water used to prepare solutions was double-distilled.
Instrumental Methods
All fluorescence spectra were recorded on F-4600 Fluorescence Spectrofluorimetry (Hitachi, Japan) equipped with 1.0 cm quartz cells and a thermostat bath. To obtain smooth emission spectra with moderate intensity, the widths of excitation slit and emission slit were both set at 5 nm. The scanning speed was set at 2400 nm per minute. An excitation wavelength of 275nm was chosen and appropriate blanks corresponding to the buffer were subtracted to correct the background. UV spectra were recorded at different temperature on a TU-1901 spectrophotometer (Purkinje General, China) equipped with 1.0 cm quartz cells. Circular dichroism (CD) measurements were performed at 311 K on a J-810 Spectro-polarimeter (Jasco, Japan) equipped with 1.0 cm quartz cells over a wavelength range of 260-200 nm and under constant nitrogen flush at a scanning speed of 200 nm per min. The pH measurements were made with a pHS-3 digital pH-meter (Shanghai, China). All weight measurements were performed with an AY-120 electronic analytic weighing scale (Shimadzu, Japan).
Inner Filter Effect
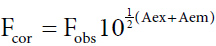
Inner-filter effect refers to the absorption of radiation going towards (excitation) or emanating from (emission). The fluorophore and it is important to subtract such an effect from the raw data of the fluorescence [14]. To correct the inner filter effects of HSA and ASP, absorbance was measured at excitation and emission wavelengths. The fluorescence intensity was corrected using the equation (1):
 (1)
(1)
Where Fcor and Fobs are the fluorescence intensities corrected and observed, respectively, and Aex and Aem are the absorption of the systems at the excitation and the emission wavelength, respectively. All the fluorescence intensity used in this paper is corrected intensity, with an exception of three-dimensional fluorescence spectra.
Molecular Modeling
Molecular modeling calculations were carried out using Sybyl 8.1. The crystal structure of HSA was from Brookhaven proteins data bank (PDB) database (entry codes: 1h9z for site I, 2bxg for site II). All the ligands and water molecules were removed before the analysis. H atoms were added and the biopolymer was charged using AMBER7 FF99 method. The site of the protein was defined with ligand (A/WRR2001 for site I, A/IBP2001 for site II); the principal regions of ligand binding to HSA were analyzed with Sybyl 8.1 software. The structure of ASP was generated with sybyl 8.1 package and the molecule was optimized (energy minimization) using Tripos Force Field after being charged with Gasteiger and Marsili method. The docking mode of ASP with HSA was conducted by a Surflex-Dock program in Sybyl 8.1 package.
Three-dimensional Fluorescence Spectra
Fluorescence allows a non-destructive way of tracking or analysis of biological molecules [16,17] and has been widely used in life science as it occurs in nature in various biological systems [17,18]. Fluorescence is a function of the excitation wavelength and emission wavelength, so full fluorescence information of a phosphor can only be descript by three-dimensional (3D) fluorescence spectrum, in which a stereopsis containing excitation wavelength, emission wavelength and fluorescence intensity is recorded. According to experimental procedures, 3D fluorescence spectra of HSA in the absence and in the presence of ASP were recorded and shown in Figure 1 The information of fluorescence peaks was listed in Table 1.
| Systems and parameters | Peak 1 | Peak 2 | |
|---|---|---|---|
| HSA | Peak position (λex/λem, nm/nm) |
225.0/340.0 | 275.0/340.0 |
| Relative intensity | 334.8 | 425.6 | |
| Stokes shift Δλ/nm |
115 | 65 | |
| HSA-ASP | Peak position (λex/λem, nm/nm) |
230.0/340.0 | 280.0/340.0 |
| Relative intensity | 45.50 | 262.6 | |
| Stokes shift Δλ/nm |
110 | 60 | |
Table 1. Characteristic parameters of three-dimensional fluorescence peaks.

Figure 1. Three-dimensional fluorescence spectra of HSA (a, a’) and HSA-ASP (b, b’) systems (cHSA= 2.0 × 10⁻⁶ mol L−1, cAZN= 3.5 × 10⁻⁴ mol L−1; a’ and b’ are the contour of a and b, respectively).
Two typical fluorescence peaks of HSA in Figure 1 were labeled as peak1 and peak 2, respectively. Peak 3 (235.0/340.0, 71.54) and peak 4 (290.0/410.0, 366.1) were typical fluorescence peaks of ASP. The intensity of peak 2 is obviously higher than peak 1, so the excitation frequency of peak 2 (275 nm) was selected as the best excitation wavelength in following experiments. The intensity of these two peaks significantly decreased when ASP was added, which is commonly known as fluorescence quenching.
UV Absorption Spectra
Fluorescence quenching can be caused by a lot of physical and chemical processes [19], but can be classified as either dynamic or static mechanism [20]. Static mechanism refers to radiation decrease caused by ground-state complex formation, in which process the absorption of phosphor and quencher always alters as the absorption spectra of HSA are sensitive to the microenvironment surrounding the chromophore [21]. Figure 2 displays the UV absorption spectra of HSA, ASP, HSA-ASP systems. In Figure 2, curve b’ is the physical superposition of absorbance of HSA and ASP. It is obviously different from the spectrum of HSA-ASP system (curve b), which gives a hint that new compound formed. As shown in Figure 2, HSA has an absorption peak at 275 nm, which coincides with the typical fluorescence peak of HSA in 3D spectra. Meanwhile, ASP can also absorb the radiation at 275 nm, which means its inner filter effect cannot be ignored [22].

Figure 2. UV absorption spectra of HSA, ASP and HSA-ASP systems.
Quenching Mechanism Analysis
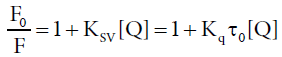
In order to ascertain the quenching mechanism, the emission spectra of HSA in the presence of different Amount of ASP were recorded when the excitation wavelength was stabilized at 275 nm, as shown in Figure 3. Supposing the quenching was dynamic quenching, the fluorescence data at different temperatures could be analyzed with the well-known Stern-Volmer equation [23,24]:

Figure 3. Fluorescence emission spectra of HSA-ASP systems.
 (2)
(2)
Where F0 and F are the fluorescence intensity in absence and in presence of quencher, respectively, KSV is the Stern-Volmer quenching constant, [Q] is the concentration of the quencher. Kq the quenching rate constant of the biological macromolecule and Kq=KSV/τ0, τ0 is the life time of the fluorophore in the absence of quencher and the life time of the biopolymer is equal to 10-8 s [25]. Equation 2 could be applied to determine KSV by linear regression of a plot of F0/F against [Q]. Figure 4 displayed the Stern-Volmer plots of the fluorescence quenching of HSA by ASP at four different temperatures, the corresponding KSV at each temperature were calculated and listed in Table 2.

Figure 4. Stern-Volmer plots for the quenching of HSA by ASP.
| pH | T(K) | KSV(103L·mol-1) | Kq (1011L·mol-1·s-1) | SD* |
|---|---|---|---|---|
| 7.4 | 292 | 1.096 | 1.096 | 0.0037 |
| 298 | 1.554 | 1.554 | 0.0082 | |
| 304 | 2.096 | 2.096 | 0.0096 | |
| 310 | 2.400 | 2.400 | 0.016 | |
| *SD is the standard deviation for KSV | ||||
*SD is the standard deviation for KSV
Table 2. Stern-Volmer constants.
Dynamic quenching is caused by collision [26,27], the maximum scatter collision quenching constant of various quenchers with biopolymer is 2.0 × 10¹⁰ L·mol-1·s-1 [28], but it is obvious that the rate constants Kq shown in Table 2 are greater than 2.0 × 10¹⁰ L·mol-1·s-1. These results indicate that the quenching was not initiated from dynamic collision but from the formation of a new complex [21].
Binding Equilibrium and Thermodynamics
About 50-80% of ASP in the blood is bound to albumin protein, while the rest remains in the active, ionized
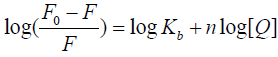
state. For a static quenching process, the binding equilibrium can be determined by following equation 3 [15,29]:
 (3)
(3)
Where F0, F, and [Q] are the same as in eq 2, Kb is observed binding constant and n is the number of binding sites per HSA molecule. The value of log (F0/F−1) is linear with the value of log [Q], in which the slope is the number of binding site (n) whereas the intercept (ordinate at the origin) is the logarithm value of Kb (log Kb). The regression curves and equations were shown in Figure 5. The corresponding Kb and the number of binding sites (n) were calculated and list in Table 3. The value of observed binding constant decreased with the increasing temperature, which indicated the stability of new complex was strikingly affected by temperature.

Figure 5. Log (F0/F−1)-log [Q] plots at different temperatures.
| pH | T(K) | Kb(L·mol-1) | n | SDa | ΔHθ (kJ·mol-1) | ΔSθ (J·K-1) | ΔGθ (kJ·mol-1) |
|---|---|---|---|---|---|---|---|
| 7.40 | 293 | 103.126 | 1.027 | 0.014 | -46.92 | -100.9 | -17.45 |
| 299 | 102.928 | 0.9251 | 0.023 | -16.84 | |||
| 305 | 102.822 | 0.8445 | 0.012 | -16.24 | |||
| 311 | 102.620 | 0.7517 | 0.009 | -15.63 |
aSD is the standard deviation for Kb
Table 3. Observed binding constants, binding sites and thermodynamic parameters.
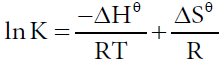
In order to estimate the type of affinity between ASP and HSA, the enthalpy change and entropy change of the interaction are important [30,31]. Therefore, the dependence of binding constant on temperature was studied using the equation (4,5):
 (4)
(4)
 (5)
(5)
Where Hθ, Gθ and Sθ are enthalpy change, Gibbs free energy change and entropy change, respectively. The plot of logK versus 1/T (Van’t Hoff plot) enables the determination of Hθ, Sθ in isobaric processes and Gθ can be calculated by eq. (5). Van’t Hoff plot was shown in Figure 6 and thermodynamic parameters were listed in Table 3. The negative Gθ in Table 3 indicated the interaction between ASP and HSA was spontaneous under physiological conditions. The negative Hθ suggested the binding reaction was an exothermic process, which could in turn give reasonable explanations for the decreasing value of Kb and n with temperature in Table 3. The negative Sθ suggested the interaction was entropy-driven.

Figure 6. Van’t Hoff plot for the binding of ASP with HAS.
Based on the views of Ross and Subramanian [32], positive Sθ value represents the existence of hydrophobic interaction. Negative Sθ and Hθ always reflects van der Waals force or hydrogen bond formation. Hθ≈0 may be a clue of electrostatic force. Based on these rules, it can be speculated that hydrogen bond and van der Waals power were the major contributors in stabilizing the structure of HSA-ASP complex.
Conformation Investigation
Synchronous fluorescence spectra can give the characteristic information of tryptophan residues and tyrosine residues when the wavelength shift (Δλ) between excitation and emission wavelength was stabilized at 60 nm and 15nm, respectively [25]. As shown in Figure 7, a red shift could be observed on the synchronous fluorescence spectra of tryptophan residues (Δλ=60 nm), which indicated the environmental polarity around tryptophan residues increased because of the binding of ASP [24,33].

Figure 7. Synchronous fluorescence spectra of HSA system.
To confirm the concrete influence of ASP binding on the secondary structure of HSA, circular dichroism (CD) spectroscopy is used, which has been used to examine proteins, polypeptides, and peptide structures. CD spectrum in the far ultraviolet (UV) regions are dominated by the n→π* and π→π* transitions of amide groups, and are influenced by the geometries of the polypeptide backbones [34,35]. CD spectrum of HSA exhibits two negative bands at 208 and 222 nm which reflect the characteristic of α-helix in the advanced structure of protein as these two negative peaks are both contributed to n→π* transfer for the peptide bond of α-helical [34]. CD results can be expressed in terms of mean residue elasticity (MRE) in deg cm2 d mol–1 according to the following Equation 6:
 (6)
(6)
Where Cp is the molar concentration of the protein, n the number of amino acid residues and l is the path length (0.1cm). The α-helical contents of free and combined HSA were calculated from MRE values at 208 nm using the (equation 7) [36,37].
 (7)
(7)
Where MRE208 is the observed MRE value at 208 nm, 4000 is the MRE of the β-form and random coil conformation cross at 208 nm and 33,000 is the MRE value of a pure α-helix at 208 nm.
CD measurements in absence of and in presence of ASP were performed (Figure 8). The estimations for secondary structural elements using SELCON3 software are listed in Table 4. A reduction of the α-helix from 59.8% (free HSA) to 54.6% was detected at concentration ratio of 10:1for ASP: HSA. This could be explained by the changes of hydrogen bonding networks on the main polypeptide chain of HSA, which resulted from ASP’s binding to the amino acid residues by new hydrogen bonds [38]. In addition to this, more detailed secondary structure changes including regular α-helix, distorted α-helix, regular β-strand, distorted β-strand, β-turns and unordered structure, were also involved in Table 4.

Figure 8. The CD spectrum of HSA and ASP-HSA system.
| System | H(r) (%) |
H(d) (%) |
S(r) (%) |
S(d) (%) |
Trn (%) |
Unrd (%) |
|---|---|---|---|---|---|---|
| HSA | 40.2 | 19.6 | 2.9 | 3.0 | 12.9 | 20.8 |
| HSA-ASP | 35.1 | 19.5 | 4.4 | 4.5 | 16.4 | 23.2 |
a H(r): regular α-helix; H(d): distorted α-helix; S(r): regular b-strand; S(d): distorted b-strand; Trn: b-turns; Unrd: unordered structure.
Table 4. Fractions of different secondary structures determined by SELCON3a.
Energy Transfer between ASP and HAS
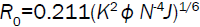
According to Forester’s non-radioactive fluorescence resonance energy transfer theory [39], energy transfer can take place through direct electrodynamics interaction when (i) The donor can produce fluorescence light; (ii) fluorescence emission spectrum of the donor and UV–vis absorbance spectrum of the acceptor have more overlap; and (iii) the distance between the donor and the acceptor is no longer than 8 nm [40]. In detail, it can be described by the following (equations 8-10) [33,41,42].
 (8)
(8)
 (9)
(9)
 (10)
(10)
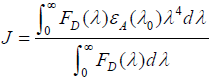
where E is the efficiency of transfer between the donor and the acceptor, R0 the critical distance when the efficiency of transfer 50%, r the distance between the acceptor and the donor, K2 the space factor of orientation, N the refractive index of medium, ÃâÃâ the fluorescence quantum yield of the donor, J the effect of the spectral overlap between the emission spectrum of the donor and the absorption spectrum of the acceptor, FD(λ) the corrected fluorescence intensity of the donor in the wavelength range λ0 to λ, and εA (λ0) the extinction coefficient of the acceptor at λ0.
The overlap of the absorption spectrum of ASP and the fluorescence emission spectrum of HSA is shown in Figure 9. The overlap integral, J, can be evaluated by integrating the spectra in Figure 9 according to the Equation (10). Under present experimental conditions, K2=2/3, N=1.336 and ÃâÃâ=0.118 could be used [17]. Finally, the values of these parameters were found to be: J=1.976×10¹³ L mol−1 cm-1 nm4, R0=1.87 nm, E=0.016 and r=3.71 nm. So the distance between the ASP and the donor (tryptophan in HSA) was 3.71 nm.

Figure 9. Absorption spectrum of ASP and fluorescence emission spectrum of HSA.
Molecular Modeling
Crystallographic analyses revealed there are in HSA’ structure 585 amino acid residues which are divided into three homologous a-helical domains, named as domain I (residues 1-195), domain II (residues 196-383) and domain III (residues 384- 585) [43,44]. Each domain contains 10 helices that is divided into antiparallel six-helix and four-helix subdomains, marked by A and B, respectively [4,45]. Aromatic and heterocyclic ligands were found to bind within two hydrophobic pockets in subdomains IIA and IIIA [46]. In Table 3, the number of binding sites n was closed to 1, which indicated HSA molecule had only one binding site for ASP under specified conditions. Previous studies [11] proved that ASP bond in the subdomain IIA of HSA, which is also named Sudlow’s site I according to Sudlow’s nomenclature [47]. This is also supported by energy transfer calculation because there is in HSA the only one tryptophan residue locating in the subdomain IIA [43,48].
In order to visually present the binding mode of ASP to HSA, molecular modeling method was employed. In our work, Sybyl 8.1 software was selected to evaluate the most reasonable mode of the interactions. The highest scoring binding site was. To further unfold the binding details, molecule docking was performed by Suflex-dock program in Sybyl 8.1 and the best energy ranked result was enlarged and displayed in Figure 10, where the residues adjacent to ASP were presented by lines.
It was evident that ASP molecule lay within subdomain IIA, adjacent to several hydrophobic amino acid residues including LEU219, LEU238, TRP214, ALA291 and PHE223. This indicated that hydrophobic forces had contributed to the interaction [49]. In addition, there were hydrogen bonds between ASP and residues of HSA marked by yellow dashed lines in Figure 10 (O-H-N of O12 with LYS199 and O-H-N of O20 with ARG222), which was in accordance with the binding mode proposed in thermodynamic analysis based on the rule of Ross and Subramanian.

Figure 10. Molecular modeling of interaction between ASP and HSA.
The distances between the atoms of ASP and residues, within 5 Å, were found out and listed in Table 5. It showed that the distance between ASP and tryptophan (TRP214) was 3.65 nm, the value of r here was of no significant difference from of the value of energy transfer calculation, which in turn proved the rationality of molecular modeling results.
| Atom of the drug | Atom of the residue | Distance |
|---|---|---|
| C 1 | LEU219C3 | 4.82 |
| C 2 | ARG218C3 | 3.70 |
| C 3 | TRP214Car | 3.65 |
| C 5 | LEU238C3 | 3.26 |
| C 6 | LEU219C3 | 3.96 |
| O 10 | HIS242N2 | 3.48 |
| C 13 | ARG257Np13 | 4.52 |
| C 4 | LYS199N4 | 3.81 |
| O 9 | ARG222Np13 | 2.91 |
| H 18 | PHE223Car | 4.45 |
| O 8 | ALA291C3 | 3.96 |
Table 5. The distance between the atoms of the ASP and the atoms of the residues (within 5 Å).
Note: a) Binding site of ASP on HSA (HSA is shown in cartoon. ASP is represented using spheres with hydrogen atoms omitted. The atoms of ASP are color-coded as follows: C white; O red); b) Residues adjacent to ASP; c) Residues within 5 Å (The residues of HSA are presented by lines and ASP is presented by skeleton with hydrogen atoms in b and c).
In this work, interaction of ASP with HSA was investigated in vitro using 3D fluorescence spectra, ultraviolet spectra, CD spectra and molecular modeling method. In order to reduce the impact of inner filter effect, all fluorescence data used in calculation was corrected. The results showed that hydrogen bonds play the major role in maintaining the only binding site with high affinity in sub-domain IIA (Sudlow’s site I) of HSA molecule. The thermodynamic parameters suggested that the interaction was a spontaneous, exothermic and entropy-driven process. The distance between ASP and tryptophan residue (TRP214) was 3.71 nm, which was basically in line with molecular modeling calculation. The secondary structure changes of HSA including regular α-helix, distorted α-helix, regular β -strand, distorted β -strand, β -turns and unordered structure were calculated by CD spectra. In addition, the best score-ranked binding model recommended by molecular modeling calculation revealed a panorama of the drug-protein interaction including details of binding site, binding affinity and spatial structure at molecular level. All details were in good accordance with experiment results. In measurements of fluorescence quenching, inner-filter absorption could cause large errors in the evaluation of binding details. Therefore, this work was of great significance in understanding pharmaceutical effects of ASP.
The authors gratefully acknowledge the fund support from Key project of Hubei Natural Science Foundation (2013CFA015), Research Foundation of Education Bureau of Hubei Province of China (Q20154303), Scientific Research Project of Jingchu University of Technology (ZR201507) and Open Program of Hubei Key Laboratory of Drug Synthesis and Optimization (OPP2014YB01)