Research & Reviews: Journal of Chemistry
e-ISSN: 2319-9849
e-ISSN: 2319-9849
1Scientific Research Department, Malâa Center, 3042 Sfax, Tunisia
2Department of Analytical Chemistry, Faculty of Pharmacy, University of Monastir, Monastir, Tunisia
Received date: 11/01/2017 Accepted date: 22/01/2017 Published date: 29/11/2017
Visit for more related articles at Research & Reviews: Journal of Chemistry
The main objective was to develop and validate a method to assaying simultaneously nine residual solvents mentioned in the guidelines of the International Conference on Harmonization (ICH) Q3C: toluene, methanol, ethanol, acetone, propan-2-ol, ethyl acetate, tetrahydrofuran, dichloromethane and acetonitrile. Chromatographic separation was achieved on DB-624 column (30 m × 0.53 mm, 1.8 μm), nitrogen carrier gas and flame ionization detector. We have optimized the carrier gas flow, programming oven temperature and the split ratio. We have opted for the dimethyl sulfoxide as dissolution solvent. The developed method was validated for linearity, precision, accuracy and specificity and then applied for the research and quantification of residual solvents levels in two drug substances. Excellent results were obtained. The developed method proved to be simple, producing symmetric peak shape, good resolution and reasonable retention time for solvents elution before seventeen minutes, specific, precise and linear in the range from the reporting level limit of quantification to 120% of the limit value, with a correlation coefficient greater than 0.999. The use of n-butyl acetate as internal solvent has improved the linearity and precision, compensating for the occurring variability. The quantification of residual solvents levels in two drug substances nefopam and enoxaparin, did not exceed the amount specified by the ICH guidelines. Thus, our method can be applied for the routine quantification of residual solvents levels in different active substances, for pharmaceutical companies and research laboratories
Gas chromatography, Residual solvents, Headspace, Analytical validation, Flame ionization detection, Analytical method, Internal standard
They are also used in lines production cleaning and to avoid any cross contamination. The residual solvents (RS) in pharmaceuticals are defined as organic volatile chemicals that are used or produced in the manufacture of active substances or excipients, or in the preparation of medicinal products. They are essential in each steps of pharmaceutical process (reaction, separation and formulation), improving the reactions performance, and the production of some characteristics for active substances such as crystalline form, solubility and purity following the good manufacturing practices [1].
However the RS are not completely eliminated by the manufacturing techniques and their trace can remain in the finished product, which can influence on the organoleptic characters such as odor or taste to be unpleasant for patients, the effectiveness or therapeutically effect, bioavailability, security and stability of pharmaceutical products [2,3]. Furthermore, they may also accelerate the decomposition process of the product.
Many authors have published articles about polymorphism of pharmaceutical products and the influence of RS on their morphology, such as the influence of triethylamine as RS on the ampicillin trihydrate stability and degradation [3]. The RS main also interfere in the content-containing interactions, such as the transfer of plasticizing PVC (polyvinyl chloride) constituting the thermoformed alveoli, or additives from elastomer corks [3]. Since there is no therapeutic benefit from RS, which many of them are known to be hazardous to humans and the environment, all RS should be removed at the end of the manufacturing process to the extent possible, in order to meet product specifications and good manufacturing practices. The control of impurities in pharmaceutical products is the main goal of pharmaceutical industry analysts [4,5]. The control must be in conformity with ICH Q3A (R2): impurities in new drug substances [6,7] and ICH Q3B: impurities in new drug products [8]. The ICH has adopted Impurities Guidelines for RS and daily exposure limits (ICH guideline Q3C) [9]. Its objective is to recommend acceptable amounts of RS in pharmaceuticals for the safety of the patient, indicating the use of less toxic solvents and describing levels considered to be toxicologically acceptable. Four different classes are described: solvents that are known to cause unacceptable toxicities (Class 1) should be avoided in the production of active substances, excipients, or medicinal products unless their use can be strongly justified in a risk-benefit assessment; solvents associated with less severe toxicity (Class 2) should be limited in order to protect patients from potential adverse effects. Ideally, less toxic solvents (Class 3) should be used where practical. The class 4 includes solvents for which no adequate toxicological data was found. Conforming to ICH guidelines, class 1 solvents need to be identified and quantified, solvents from class 2 should have individual limits between 50 and 5000 ppm, and solvents from class 3 must be identified and quantified when they are found to be more than 0.5% (w/w). The first analytical method for RS, which was published in pharmacopoeias, was a loss of weight, which is a simple and not demanding method, but it has many disadvantages, including lack of specificity, high limit of detection (about 0.1%), and a relatively large amount of sample needed to perform the tests (about 1 to 2 g). Gas chromatography (GC), because of its excellent separation abilities, low limit of detection, and due to the volatility of organic solvents and the substantial separating capability of capillary columns, has dominated analytical methods for RS determinations. In GC, the sample is either dissolved in a suitable solvent than injected directly [10,11] or by headspace sampling [12,13]. Headspace sampling is preferred because of its ability to avoid direct liquid or solid probing. In the headspace sampling complex sample matrix in a solid or liquid sample matrix in liquid or solid sample can be simplified or even eliminated in its vapor phase [14].
The European monograph under chapter 2.4.24 “Identification and control of residual solvents” [15] presents two procedures A and B which are useful to identify and quantify RS. The system A is recommended for general use, while system B is employed normally for confirmation of identity. Both system use static headspace GC with flame ionization detection (FID).
This general method may be used for identification of class 1 and 2 RS when there is no information about solvents which likely to be present in the specimen ; as a limit test for class 1 and 2 solvents when they are detected in the sample ; for quantification of class 3 solvents when it is required.
Implementation of this general method is a subject of debate in the pharmaceutical industry because of its limited selectivity and sensitivity [16]. Otherwise, some studies of technical problems have been noted, for example, artifact formation during analyses of hydrochlorides of basic compounds in N,N-dimethylformamide [17]. Moreover, this general method does not recommend the use of internal standard although it may overcome the matrix interferences and enhance the accuracy and precision of GC analysis. The internal standard efficiently compensates for the variables occurring during sample extraction and injection, especially for complex sample preparation procedure [16,18,19]. Furthermore, the European Pharmacopeia’s general method has a long run time to achieve the satisfactory separation for all solvents. For this reason, manufacturers try to find their own methods which would be quicker, easier and adaptable to their specific samples and analytes [16,20]. Several authors have developed methodologies for determination of RS in pharmaceuticals [21,22].
The aim of this work is to develop an analytical method for the simultaneous separation of nine RS, commonly used in active substances manufacturing belonging to class 2 and 3, by GC with headspace injector, starting from the European Pharmacopoeia recommended conditions and by optimizing several parameters in order to improve the analytical performance such as resolution, run time, precision and accuracy; then to validate the new developed method, improving the linearity and fidelity criteria by the use of an internal standard; and applying it to the research and quantification of RS likely to be present in drug substances, such as methanol, toluene levels in nefopam; and methanol, ethanol levels in enoxaparin.
Active Substances and Reagents
Enoxaparin and nefopam raw materials were procured respectively from TECHDOW (china) and ISOCHEM (France). All solvents and reagents used in this study were analytical grade (HPLC grade). The solvents from class 2 and 3 namely methanol, acetonitrile, dichloromethane, toluene, ethanol, acetone, ethyl acetate, propan-2-ol, tetrahydrofuran (THF), ethyl acetate, n-butyl acetate and dimethylsulfoxide (DMSO) were purchased from SIGMA ALDRICH (TUNISIA).
Apparatus: Headspace gas chromatography
A GC (AGILENT Technologies G1530A) is equipped with Agilent 7694 Headspace injector, coupled to FID. A capillary column DB 624 with 30 m long, 0.53 mm in inner diameter and 1.8 μm in film thickness (Agilent) was used. The acquisition and treatment of data were achieved by using a computer equipped with Agilent ChemStation Software 3.2.1 version. The other used materials were a balance (Denver Instrument SI-234), glassware as volumetric double line pipettes, flask, a beaker, and calibrated micropipettes.
General Procedure
European pharmacopeia conditions
In this study, System A conditions from the European Pharmacopeia was selected for method development and validation (Table 1) [15].
| Sample Prepration | Water-soluble articles | About 250 mg of the tested material dissolved in a 25 mL volumetric flask with water and then 5.0 mL of this solution transferred to head space vial filled with 1.0 mL of water. |
| Water-insoluble articles | About 500 mg of the tested material dissolved in a 10 mL volumetric flask with N,N dimethylformamide and then 1.0 mL of this solution transferred to head space vial filled with 5.0 mL of water. | |
| Injection source | Head space sampler | |
| Stationary phase | Nature | Cross linked mixture: (6%) Cyanopropyl-phenyl- (94%) dimethylpolysiloxane. |
| Column | support | Fused silica capillary or semi capillary. |
| type | 30 m × 0.32 mm column coated with 1.8 μm layer of stationary phase (only for water soluble articles) or a 30 m× 0.53 mm wide-bore column coated with a 3.0 μm layer of stationary phase. | |
| Carrier gas | Nitrogen or helium. | |
| Carrier gas velocity | About 35 cm/s. | |
| Injection port temperature | 140°C. | |
| Split ratio | 1:5 for water soluble articles and 1:3 for water insoluble articles (can be modified to optimize sensitivity). | |
Table 1: European Pharmacopeia conditions (System A).
Optimization of GC Conditions
The developed method by GC coupled to headspace injector should allow the simultaneous research and quantification of nine RS: toluene, methanol, ethanol, acetone, propa-2-ol, acetonitrile, dichloromethane, ethyl acetate, THF. We had started following the conditions of the European Pharmacopeia’ System A. As the obtained results were insufficient, such as a long run time and a poor resolution, we had proceeded to optimize the carrier gas flow, programming oven temperature and the split ratio.
Standard and Sample Preparation
Sample preparation solution S1 at concentration 0.1 g/ml was prepared by dissolving accurately weighted about 0.5 g of the active substance to be analysed into an Agilent technologies manufactured 20 ml flat bottom headspace GC vials, adding 5.0 ml of the solution S2, then sealing vial properly fitted with a septum and crimp cap.
The internal standard solution S2 at concentration 0.2 mg/ml was prepared by introducing 30 ml of DMSO in a 250 ml volumetric flask and adding accurately weighted about 50 mg of n-butyl acetate, completing up to the mark with DMSO.
The standard solution S3 was prepared by introducing 30 ml of the solution S2 in a 100 ml volumetric flask, and adding accurately weighted about 500 mg acetone, 500 mg ethanol, 500 mg propan-2-ol, 500 mg ethyl acetate, 300 mg methanol, 60 mg dichloromethane, 89 mg toluene, 41 mg acetonitrile and 72 mg THF. This standard solution S3 contains about 0.5 mg/ ml of acetone, 0.5 mg/ml of ethanol, 0.5 mg/ml of propa-2-ol, 0.5 mg/ml of ethyl acetate, 0.3 mg/ml of methanol, 0.06 mg/ml of dichloromethane, 0.089 mg/ml of toluene, 0.041 mg/ml of acetonitrile and 0.072 mg/ml of THF. These quantities compared to the active substance, correspond to the European Pharmacopeia’ fixed limits to 5000 ppm of acetone, 5000 ppm of ethanol, 5000 ppm of propan-2-ol, 5000 ppm of ethyl acetate, 3000 ppm of methanol, 600 ppm of dichloromethane, 890 ppm of toluene, 410 ppm of acetonitrile, and 720 ppm of THF [15].
Validation of the Developed Method
Validation was carried with respect to various parameters as required under ICH guideline Q2 (R1) [23-26].
Specificity and selectivity
The selectivity was determined by analysis of the blank solution containing the dissolution solvent and the internal standard, to the standard solution containing the nine RS mixture diluted in DMSO (solution S3). The specificity of the method was evaluated by the resolution factor Rs between each nearest peak.
Linearity
Linearity was determined in duplicate by cascade dilution series from a standard solution (S4) at 120% of nine RS mixture. ICH Q2B specifies minimum linearity range from the reporting level of quantification limit to 120% of the limit value [24]. Six concentrations were selected in this study. We had checked the linearity for all the RS mentioned in this study, by the correlation coefficient R2.
The standard solution at 120% (S4) was prepared by introducing 30 ml of S2 solution into 100 ml volumetric flask and adding accurately 600 mg of acetone, 600 mg of ethanol, 600 mg of propan-2-ol, 600 mg of ethyl acetate, 360 mg of ethanol, 72 mg of dichloromethane, 106.8 mg of toluene, 49.2 mg of acetonitrile and 86.4 mg of THF. A 1/10 dilution with solution S2 was done, then we pipetted 2 ml of this solution into 20 ml headspace GC vial and we properly sealed vial fitted with a septum and crimp cap.
Accuracy
Accuracy was determined in triplicate at three concentration levels (120%, 100% and 80%) from S4 solution, and by adding 0.5 g of the active substance. The percent recovery was calculated as the ratio between the found and the introduced quantity of the RS, that’s mean the observed and true value. The accuracy was checked for two active substances nefopam and enoxaparin, which the RS likely to be present are methanol and toluene for nefopam, and methanol and ethanol for enoxaparin.
Precision
The precision of an analytical procedure expresses the closeness of agreement (degree of scatter) between a series of measurements obtained from multiple sampling of the same homogeneous sample under the prescribed conditions. Precision may be considered at three levels: repeatability, intermediate precision and reproducibility.
The precision of an analytical procedure is usually expressed as the variance, standard deviation (SD) or coefficient of variation of a series of measurements. Method precision shall be established by determining the assay in six different preparations of a reference solution. Intermediate precision shall be determined by studying the variation in assay of a homogeneous sample analyzed by two different equipment, or analyst or days.
In our study, the intra-day and inter-day precision, which are the most required criteria, had been established by analysing the drug solution in 6 replicate injections on the same day and on three consecutive days, respectively. The value of SD and relative standard deviation (RSD) were calculated.
Limit of detection and limit of quantification
The limit of detection (LOD) of an individual analytical procedure is the lowest amount of analyte in a sample, which can be detected but not necessarily quantified as an exact amount. While the limit of quantification (LOQ) is the minimum level of concentration at which the analyte can be quantified with acceptable precision and accuracy [23].
The LOD and LOQ are expressed from the standard deviation σ of the responses (the intercept) and the slopes of the calibration line [27]. Kumar et al. have also used the same statistics [27]. Some authors have opted to the base line noise for the estimation of these limits [22,28,29].
Optimization of Separation Conditions
Preliminary experiences
The results obtained following the European Pharmacopeia’ System A conditions are insufficient, such as a long run time (30 min) and a poor resolution (Rs<1) with loss of elution time for about 13 min between the THF and toluene peaks (Figure 1), so the method was optimized for the detect and quantification the nine RS with a satisfactory resolution Rs in a short run time using an internal standard.

Figure 1: HF and toluene peaks.
Selection of the column type
In the literature, many stationary phases have been used such as column BP1 (100% dimethylsiloxane) [30], DB-FFAP (polyethylene glycol modified to nitroterephtalic acid) [27], DB-WAXETR (polyethylene glycol) [22]. In our study, after many trials, we have opted for the column DB-624 presenting the same characteristics of that of the European Pharmacopeia, and which is designed specifically for the analysis of RS. This column has contributed to the best separation, with good resolution (Rs>2).
Selection of dissolution solvent
The choice of dissolution solvent should be judicious, because it affects the sensibility, equilibration temperature and time. The dissolution solvent should allow dissolution of many samples; have a high boiling point, and acceptable stability [21]. The most used ones for the GC analysis with headspace injector are water, DMSO, N,N-dimethylformamide, N,N-dimethylacetamide, benzyl alcohol, 1,3-dimethyl-2-imidazolidinone, and mixture of water/N,N-dimethylformamide and water/DMSO [31]. The water is a good solvent for soluble substances, the use of water/N,N-dimethylformamide and water/ DMSO mixture increase the solubility of many drugs, also the partition coefficient of the substances decrease which improve their transfer from liquid to gas phase. However, if the equilibration temperature of the drug is near to the boiling point of the solvent, the pressure in the vial can increase dangerously [21] and if we choose the mixture of water/N,N-dimethylformamide and water/ DMSO, the equilibration temperature by headspace injector should be lower than 100°C, which lead to poor volatilization of solvent having high boiling point. In our study, we have chosen the DMSO due to its polarity and capacity to solubilise many organic compounds, with low toxicity, and the possibility to incubate the vial at high temperature superior to 100°C [32]. Many authors have also used DMSO as dissolution solvent [27-29,32]. Siddiqui et al. have used N,N-dimethylformamide for the development of a method for the control of nine RS in docetaxel [22].
Selection of the internal standard
The internal standard should have a chromatographic behaviour very similar to that of the compound to be assayed, doesn’t interfere with other possibly presented substances, having identical properties regarding the detection system, and available in high purity. We have opted to n-butyl acetate as internal solvent which is from class 3, not much used in the synthesizing process of the active substances. Its use has lead to the correction of the variability caused by the GC method with headspace system. In literature, Teglia et al. have used four internal standards: benzene and trichloroethylene for the quantification of solvents with low limits, hexane and acetone for the quantification of solvents with high limit [32]. Clécio has used the dioxane as internal standard for the analysis of seven RS [28]. However, there are many developed method in literature that have not used an internal standard [22].
Optimization of the carrier gas flow
The decrease of the carrier gas flow from 2.1 ml/min (35 cm/s) to 1 ml/min (19 cm/s) has improved the separation between the nearest peaks.
Optimization of the split ratio
The split ratio was varied in the range between 1/5 and 1/1. By a split ratio 1/1, we have obtained a satisfactory sensibility.
Optimization of the oven temperature program
In order to obtain a short analysis time, we have proceeded to the modification of the oven temperature program. By refereeing to previous studies in literature (Table 2), and after several assays of temperature changing program, we have selected this program: 40°C for 8 min, then raising to 90°C at a rate of 10°C/min, then raising to 240°C at a rate of 40°C/min, keeping this final temperature for 5 min.
| Study | Headspace | Column | Carrier gas | Oven | Injection port | Detector |
|---|---|---|---|---|---|---|
| Kumar et al. [27] | Manual injection | DB-FFAP, 30 m × 0.53 mm, coated with 1.8 μm layer of stationary phase. | Nitrogen | 45°C 5 min, 5°C/min, 85°C, 12°C/min, 220°C | 220°C | FID 260°C |
| Clécio [28] | European Pharmacopeia conditions | ZB-624, 30 m × 0.32 mm | 35°C and à min, 15°C/min, 40°C 10 min, 18°C/min, 235°C 8 min, return to 35°C | - | FID | |
| Siddiqui et al. [22] | Equilibrium temperature 100°C, equilibrium time 20 min, transferring temperature 120°C, pressurizing time 2 min | Polyethylene glycol, DB-WAXETR, 60 m × 0.250 mm; coated with 0.25 μm layer of stationary phase | 40°C 5 min, 10°C/min, 240°C 5 min, return to 40°C | 250°C | FID, 270°C | |
| Sivasaikiran [29] | Equilibrium temperature 40°C, | DB-624, 30 m × 0 53 mm, coated with 3.0 μm layer of stationary phase | Helium | 40°C 6 min, 10°C/min, 130°C 8 min, 35°C/min, 240°C 5 min | 100° | FID 250°C |
| Teglia et al. [32] | Equilibrium temperature 105°C, equilibrium temperature 45 min, injection 2.5 ml of gas phase | DB 624, 30 m × 0.53 mm, coated with 3.00 μm layer of stationary phase. | Nitrogen | 40°C 20 min, 10°C/min, 240°C 20 min | - | FID |
Table 2: Summary of some studies in literature for gas chromatography (GC) conditions.
Selected conditions
From the studies carried out before, we propose the GC method procedure summarized in Table 3.
| Stationary phase | Nature | (6%) polycyanopropyl-phenyl-siloxane (94%) poly-dimethyl-siloxane. |
| Type | 30 m × 0.53 mm wide-bore column coated with 1.8 μm layer of stationary phase. | |
| Carrier gas | Nature | Nitrogen |
| Flow | 1 ml/min | |
| Split ratio | 01:01 | |
| Oven | Temperature | Kept at 40°C for 8 min, then raised to 90°C at a rate of 10°C/min, then raised to 240°C at a rate of 40°C/min. This final temperature was held up to 5 min. |
| Injection port | temperature | 140°C |
| Detector | type | FID |
| temperature | 250°C |
Table 3: GC retained conditions.
The typical chromatogram obtained in the separation of nine RS under the optimized conditions, is presented in Figure 2. Good resolution (Rs>2), symmetric peak shapes for every component and reasonable retention time for all the solvents can be seen.

Figure 2. Separation of nine RS.
Validation Results
Specificity and selectivity
The peaks of n-butyl acetate and DMSO doesn’t interfere with the other peaks (Figure 3), and the Rs is superior to 2 between each nearest peak (Table 4).

Figure 3: Peaks of n-butyl acetate and DMSO.
| Analysed solvent | Retention time | Relative retention time : RRT | Rs (resolution) |
|---|---|---|---|
| RT (min) | |||
| Methanol | 4.28 | 0.27 | |
| Ethanol | 5.7 | 0.37 | 10.89 |
| Acetone | 6.67 | 0.43 | 7.03 |
| Propan-2-ol | 7.05 | 0.45 | 2.69 |
| Acetonitrile | 7.41 | 0.47 | 2.44 |
| Dichloromethane | 7.91 | 0.51 | 3.52 |
| Ethyl acetate | 11.27 | 0.72 | 27.5 |
| THF | 11.67 | 0.75 | 4.02 |
| Toluene | 15.04 | 0.96 | 47.64 |
| n-butyl acetate | 15.61 | 1 | 14.17 |
| DMSO | 16 | 1.02 | 12.85 |
Table 4: Retention time, Relative retention time and resolution of the residual solvents analysed simultaneously.
Linearity
Without the use of the internal standard, the criteria R2>0.999 is not valid for all the analysed RS, although in literature for many studies, R2>0.99 is considered as acceptable [29,32]. After adding of n-butyl acetate, a good linear relationship was obtained for each RS between concentrations and peak area showing well that the method was linear in the range from the reporting level limit of quantification to 120% of the limit value, with a correlation coefficient greater than 0.999. In all cases, the intercepts were considered as negligible by using the student’s t-test (α=0.05).
The statistical results before and after the use of an internal standard are shown in Table 5, showing well the role of an internal standard in improving the method’s linearity.
| Without the use of the internal standard | With the use of the internal standard | |||
|---|---|---|---|---|
| Analysed solvent | Linear regression curve | R2 | Linear regression curve | R2 |
| Methanol | Y=0.0371x-7.3232 | 0.9665 | Y=0.001x-0.107 | 0.999 |
| Ethanol | Y= 0.0529x-08091 | 0.9977 | Y=0.001x-0051 | 0.999 |
| Acetone | Y=0.2196X-27.326 | 0.9953 | Y=0.004x-0.026 | 0.999 |
| Propan-2-ol | Y=0.0661X-9.6613 | 0.9932 | Y= 0.0014x-0.0266 | 0.9994 |
| Acetonitrile | Y=0.0861x-0.2571 | 0.9904 | Y=0.0018-0026 | 0.999 |
| Dichloromethane | Y=0.0529x-0.0306 | 0.9885 | Y=0.0011x-0.0038 | 0.9992 |
| Ethyl acetate | Y=0.161X-17.228 | 0.9946 | Y=0.0033x+0.0766 | 0.9998 |
| THF | Y=0.257x+34.886 | 0.9598 | Y=0.0057x+0.7265 | 0.9998 |
| Toluene | Y=0.3271X+8.6573 | 0.9558 | Y=0.0051x+0.3387 | 0.9995 |
Table 5: Calibration curves of RS.
Limit of detection and quantification
The LOD and LOQ were estimated by using the following formulae: Eq. (A1) and Eq. (A2).
The results are shown in Table 6. The obtained LOQ are widely inferior to the ICH specifications for the analysed RS, so we can conclude that our method enables the quantification of these solvents.
| Solvent | LOD (ppm) | LOQ (ppm) |
|---|---|---|
| Methanol | 76.65 | 232.28 |
| Ethanol | 83.97 | 118.09 |
| Acetone | 59.97 | 181.73 |
| Propan-2-ol | 83.59 | 253.29 |
| Acetonitrile | 9.41 | 28.52 |
| Dichloromethane | 9.58 | 29.02 |
| Ethyl acetate | 65.08 | 197.22 |
| THF | 14.36 | 43.52 |
| Toluene | 19.38 | 58.71 |
LOD: Limit of detection; LOQ: Limit of quantification
Table 6: Limits of detection and quantification in ppm.
 (A1)
(A1)
 (A2)
(A2)
Precision
The data obtained from precision experiments for intra-day precision studies shows that the % SD values are less than 5.0%, mainly after adding the internal standard (Table 7), confirming that the method is sufficiently precise. For the inter-day precision, without adding the internal standard, the method is not precise (RSD>6% for some RS) (Table 8), showing a high variability, but after adding the internal standard, % RSD values are less than 6%, showing well the role of internal standard in the improving of the method’s precision. In literature, the standard deviation of repeatability varies from one study to another.
| Analysed solvent | SD (%) before the use of the internal standard | SD (%) after the use of the internal standard |
|---|---|---|
| Methanol | 2.81 | 3.12 |
| Ethanol | 1.93 | 1.56 |
| Acetone | 1.31 | 1.15 |
| Propan-2-ol | 1.5 | 0.47 |
| Acetonitrile | 3.53 | 4.8 |
| Dichloromethane | 1 | 2.12 |
| Ethyl acetate | 3.66 | 3.52 |
| THF | 1.26 | 0.79 |
| Toluene | 1.47 | 0.29 |
Table 7: Intra-day precision studies.
| Before the use of an internal standard | After the use of an internal standard | |||||||
|---|---|---|---|---|---|---|---|---|
| SD (%) | RSD | SD (%) | RSD (%) | |||||
| Analysed solvent | J1 | J2 | J3 | (%) | J1 | J2 | J3 | |
| Methanol | 2.13 | 2.81 | 1.97 | 11.02 | 2.56 | 3.12 | 1.11 | 5.28 |
| Ethanol | 1.59 | 1.93 | 2.02 | 5.17 | 2.16 | 1.56 | 2.02 | 5.17 |
| Acetone | 0.94 | 1.31 | 0.79 | 5.95 | 1.69 | 1.15 | 1.05 | 4.04 |
| Propan-2-ol | 1.73 | 1.5 | 1.09 | 4.62 | 1.67 | 0.47 | 0.68 | 5.43 |
| Acetonitrile | 3.08 | 3.53 | 1.46 | 6.18 | 4.29 | 4.8 | 1.35 | 4.92 |
| Dichloromethane | 1.12 | 1 | 1.95 | 12.06 | 1.77 | 2.12 | 1.11 | 4.55 |
| Ethyl acetate | 1.33 | 3.66 | 0.76 | 6.83 | 1.3 | 3.52 | 1.1 | 3.34 |
| THF | 1.89 | 1.26 | 1.24 | 17 | 1.89 | 1.26 | 1.24 | 5.44 |
| Toluene | 1.61 | 1.47 | 0.79 | 15.1 | 1.13 | 0.29 | 1.57 | 5.5 |
Table 8: Inter-day precision studies.
Accuracy
Recovery of individual solvents was calculated using the following formula: Eq. (A3).

The accuracy of the method was checked for two active substances nefopam and enoxaparin, which the RS likely to be present are methanol, toluene for nefopam, and methanol, ethanol for enoxaparin.
The mean recoveries (mean ± S.D.) were calculated for each solvent. As shown from data in Tables 9 and 10, we have obtained excellent recoveries between 85% and 115%.
| Concentrations | Recovery study for methanol | Recovery study for toluene | ||
|---|---|---|---|---|
| Recovery % | Mean (%) ± SD | Recovery % | Mean (%) ± SD | |
| 120% | 81.12 | 88.37 ± 7.85 | 93.67 | 97.01 ± 2.93 |
| 87.28 | 98.25 | |||
| 96.7 | 99.12 | |||
| 100% | 99.01 | 102.12 ± 3.98 | 100.02 | 101.36 ± 1.54 |
| 106.6 | 103.04 | |||
| 100.75 | 101.02 | |||
| 80% | 97.09 | 93.82 ± 2.84 | 98.87 | 101.62 ± 2.62 |
| 92.04 | 104.1 | |||
| 92.32 | 101.88 | |||
Table 9: Recovery study of RS in nefopam.
| Concentrations | Recovery study for methanol | Recovery study for ethanol | ||
|---|---|---|---|---|
| Recovery % | Mean (%) ± S.D | Recovery % | Mean (%) ± S.D | |
| 120% | 97.04 | 99.47 ± 2.11 | 92.59 | 91.05 ± 1.40 |
| 100.51 | 89.84 | |||
| 100.85 | 90.73 | |||
| 100% | 106.11 | 108.30 ± 2.29 | 95.06 | 96.79 ± 1.51 |
| 111 | 97.49 | |||
| 107.79 | 97.83 | |||
| 80% | 111.48 | 110.76 ± 2.80 | 101.28 | 100.31 ± 3.00 |
| 107.36 | 96.95 | |||
| 113.45 | 102.71 | |||
Table 10: Recovery study of RS in enoxaparin.
For some authors, range from 90% to 110% or 80% to 120% have been accepted [27,29]. Many authors have opted to the Student test statistics, which tcalculated should be inferior to ttable [28,29].
We can conclude that our method enables quantification of RS limits with satisfactory accuracy.
Application
The developed method was applied to the research and quantification of RS likely to be present in some drug substances.
The analyzed sample of nefopam doesn’t contain any trace of methanol and toluene. The obtainsed chromatogram only shows the internal standard and DMSO peaks.
The chromatogram obtained for enoxaparin sample shows the peaks of methanol and ethanol; which their LOQ are calculated following the formula Eq (A4).
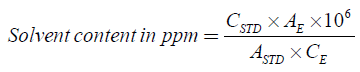
CSTD is the concentration of solvent in the standard solution (mg/ml); CE is the concentration of the active substance in the examined solution (mg/ml); AE is the ratio of the peaks area in the examined solution; ASTD is the ratio of peaks area in the standard solution.
The obtained results for methanol and ethanol levels are respectively 42.35 ppm and 41.92 ppm; which are widely inferior to the amount specified by the ICH guidelines, 3000 ppm and 5000 ppm respectively.
The presence of RS is essential in each step of pharmaceutical process, and since there is no therapeutic benefit, the control and quantification of their limits in active substances and finished products are essential, due to their toxicity, hazardous effects to humans and environment and on the effectiveness, bioavailability, security and stability of pharmaceutical products.
The ICH has adopted Impurities Guidelines for RS. Its objective is to recommend acceptable amounts of RS in pharmaceuticals for the safety of the patient, indicating the use of less toxic solvents and describing levels considered to be toxicologically acceptable.
The European Pharmacopeia has adopted a reference method for the control of RS, enabling only the quantification of class 3 solvents, so it is important to develop other internal methods and validate them before using in routine control.
In our study, we have developed and optimized an analytical method which enables the research and quantification of nine RS levels from class 2 and 3. The preliminary experiences were opted from the European Pharmacopeia, and as the obtained results are insufficient, such as a long run time and a poor resolution, we have proceeded to optimization.
The developed GC method with FID offers simplicity and selectivity, producing symmetric peak shape, good and reasonable retention time for various solvents, as it can be seen from the chromatogram that all the solvents were eluted before seventeen minutes of injection of sample. The method is specific (Rs>2); precise (SD<5% for repeatability, and RSD <6% for intermediate precision); and linear in the range from the reporting level limit of quantification to 120% of the limit value, with a correlation coefficient greater than 0.999. The use of n-butyl acetate as internal solvent, has improved the linearity and precision of the method compensating for the occurring variability.
The developed method was applied to the research and quantification of RS levels in two drug substances nefopam and enoxaparin. The obtained results did not exceed the amount specified by the ICH guidelines. Thus, our method may be applied for the routine quantification of RS levels in different active substances, for pharmaceutical companies and research laboratories.
The authors extend their appreciation to UNIMED Laboratories, Kalaa Kebira, TUNISIA, for supporting this project.
The authors declare that they have no competing interest.