ISSN ONLINE(2319-8753)PRINT(2347-6710)
ISSN ONLINE(2319-8753)PRINT(2347-6710)
Dr.K.Latha, S.Gowri Durga
|
| Related article at Pubmed, Scholar Google |
Visit for more related articles at International Journal of Innovative Research in Science, Engineering and Technology
According to current status Diabetes is the third leading cause of death after cancer and heart diseases. The serious complications of uncontrolled diabetes include kidney damage, eye damage, nerve disease and stroke. Diabetic retinopathy (DR) is a common retinal problem associated with diabetes. This paper focuses on Diabetic Retinopathy and finds the exudates parts in the eye by implementing Neuro Fuzzy based on feature extraction. It can also be helpful in improving the performance by accuracy, sensitivity and specificity for detecting the Diabetic Retinopathy when compare to other traditional methods.
Index Terms |
| Diabetic Retinopathy, Eye Damage, Exudates, Feature Extraction. |
I.INTRODUCTION |
| Nowadays Diabetes is the one of the leading disease, it affects about 2-3% of general population. Diabetes is a disease in which the level of glucose is above normal. It creates several problems in our body such as eye damage, kidney damage, stroke etc. |
| Diabetic retinopathy is an eye disease that is detected in patients with long time diabetes. It shows its emergence in the retina through swelling, leaks or abnormal growth of blood vessels, resulting in severe vision loss or blindness. |
| It mainly affects the retina at the back end of the eye. It leads to blindness in ages between 20 and 60. Based on the presence of features like micro aneurysms, haemorrhages, hard exudates, cotton wool spots, it can be classified into NPDR (Non Proliferative Diabetic Retinopathy) and PDR (Proliferative Diabetic Retinopathy). NPDR is also known as Background Diabetic Retinopathy. It causes server blockages and leakage. In this stage, the vision of the patient is very rarely affected and most people are unaware of this condition. In PDR, the large blood vessels in the eyes are blocked, and then the body compensates the problem by trying to produce new vessels, which are weak and grow in the wrong locations which are unable to restore proper vision function.Exudates are caused by the breakdown of retina barrier and allowing leakage of proteins, lipids. It is like a spot, yellow in color and granular in appearance. Exudates are broadly classified into two types. One is hard exudates caused by severe leakage in blood vessels. Another type is soft exudates. It is also called cotton wool spots. It like a spot, yellowish-white in colour. This type mainly damages the nerve fibers in retina. |
| Opthalmoscopy, angiography, colour fundus instant photographs or real-time electronic imaging are the methods used to detect the diabetic retinopathy. Retinal photographs are widely used to diagnosis the eye related diseases. It is also the main source for screening the diabetic retinopathy. |
| Many investigations were carried out in diagnosing the Diabetic Retinopathy. Many screening and evaluation procedures have been facilitated due to the growth of number of diabetic patients. |
| Manual detection of exudates has to spend a great deal of time in the analysis and diagnosis of retinal photographs. Automated screening techniques for exudates detection have great significance in saving cost and time. |
II. RELATED WORK |
| Osareh et al., (2002) investigated three different approaches are template matching, least squares regression arc estimation and snakes. First technique provided the approximate location of the optic centre. The second method was used to estimate the optic as a circle. The snake technique was developed to produce a more accurate boundary. These methods show the specificity 71.4% and 90.1% of accuracy by using Fuzzy C-means clustering. |
| The three class diagnoses was developed by Lee et al, in this method the performance was measured by neural networks with normal 82.6%, NPDR 82.6% and 88.3% of PDR by using haemorrhages, micro aneurysms, hard exudates and cotton wool spots features.Nicolai et al (2003) reported that 90% of diabetic retinopathy (DR) performance was measured with feature of micro aneurysms and haemorrhages by using automated lesion detection algorithm. Neuberger et al studied that retinal thickness using retinal thickness analyser and shows the sensitivity to about 93% and 83% for normal.Sinthanayothin et al., (2003) studied that hard exudates, haemorrhages and micro aneurysms using Neural Network classifier. He used a recursive region growing procedure the separate both vessels and red lesions in a fundus image and shows sensitivity of 80.21%.Based on the clinical usage, there are two modes investigated, they are fundus photography mode and optic disk. The diagnosis of glaucoma is done by optic disk which is highly reproductive and Retinal Thickness Analyzer (RTA) is suitable for diabetic retinopathy detection. |
| Kahai et al reported that 70.66% of sensitivity and 100% of specificity by using Bayesian learning classifier. Larsen et al (2003) stated that about specificity 46.3% and sensitivity 96.7% was measured for red lesions using automated DR red lesion detection algorithm. Performance was measured by neural networks with specificity 67% and sensitivity 95.1% using haemorrhages, micro aneurysms, hard exudates and cotton wool spots features by usher et al (2004). |
| Cree (2005) et al stated that about 70% of mean accuracy was measured for blood vessels in the vicinity of the optic disk using the rules of bayes. The digital fundus photography is used to visualize the human blood vessels, which are being affected by diabetes. The blood vessels in retinal images could be detected and defined using wavelets methods. The vessels detection methods are tested using 20 retinal images and gold standard images, which comprises of definite blood vessels. Free Response Operator Characteristic (FROC) is used to evaluate the efficiency of vessels. Here, Morlet wavelet is used to detect the blood vessels because it is directional and it is also capable of fine tuning of their frequencies. It is especially used to filter the background noise. It is more advantageous when compared to Gaussian and its derivatives. |
| Performance was measured by k-Nearest neighbour classifier with sensitivity 100% and 87% for specificity using vasculature and red lesions features by Niemeijer et al (2005). Nayak et al reported that hard exudates, blood vessels and contrast using neural networks and performance was measured for sensitivity 90%,Specificity 100% and with mean accuracy 93%. |
| In four class diagnosis method, yun et al (2008) used image processing techniques to extract blood vessels perimeter from normal, moderate NPDR, severe NPDR and PDR. These extracted features were fed to neural network classification and obtained an average accuracy of 84%, sensitivity and specificity of 90% and 100% respectively. |
| In five class diagnosis method, acharya et al (2008) have been classified into normal, mild DR, moderate DR, severe DR and PDR stages using bispectral invariant features of higher-order spectra techniques and an SVM classifier. They reported an average of 82%, sensitivity of 82% and specificity of 88%.Automatically identified normal, mild DR, moderate DR, severe DR and PDR stages using the blood vessels, exudates, micro aneurysms and haemorrhage features and SVM classifier, their proposed system demonstrated a classification accuracy of 85%, sensitivity of 82% and specificity of 86%. |
| Archarya et al (2009) reported that sensitivity 82%, specificity 86% and accuracy 85.9% performance was measured with features of blood vessels, exudates, micro aneurysms and haemorrhages by using support vector machine.K.H. Englmeler et al (2004), the vessel tracker algorithm was developed to determine the retinal vascular network on the retinal image. These algorithms were developed to detect the OD, cotton wool spots and haemorrhages. It’s only able to identify arteries and veins with accuracy of 78.4% and 66.5% correctly. |
| A computer system was developed using image processing and pattern recognition techniques to detect lesions of DR. Their system was able to diagnosis the DR with accuracy of more than 90%. |
III. PROPOSED WORK |
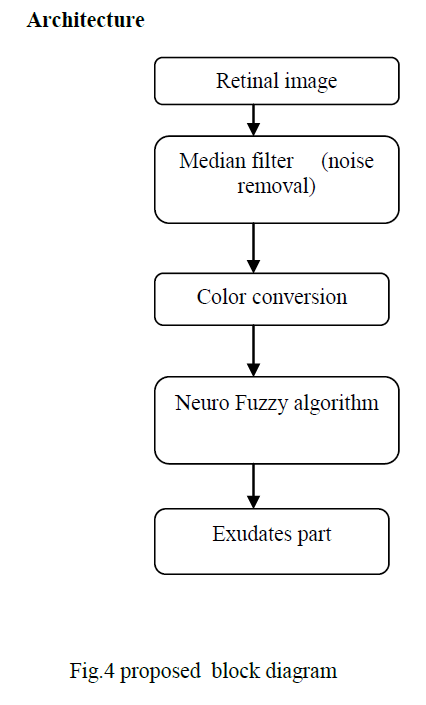
| This system focuses on Diabetic Retinopathy and finds the exudates parts in the eye by implementing Neuro Fuzzy based on feature extraction. In first step we reduce the noise by using median filter. The median filter is normally used to reduce noise in an image. The median filter considers each pixel in the image intern and looks at its nearby neighbours to decide whether or not it is representative of its surroundings. Instead of simply replacing the pixel value with the mean of neighboring pixel values, it replaces it with the median of those values. The median is calculated by first sorting all the pixel values from the surrounding neighborhood into numerical order and then replacing the pixel being considered with the middle pixel value. The result of the median filter is processed by color conversion method and its result is applied to Neuro Fuzzy algorithm for finding the ratio of the disease. |
| Neuro fuzzy This system uses a learning algorithm which is originally derived from neural network theory to establish its parameters (fuzzy sets and fuzzy rules) by processing data samples. |
| The system focuses on 3-layer feed forward neural network which represents input variables, fuzzy rules output variables respectively. Fuzzy sets are commonly fixed as connection weights. It is not necessary for representing a fuzzy system to apply a learning algorithm to it. Moreover, it is fit, for the reason that it represents the data flow of input processing and learning within the model. |
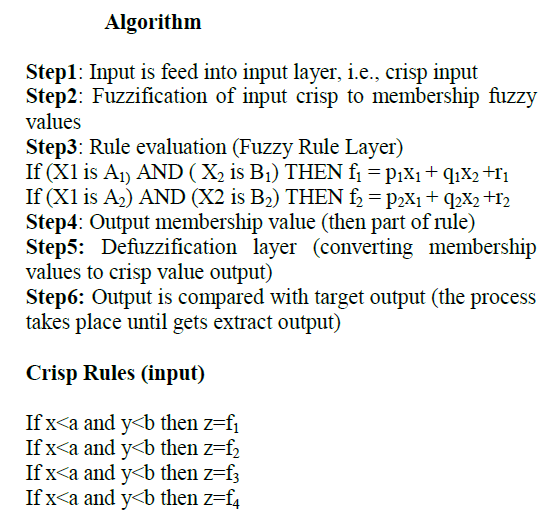 |
| Weight is adjusted till there is equal to target output. Reduction of rules takes place, NN is used to select the higher rule and fuzzy is used for prove that the rule is high in strength The exudates part is obtained from the result of neuro-fuzzy algorithm. |
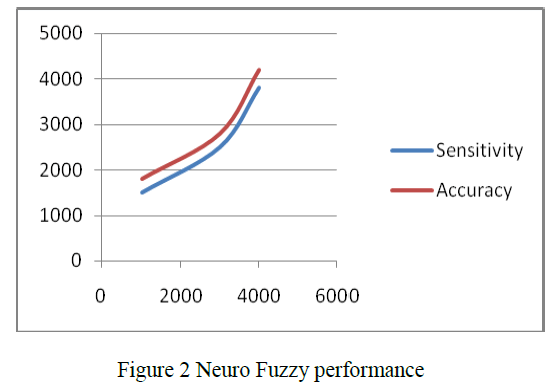
| A major advantage of our algorithm is which implies greater accuracy of exudates detection. |
 |
Classifier Performance Evaluation Criteria |
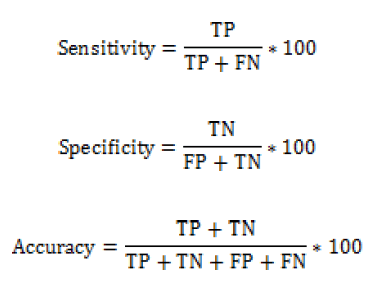
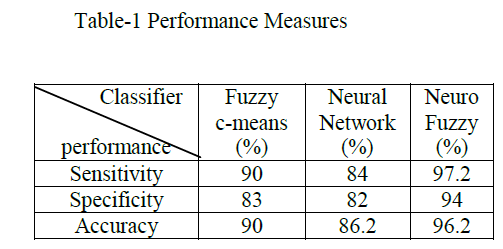
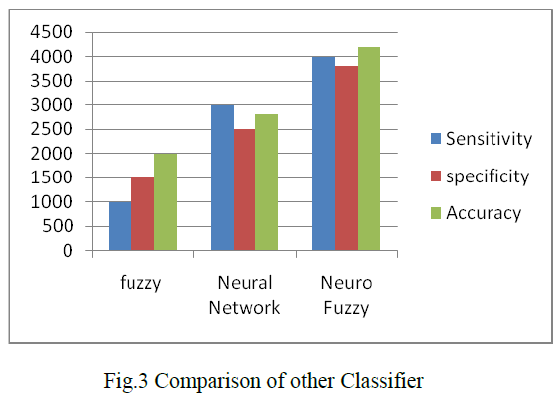
| In order to evaluate the performance of our detection algorithm, there are three statistical criteria which are related to the sensitivity, specificity, and accuracy of the algorithm. The expressions for these criteria are given as follows: |
 |
 |
 |
 |
IV. CONCLUSION |
| This study indicates that automated evaluation of digital retinal images could be used to screen for diabetic retinopathy. The significant contributions of this work are: 1) using median filter to reduce the irregular edges or smoothing the edges. 2) Obtain color conversion of the given input image and 3) applying Neuro Fuzzy algorithm for finding the ratio of the disease. A major advantage of our algorithm is which implies greater accuracy of exudates detection. |
References |
|