ISSN ONLINE(2319-8753)PRINT(2347-6710)
ISSN ONLINE(2319-8753)PRINT(2347-6710)
Elsayed A. Elsherpieny1, Sahar A. N. Ibrahim2, Noha U. M. M. Radwan3
|
| Related article at Pubmed, Scholar Google |
Visit for more related articles at International Journal of Innovative Research in Science, Engineering and Technology
Weibull and log-logistic distributions are two popular distributions for analyzing lifetime data. In this paper it is assumed that the data are coming either from Weibull or log-logistic distributions. The maximized likelihood ratio test to discriminate between the two distributions is used. The asymptotic distributions of the logarithm of the ratio of the maximized likelihood are obtained. These asymptotic results are used to estimate the probability of correct selection and the minimum sample size needed to discriminate between the two distributions. Two real data life are analyzed to see how the proposed method works in practice.
Keywords |
| Asymptotic distribution; Weibull distribution; Log-logistic distribution; Maximized likelihood ratio statistic; Probability of correct selection. |
INTRODUCTION |
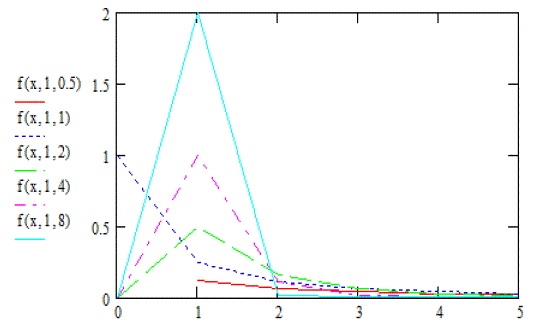
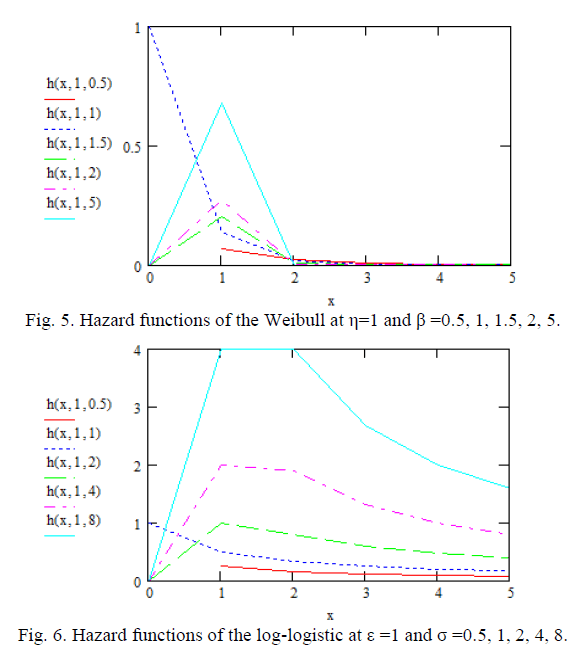
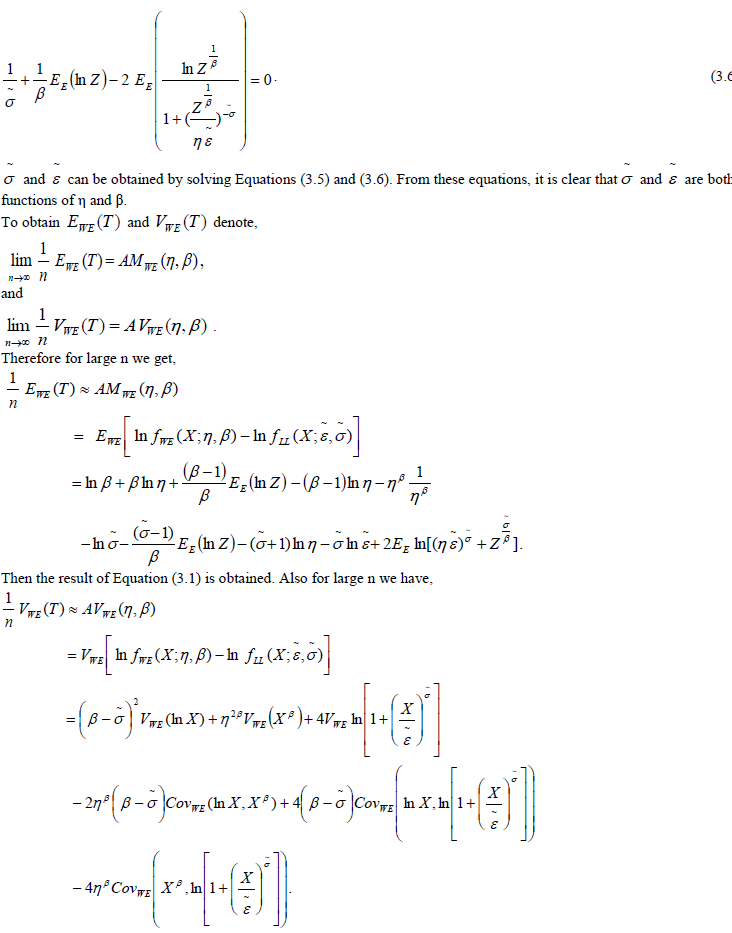
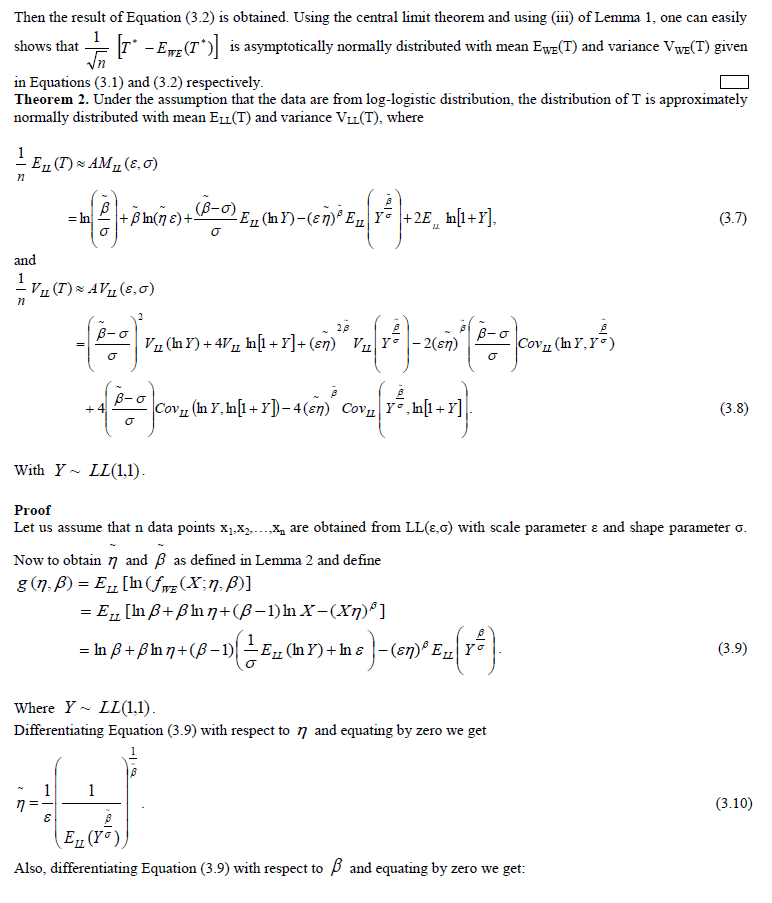
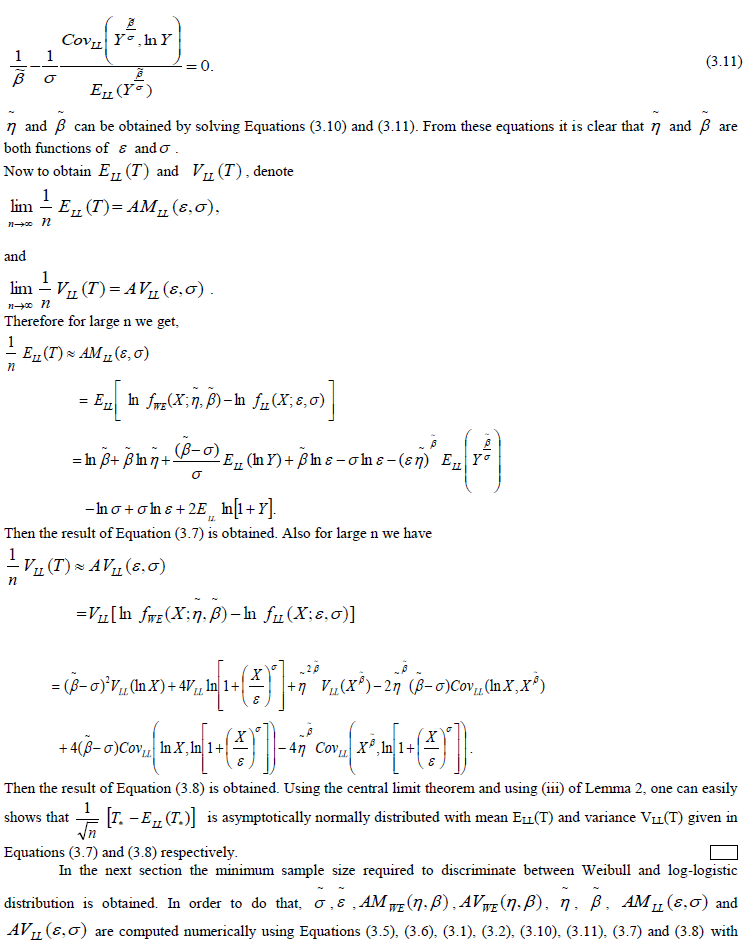
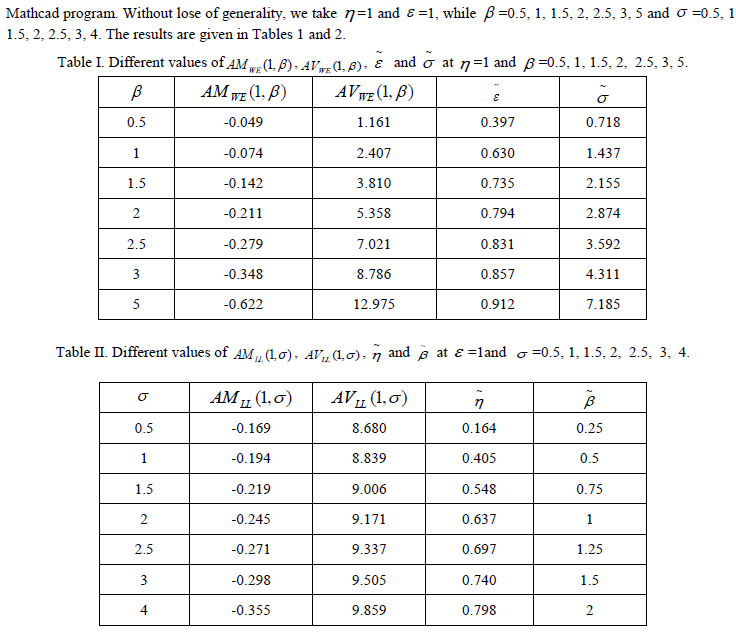
| Choosing the correct or best-fitting distribution for a given data set is an important issue. Most of the times distribution functions may provide a similar data fit but selecting the correct or more nearly correct model is desirable. The problem of choosing the correct model has been attempted by many researchers. Cox (1961) discussed the effect of choosing the wrong model. Cox (1962) tackled the problem of discriminating between the log-normal and the exponential distributions, based on the likelihood function, and derived the asymptotic distribution of the likelihood ratio statistic. Jackson (1968) derived asymptotic results for the case log-normal versus gamma. The case log-normal versus Weibull was addressed by Dumonceaux and Antle (1973). They proposed a certain test and provided its critical values. Pereira (1977) developed another two tests to discriminate between log-normal and Weibull distributions. Bain and Engelhardt (1980) covered the case Weibull versus gamma. Chen (1980) made significant contribution in discrimination problem when using small sample size. Kappenman (1982) studied the probability of correct selection for the pairs Weibull versus log-normal, Weibull versus gamma, and gamma versus log-normal. Firth (1988) discussed the problem of discriminating between the log-normal and gamma distributions. Fearn and Nebenzahl (1991) used the maximum likelihood ratio method in discriminating between the Weibull and gamma distributions. Wiens (1999) discussed the effect of choosing the wrong model through a real data example and by using log-normal and gamma models. Gupta and Kundu (2003) considered the likelihood ratio statistic for discriminating between Weibull and generalized exponential distributions. Gupta and Kundu (2004) discussed the problem of discriminating between the gamma and generalized exponential distributions by using maximized likelihood ratio test. Pascual (2005) discussed the effect of misspecification on the maximum likelihood estimates when discriminating between the log-normal and gamma distribution functions. Kundu and Manglick (2005) used the ratio of the maximized likelihoods in discriminating between log-normal and gamma distributions. Dey and Kundu (2009) considered the problem of discrimination among Weibull, log-normal and generalized exponential distributions. They used the maximized likelihood test to choose the best fitted model. Dey and Kundu (2010) used the maximized likelihood ratio test in the discrimination problem between log-normal and log-logistic distributions. Some procedures for selecting between distributrions for data of not only complete but also censored have been paid attention by some authors. Siswadi and Quesenberry (1982), when selecting among Weibull, log-normal and gamma distributions, compared the scale invariant, scale shape invariant and maximized likelihood function tests for complete data and scale invariant and maximized likelihood function tests for Type-I censored data. Kim and Yum (2008) compared the ratio of maximized likelihoods and scale invariant tests for discriminating between the Weibull and lognormal distributions for complete, Type-Ι and Type–II censored data. Dey and Kundu (2012) considered the maximized likelihood ratio test in choosing between Weibull and log-normal distributions for type-II censored data. Weibull and log-logistic distributions are two popular distributions for analyzing lifetime data. In this paper, the problem of discriminating between these two distribution functions is considered. A hypothesis testing method is used in which it is assumed that a data are coming either from Weibull or log-logistic distribution. The ratio of the maximized likelihood test is used to discriminate between them. The asymptotic distributions of the logarithm of the ratio of the maximized likelihood are obtained through two theorems. These asymptotic results are used to estimate the probability of correct selection, from which the minimum sample size needed to discriminate between the two distribution functions for a user specified probability of correct selection is obtained. Two real data life are analyzed to see how the proposed method works in practice. Figures 1 and 3 show the diverse shape of the probability density function (p.d.f.) and cumulative distribution function (c.d.f.) respectively, of Weibull distribution at η=1 and β = 0.5, 1, 1.5, 2, 5. While Figures 2 and 4 show that of loglogistic distribution at ε =1 and σ = 0.5, 1, 2, 4, 8. From these figures, the closeness of the two p.d.f. and c.d.f. functions can be easily visualized. However some of the characteristics of Weibull and log-logistic distributions can be quite different. This can be shown when considering their hazard functions, given in Figures 5 and 6 respectively. Therefore, if the data are coming from any one of them, may be it is modeled by the other one. In addition if the sample size is not very large the problem of choosing the correct distribution becomes more difficult, but it is still very important to make the best decision based on the data at hand. The rest of the paper is organized as follows. In Section 2, the test statistic is presented. In Section 3, the asymptotic distributions of the test statistic under null hypotheses is obtained. The minimum sample size needed to discriminate between Weibull and log-logistic distributions at a user specified protection level and tolerance level is determined In Section 4. Two real life data sets are analyzed in Section 5. Finally a conclusion is given in Section 6. |
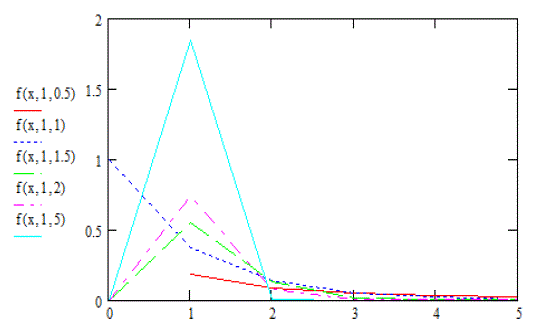 |
| Fig. 1. Density functions of the Weibull distribution at η=1 and β = 0.5, 1, 1.5, 2, 5 |
 |
 |
II. THE TEST STATISTIC |
 |
 |
 |
 |
 |
 |
 |
 |
IV. DETERMINATION OF SAMPLE SIZE |
In this section, a method to determine the minimum sample size needed to discriminate between Weibull and loglogistic distributions is proposed. The same arguments as that given in Gupta and Kundu (2003) are followed. It is known that if two distribution functions are very close, one needs a very large sample size to discriminate between them. While, if they are quite different, then one may not need very large sample size to discriminate between them. Also from a practical point of view, one may not need to differentiate between two so closed distribution functions. Therefore, it is expected that the user will specify before hand the minimum distance D* that he does not want to make the discrimination between two distribution functions if their distance is less than it. This minimum distance is called tolerance limit. Here the Kolmogrov-Smirnov (K-S) distance is used to measure the closeness between the Weibull and log-logistic distributions. Where, the Kolmogrov-Smirnov (K–S) distance between two distribution functions, say F(x) and G(x) is defined as supF(x) G(x) . x ïÃâ¬Ã Also it is expected that the user will specify beforehand the probability of correct selection (PCS) to achieve a certain protection level P*. With the help of K–S distance and PCS the required sample size n is obtained as follows. Considering Case 1 where it is assumed that the data are coming from WE(η,β), 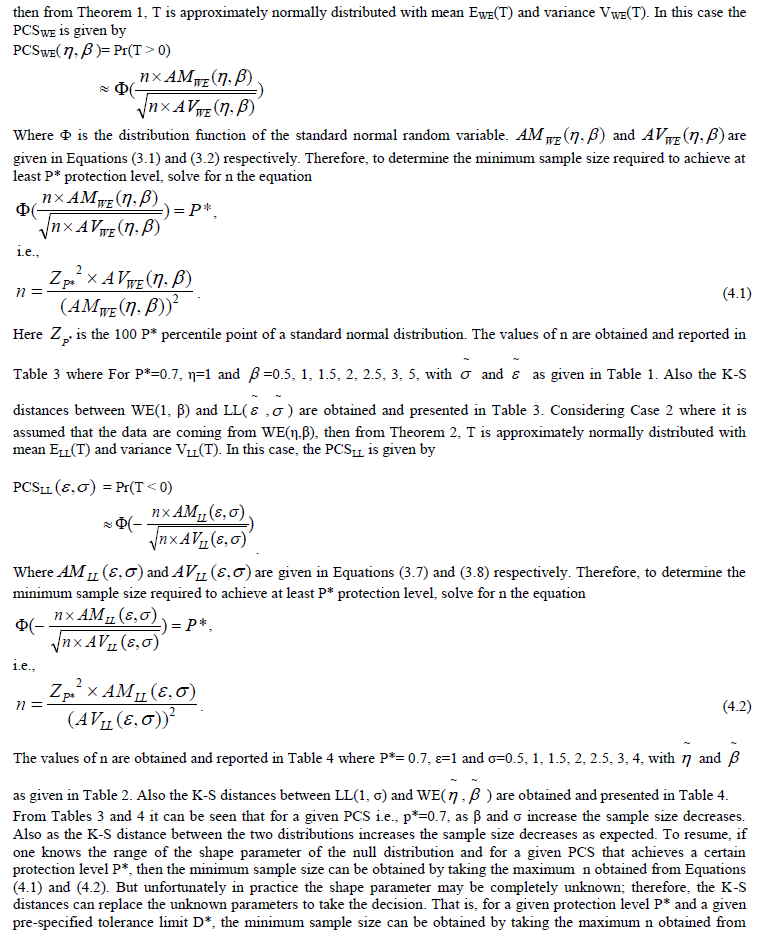 |
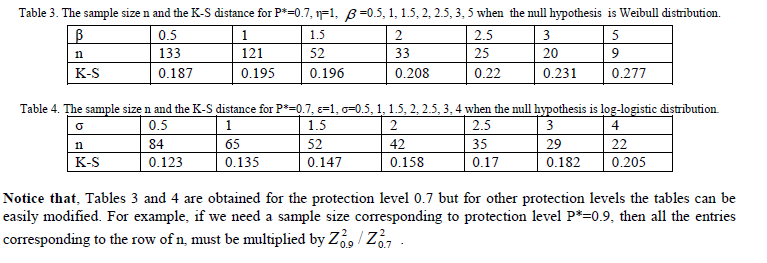 |
| Equations (4.1), (4.2). For example, suppose that for a given P*= 0.7 and for β= 0.5 and σ= 0.5, then from Tables 3 and 4 the minimum sample size required to discriminate between Weibull and log-logistic distributions is max(133, 84) =133. On the other hand if β and σ are unknown and suppose that the practitioner wants to discriminate between a Weibull and a log-logistic distribution functions only when the distance between them is greater than or equal to 0.180, i.e., D* ≥ 0.180 and with P* = 0.7. Then from Tables 3 and 4, it is clear that, D* ≥ 0.180 if β ≥ 0.5 and σ ≥ 3. Also, when the null distribution is Weibull, then for the tolerance limit D* ≥ 0.180, one needs n=133 to meet the PCS, P*= 0.7. Similarly when the null distribution is log-logistic then one needs n=29 to meet the same protection level. Finally, the minimum sample size required to discriminate between Weibull and log-logistic distributions with P*= 0.7 and D* ≥ 0.180 is max(133, 29) = 133. |
V. DATA ANALYSIS |
| For illustrative purposes, two real data sets to discriminate between the Weibull and log-logistic distribution functions are analyzed. Data Set 1: The first data set (Gupta and kundu(2003)) represent the failure times of 30 air conditions of an airplane (in hours): 23, 261, 87, 7, 120, 14, 62, 47, 225,71, 246, 21, 42, 20, 5, 12, 120, 11, 3, 14, 71, 11, 14, 11, 16, 90, 1, 16, 52, 95. When the Weibull distribution is used, the MLEs of the different parameters are: =0.01827 and = 0.85494. Also ln[LWE( )] = -152.0068. Similarly when the log-logistic distribution is used, the MLEs of the different parameters are: =1.2015 and =26.61693. Also ln[LLL( , )]= -152.34578. Consequently T= 0.3389. Therefore, by using the maximum likelihood ratio test to discriminate between Weibull and log-logistic distributions, the Weibull model is chosen for this data set. Data Set 2: The second data set (Gupta and kundu (2003)) represent the number of million revolutions before failure for each of 23 ball bearings in the life test and they are: 17.88, 28.92, 33.00, 41.52, 42.12, 45.60, 48.80, 51.84, 51.96, 54.12, 55.56, 67.80, 68.44, 68.64, 68.88, 84.12, 93.12, 98.64, 105.12, 105.84, 127.92, 128.04, 173.40. When the Weibull model is used, the MLEs of and are: = 0.01217 and = 2.10490. Also ln[LWE( )]= -113.67899. Similarly, if the log-logistic model is used, the MLEs of ε and σ parameters are: =0.30078 and =64.00749 Also ln[LLL ( , ) ]= -113.36619. Consequently T= -0.3128. Therefore, by using the maximum likelihood ratio test to discriminate between Weibull and log-logistic distributions, the log-logistic model is chosen for |
VI. CONCLUSION |
| In this paper we consider the problem of discriminating between Weibull and log-logistic distribution functions. It is assumed that a data are coming either from Weibull or log-logistic distribution. The maximized likelihood ratio test to discriminate between them is used. The asymptotic distributions of the logarithm of the ratio of the maximized likelihood are obtained. These asymptotic results are used to estimate the probability of correct selection. The minimum sample size needed to discriminate between the two distribution functions for a user specified probability of correct selection and a tolerance limit based on the distance between the two distributions is calculated. Two real data life are analyzed to see how the proposed method works in practice. |
References |
|