International Journal of Innovative Research in Science, Engineering and Technology
ISSN ONLINE(2319-8753)PRINT(2347-6710)
ISSN ONLINE(2319-8753)PRINT(2347-6710)
S. Elancheliyan 1, Dr J. Krishnakumar2
|
| Related article at Pubmed, Scholar Google |
Visit for more related articles at International Journal of Innovative Research in Science, Engineering and Technology
Generator sets for power system is one among the important equipment used in the construction industries, used in large numbers and as clusters and also located very near to the work area. The noise levels produced by these generators are much higher than the permissible limit. In the first step of this paper assesses the potential noise emissions associated with two unclosed caterpillar power generators used in a construction site. In the second step combined noise effects of generators and other activities are studied over a 12-hour period to establish background environmental noise levels. The study shows large number of construction workers working nearby generators are exposed to 100 dB (A) or more noise. The chain of noise control at the source- along the noise path or at the receiver and what effective steps could be done to mitigate the noise exposure at each stage is considered.
Keywords |
| Construction Workers, Decibel, Noise Exposure, Power Generators, Noise Effects, Noise Mitigation |
INTRODUCTION |
| Noise: "any loud, discordant or disagreeable sound." Noise intensity is measured in decibel units [1], [2]. The decibel scale is logarithmic; each 10-decibel increase represents a tenfold increase in noise intensity [6]. Human perception of loudness also conforms to a logarithmic scale; a 10-decibel increase is perceived as roughly a doubling of loudness. Thus, 30 decibels is 10 times more intense than 20 decibels and sounds twice as loud. OSHA health and Safety regulations [17] provide the maximum permissible noise exposure limit; it should not exceed 90 dBA. Any noise greater than 90 dBA can cause hearing loss, lack of sleep, irritability, heartburn, indigestion, ulcers, high blood pressure, and possibly heart disease [3], [4]. Prolonged or frequent exposure to noise tends to make the physiological disturbances chronic. In addition, noise-induced stress creates severe tension in daily living and contributes to mental illness. |
| A. Studies on Noise Exposure in Construction Workers |
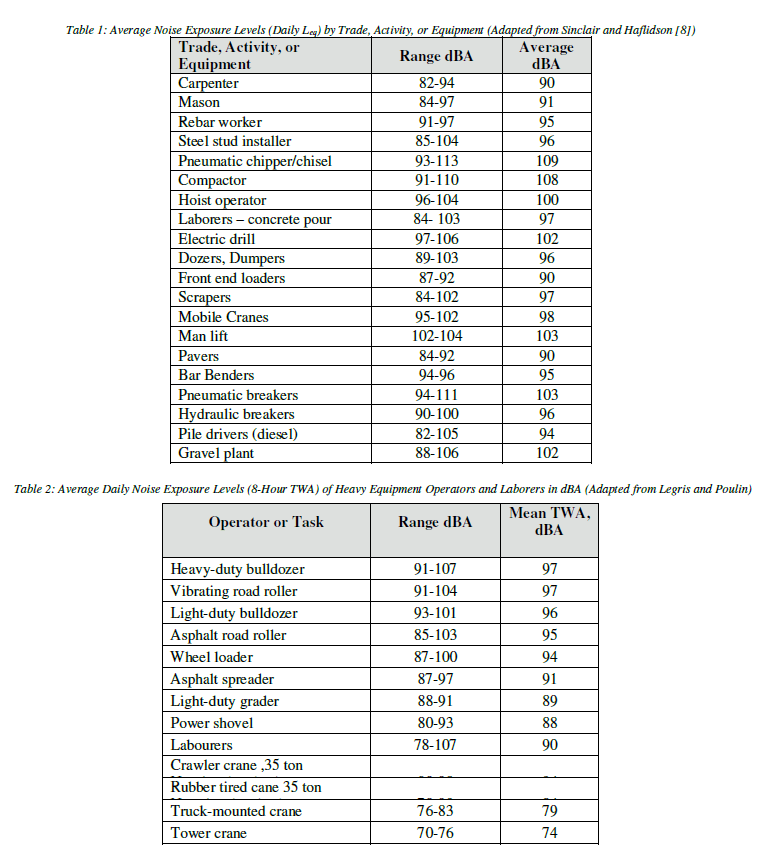
| Recent studies have supplemented the earlier ones with noise dosimetry, providing a more precise and comprehensive picture of construction workers' exposures. [Table 1], containing information from Sinclair and Haflidson [8], shows average daily noise exposures of construction workers by type of construction. The authors obtained samples in 27 construction projects; they measured according to the proposed Ontario Noise Regulation, which specifies a 3-dB exchange rate [10]. TWA sound levels using the 3-dB exchange rate are sometimes referred to as ‘‘equivalent continuous sound levels'' or Leq. Based on sampled workers, the average noise exposure level was approximately 99 dBA. |
| In another Canadian study, Legris and Poulin [11] reported on the noise exposure of heavy equipment operators and laborers. The data were collected and normalized to an 8-hour shift with a 5-dB exchange rate. [Table 2] gives 8-hour average noise exposure levels for heavy equipment operators and laborers according to Legris and Poulin. The authors explained the variations in exposures by such factors as the location and type of muffler, amount of time the equipment was idling or under load, the power rating of the engine, and the nature of the task. Of particular importance was the presence or absence of an insulated cab and the design of the equipment. Note the 10-dB difference between insulated and non-insulated cabs and the 13-dB difference between crawler and rubber-tired cranes weighing more than 35 tons with non-insulated cabs. |
| Several factors make it difficult to draw comparisons between these kinds of studies. First, the exchange rate has an effect, with the 3-dB exchange rate almost always producing higher exposure levels than the 5-dB exchange rate. Second, the length of the work shift, of course, increases the exposure level; and third, the amount of time each worker spends on each piece of equipment also has an effect. |
 |
| B. Noise By Power Generators |
| Power Generators are essential in construction sites where electricity is not supplied, used to power electric equipments, welding machines, for general and task lighting. The workers involved in various works has exposed to various levels of noise by the machinery which they works [10]. In construction industry all the required electricity is supplied by the power generators, which also producing huge noise, the workers ultimately exposed to double effect. The usual sound sources of an electrical power generator are fan, bearing and sound radiation from the surface. In an electric generator the magnetic field produces the circumferential forces required for the energy transfer. In addition, the field creates radial forces, these forces interact with stator is in contact with the frame, which also is excited. The vibration of the frame accelerates the surrounding air, which is heard as noise [11]. |
| Engine noise – This is mainly caused by mechanical and combustion forces and typically ranges from100 dB(A) to 121 dB(A), measured at one meter, depending on the size of the engine. |
| Cooling fan noise – This results from the sound of air being moved at high speed across the engine and through the radiator. Its level ranges from 100 dB(A) to 105 (A) dB at one meter. |
| Alternator noise – This is caused by cooling air and brush friction and ranges from approximately 80 dB(A) to 90 dB(A) at one meter. |
| Induction noise – This is caused by fluctuations in current in the alternator windings that give rise to mechanical noise that ranges from 80 dB(A) to 90 dB(A) at one meter. |
| Engine exhaust – Without an exhaust silencer, this ranges from 120 dB(A) to 130 dB(A) or more and is usually reduced by a minimum of 15 dB(A) with a standard silencer. |
| Structural/mechanical noise – This is caused by mechanical vibration of various structural parts and components that is radiated as sound. |
NOISE EXPOSURE LEVEL |
| A. Noise Permissible Exposure Limits |
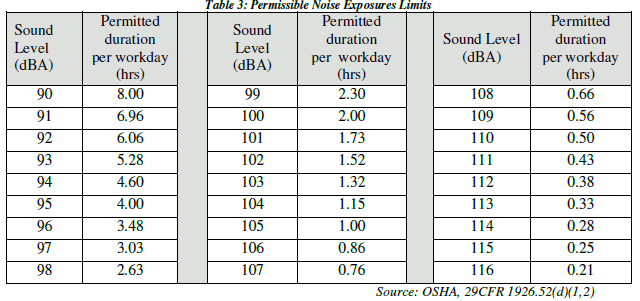
| The OSHA, 29 CFR 1926.52 and 1926.101 gives the permissible exposure limits (PEL) and requirements for an 8- hour time-weighted average exposure level (TWA) of 90 dBA with a 5-dB exchange rate between allowable duration and noise level. When the daily noise exposure is composed of two or more periods of noise exposure of different levels [5], their combined effect should be considered, rather than the individual effect of each. The permissible noise exposure levels with time [16] are given in [Table 3]. |
 |
| B. Equivalent Noise Exposure Factor |
| Noise levels are expressed in terms of the energy-equivalent continuous noise level, Leq, which normalizes the Leq to an 8 hour day. This could only be accomplished given a worker’s pattern of exposure to noise; workers switch to different jobs/tools/sites, and their shift length is variable and seasonal. Exposure to different levels for various periods of time shall be computed according to the formula [16]. |
| Leq = (T1 / L1) + (T2 / L2) + ............ + (Tn / Ln) |
| where: |
| Leq = The equivalent noise exposure factor. |
| T = The actual time of noise exposure by person at a constant noise level. |
| L = The duration of the permissible noise exposure at the constant level (from Table 1). |
| If the value of Leq exceeds unity (1) the exposure exceeds permissible levels. |
STUDY WORK |
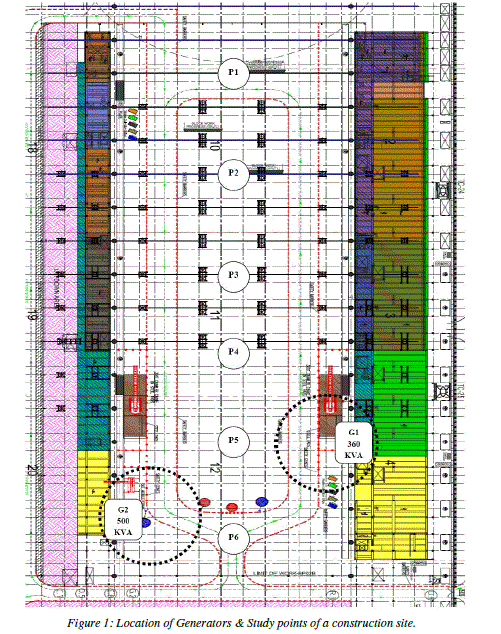
| The study area spread over 140 meter length and 90 meter breadth gives 12600 m2 area. In the first step environmental noise measurements were made for two individual generators at locations G1 & G2 which was shown in igure . t the time the noise measurement equipment was set up the sky was clear temperatures were in the mid and the wind speed was light and variable. But actually the noise environment fluctuated greatly from hour to hour and location to location, depending on work activity within the study area. So in second step another measurement was made at six locations during a normal working day over a period of 12 hours, which indicates that the working area is typically noisy throughout a normal working day. |
 |
| A. Noise Effects of Individual onsite Generators |
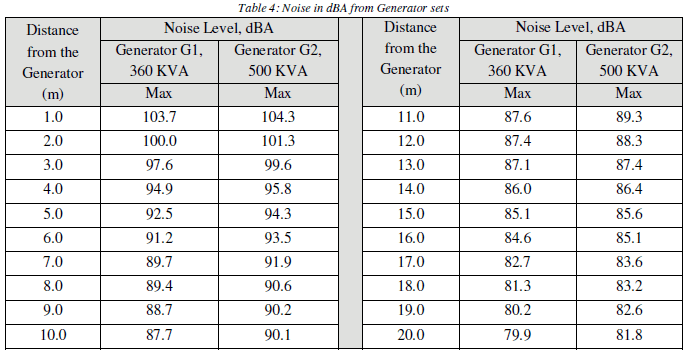
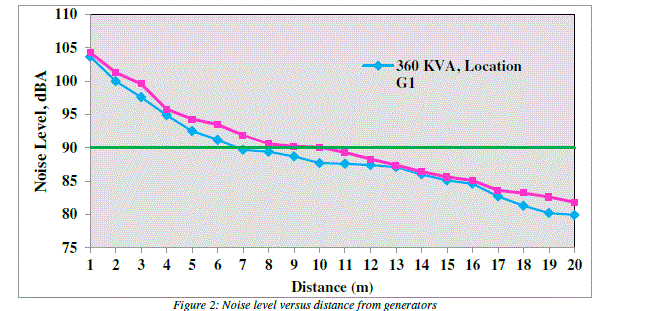
| The environmental noise readings were taken from two standard caterpillar diesel generators, one generator (G1) with 365KVA, 1500 rpm and 220V output and the other (G2) with 500KVA, 1500 rpm and 220V output. These two generators are not covered or provided with any acoustic shield; hence the entire noise generated will be transmitted to the environment. All other activities in this area were stopped in order to eliminate the noise effect of other work activities. The noise level was observed on 21-04-2013 in a calibrated standard digital sound level meter with RS232 and noted from various distances. [Table 4] presents the summary of noise levels measured at various distances from the source of noise, i.e. generators. |
 |
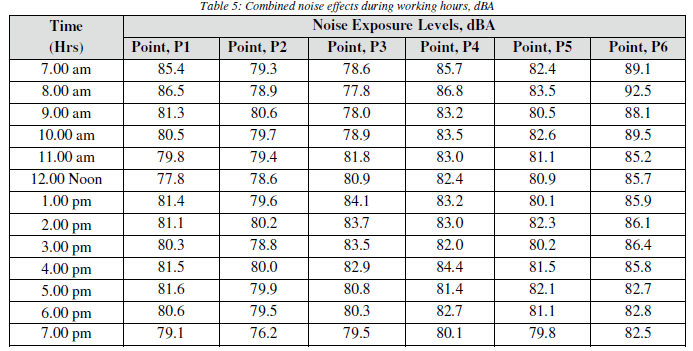
| B. Combined Noise Effects of Generators And Other Activities |
| Noise exposure levels of construction workers are difficult to determine due to the day to-day variation in occupation and shift length of each worker and the itinerant and seasonal nature of the job. Another set of readings were taken to study combined noise effects of generator and other activities. Six locations (Points P1 to P6) were identified or selected to cover the entire construction area and the study locations were marked in [Figure 1].The readings were taken on 25-04-2013 for every one hour for a period of 12 hours (7 am to 7 pm). The measured values were tabulated in [Table 5]. |
 |
RESULT AND DISCUSSION |
| A. Sound Pressure Level from Generators Vs Distance |
| Based on the noise level observed from the generators, the noise level was higher than the OSHA, 29 CFR 1926.52 permissible level of 90 dBA. At 1.0 m from the generator; the values noted are 103.7 dBA and 104.4 dBA for G1 and G2 respectively. These values decreases with increase in distance and it reaches the permissible level of 90 dBA at 7.0m for G1 and 10.5m for G2 generator. Even though the permissible level is 90 dBA; hearing damage begins at a much lower level, about 85 decibels. This value is observed at 15m and 16m for G1 and G2 generators respectively. The relationship between the measured noise level and distance from generators were given in [Figure 2]. |
 |
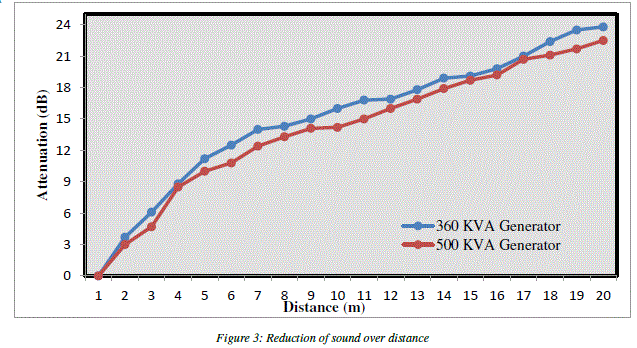
| The attenuation of sound pressure with respect to distance was shown in [Figure 3]. When there were no reflecting walls to magnify the noise produced by the generator set, the noise level will decrease by approximately 3 dB(A) every time the distance is doubled. If the property line is within the near field of a generator set, however, the noise level may not be predictable. |
 |
| B. Analysis of Combined Noise Exposure Effect |
| Figure.4 presents a graphical analysis of combined noise effects and it shows the noise levels are greater than 90 dBA at locations closer to the generators. But the value decreases with locations away from the generators. The maximum noise emission noted was 92.5 dBA at point P6. |
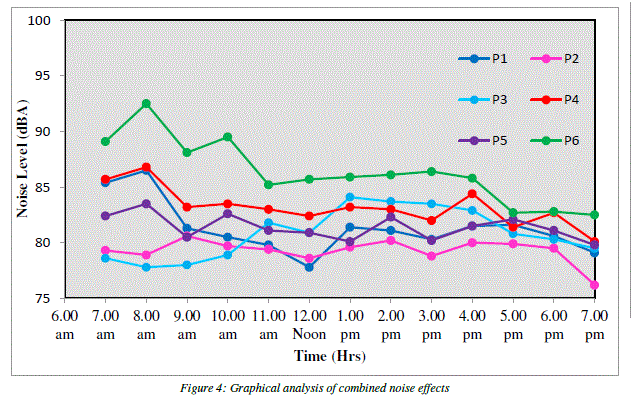 |
| As shown in this graph, the majority of inhabited (community) receptor -related noise levels that would be from P4 to P6. For these locations, construction noise would be expected to be clearly audible during most of the daytime hours, depending on the actual, onsite construction activities. These points of perceptibility are not considered significant, however, based on the temporary nature of the construction phases and the intermittent duration of the worst-case activities. Other locations P2 and P3, would have construction-related noise levels, but below to any other location. |
STRATEGIES FOR REDUCING GENERATOR SET NOISE |
| Regardless of the type of generator set that needs sound attenuation, there are basically seven strategies for reducing generator set noise: 1) Reduce the sound level of the source 2) Acoustic barriers 3) Acoustic Insulation 4) Isolation mounts 5) Cooling air attenuation 6) Exhaust silencers 7) Efforts to maximize the distance between the generator set and the property line (or people). |
| When locating generator sets in outdoors, the use of enclosures, particularly sound-attenuating enclosures shall combines all these strategies into a convenient package that provides weather protection as well as sound attenuation. |
CONCLUSION |
| Construction work is inherently noisy. This study explained untreated generator set noise levels were 100 dB(A) or more, it was clear that generator set noise mitigation is a subject of great importance. The permissible exposure level 90 dBA was reached at 7.0m from G1 and 10.5m from G2 generator. This noise effects from generators can be mitigated by introducing noise reduction screens or acoustic shield around or provide hard barricade’s to exclude the employee’s entry and minimizes the exposure in noisy zone. The combined noise exposure to workers ranges from 76.2 dBA to 92.5 dBA, this represents a cautionary risk of hearing damage to construction workers involved in this work area. |
| This scenario shall exist in many construction sites wherever open generators are used for power generation and seeks implementation of an effective hearing protection and awareness program. Furthermore, the high cost of retrofitting a site for noise reduction makes it imperative to assess noise performance requirements early in the on-site power system design stage. Working closely with local regulations, consulting engineer or acoustic specialist shall allow in achieving the sound-attenuation goals. |
MITIGATION MEASURES AND SCOPE FOR FUTURE WORK |
| Once the construction work is in progress, it is essential to monitor the implementation of the noise control plan. The following mitigation measures will be implemented to reduce noise and ensure that the noise impacts are less than significant. |
| • Checking if equipment brought onto site complies with specifications. This could be done by obtaining information available from suppliers or by noise assessments. |
| • Reducing noise from identified noise sources by exchanging equipment and/or processes for a quieter alternative or by engineering control methods to quieting the existing one. |
| • Ensuring that all plant is properly maintained e.g. all noise control measures like silencers and enclosures are intact [13]. |
| • Keep machinery covers and panels closed and well fitted. Bolts/fasteners done up tightly avoid rattles |
| • Monitoring work schedules to check that noisy work is carried out as specified, away from other workers, outside hours, etc |
| • Locate noisy machines away from main areas of activity. Otherwise, screen plant from work areas by using noise reduction screens or material stacked to form barriers [12]. |
| • Monitoring whether noisy areas are identified and well marked so employees avoid entering them unnecessarily. |
| • Monitoring whether training and hearing tests have been carried out and if personal hearing protectors are adequate and are being worn and maintained correctly. |
| • Utilizing safety toolbox meetings to provide feedback on effectiveness of noise control measures and personal hearing protectors to employees and employers. |
| • Posting warning signs in high noise areas and implement hearing protection program for work areas where noise levels exceed 85 dBA, display on safety notice boards results of noise assessments conducted and additional noise information [15]. |
References |
|