International Journal of Innovative Research in Science, Engineering and Technology
ISSN ONLINE(2319-8753)PRINT(2347-6710)
ISSN ONLINE(2319-8753)PRINT(2347-6710)
S. Sreehari Sastry*1, S. Salma Begum2, K. Mallika3, K.B. Mahalakshmi4 and Ha Sie Tiong5
|
| Related article at Pubmed, Scholar Google |
Visit for more related articles at International Journal of Innovative Research in Science, Engineering and Technology
Keywords |
| Transition Temperature, Image analysis, Statistical Parameters, p – n Alkyl benzoic acids. |
INTRODUCTION |
| There are a number of techniques like Polarizing Optical Microscope (POM), Differential Scanning Calorimetry (DSC), Differential Thermal Analysis (DTA), Raman Spectroscopy, etc. applied for the measurement of phase transition temperatures [1]. The most widely used techniques in identification of phase transition temperatures are DSC and DTA, which provide extremely valuable data on the temperatures, heat of transitions and heat capacity of various phases. Although, DSC and DTA detect the phase transitions in a material by measuring enthalpy and entropy changes that are associated with each phase transition. However, the phase transitions involved in small enthalpy and entropy changes are not identified by DSC and DTA procedures. Hence, on account of POM being a standard powerful tool in the identification of liquid crystals phases [2,3], either DSC or DTA is used in conjunction with POM to determine the phase transitions temperatures of the samples. |
| With the continuous advancement in data acquisition systems, the image analysis has greater role in diverse fields such as medicine, science, engineering, astronomy, microscopy etc., [4]. Image analysis is a technique, which extracts the meaningful information from images by means of applying computational techniques and algorithms on image data [5,6]. |
| In microscopy studies, the image analysis techniques have been developed to aid the interpretation of microscopic textures or images. There are limited studies on image processing methods in conjunction with polarizing optical microscope to investigate the phase transition temperatures of liquid crystals by analyzing the textures of samples as a function of temperature [7-10]. In continuation of the work reported [10-12] earlier based on the image analysis method, the present work deals with the phase transition temperatures through the techniques of image analysis and the statistical parameters, viz., mean, variance, skewness and kurtosis for homologous series of p-n-alkyl benzoic acids(nBA)[13] . |
EXPERIMENTAL |
| A. Materials |
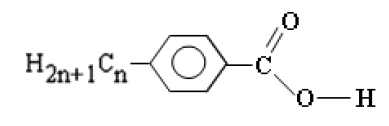
| The liquid crystal samples - p-n-alkyl benzoic acids (nBA), where n varies from pentyl (5) to decyl (10), are obtained from Frinton laboratories, Inc., USA. The molecular structure of nBA is as shown below. |
 |
| For visualizing and recording the textures as a function of temperature, Meopta polarizing optical microscope with hot stage [14] and camera is used in the arthroscopic mode [10]. A commercially available glass slide of 75mm length and 25mm width, thickness of 1.45mm is used to liquid crystal slide preparation. Glass slide was cleaned with acetone and dried at 400c and is simply rubbed in order to make unidirectional alignment in one direction. A small amount of liquid crystalline compound under investigation is placed on the glass slide which is heated to become isotropic. A small cover slip of thickness of 0.16mm is placed above the sample and allowed to cool to achieve homogeneous and uniform distribution of the compound. |
| B. Methods |
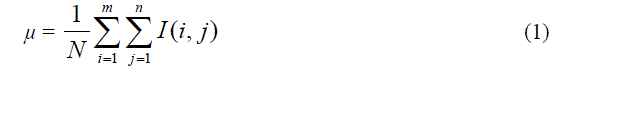
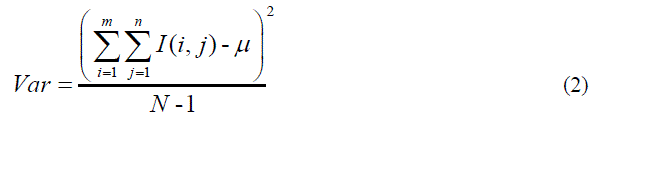
| The textures of given samples are recorded in colour images using digital camera with a spatial resolution of 1936 x 1288 pixels, representing total intensity levels in 24bit. The intensity values of the observed images in each individual bands – blue, green, red, are from 0 to 255. For analysis of the observed images the translated gray scale image is used, and the defined statistical parameters are computed using MATLAB software. |
 |
 |
| All the defined parameters are extremely sensitive to the changes in the textural features of liquid crystals as a function of temperature. |
| There is wide range of image formats like JPEG, JPEG-2000, TIFF, PNG etc. The MATLAB software provides the necessary tools for various tasks of image analysis such as statistical analysis, feature extraction, and property measurement. In the present study MATLAB software is used to compute the defined statistical parameters on the JPEG images. |
RESULTS AND DISCUSSION |
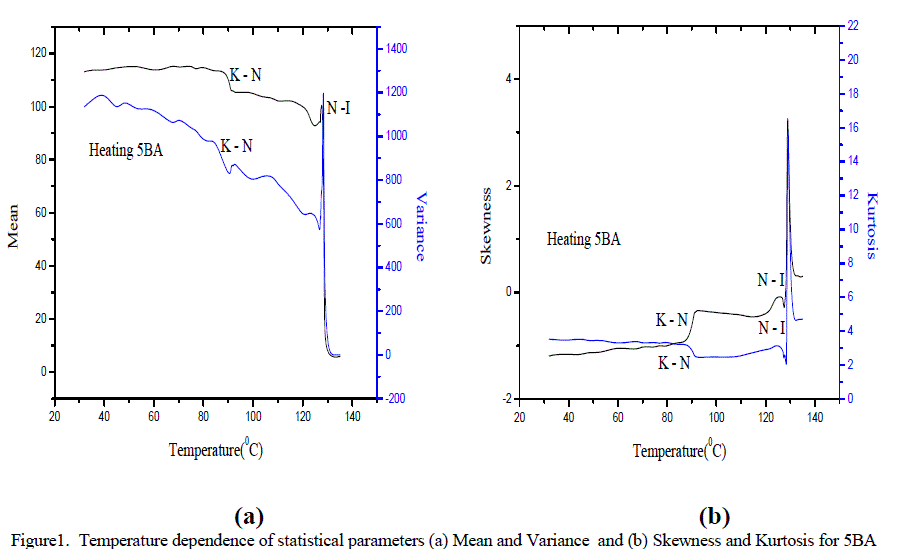
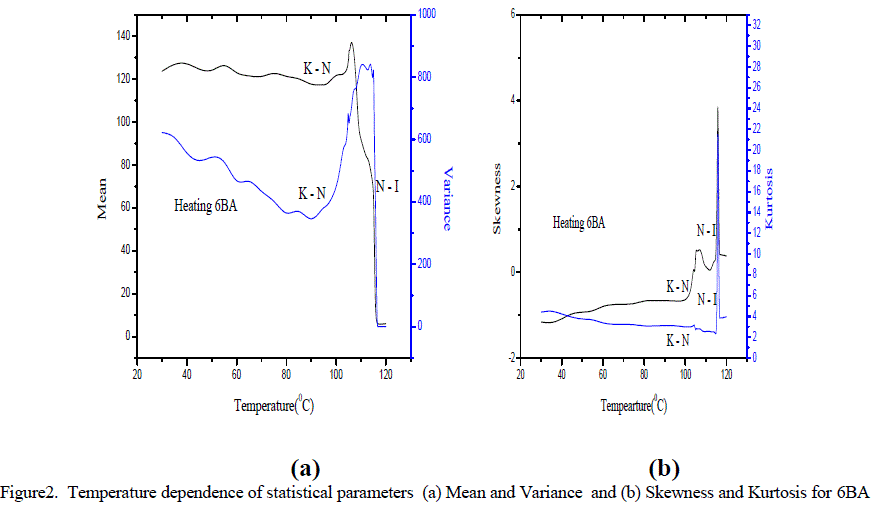
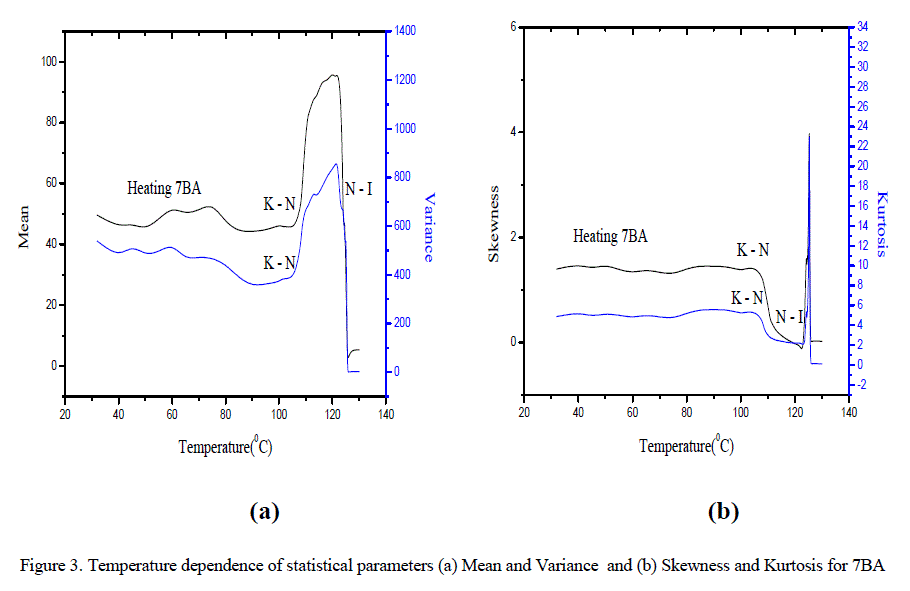
| On heating, homologous series p – n Alkyl benzoic acids have undergone a phase transition from the crystalline state to the isotropic state via an intermediate nematic phase at different temperatures. The textures of the samples recoded at different temperatures are obtained. From the equations (1) to (4), statistical parameters of the textures are computed using MATLAB software. The plots drawn for the computed statistical parameters as a function of temperature starting from the solid state to the isotropic liquid state are shown in Figures.1-6. The figures indicate phase transitions of given liquid crystal samples characterized by abrupt changes, discontinuity and strong fluctuations in the statistical parameter curves [7,9,10]. |
| For the homologous series nBA, the statistical parameters - mean, and variance; skewness and kurtosis have shown abrupt changes which are corresponding to the phase transitions temperatures of the liquid crystals as presented in figures: 1(a),1(b) for n=5, 2(a),2(b) for n=6, 3(a),3(b) for n=7, 4(a),4(b) for n=8, 5(a),5(b) for n=9, and 6(a),6(b) for n=10 respectively. |
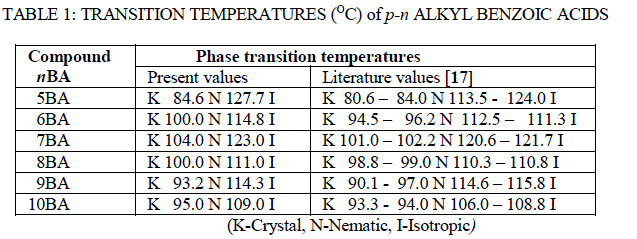
| The transition temperatures of the samples are also confirming the odd - even effect. For compounds of odd chain lengths the transition temperatures are relatively larger than the respective even chain length compounds. The observed transition temperatures of homologous series p – n Alkyl benzoic acids are compared with those reported in the literature [17] which is shown in Table -1. It is observed that the results are in good agreement with the reported values. |
 |
 |
 |
 |
CONCLUSION |
| Statistical parameters defined by analysis of the textures as a function of temperature is successful in identifying/detecting the liquid crystals phase transitions between the solid to nematic and nematic to isotropic liquid phases. Statistical image analysis in conjunction with polarizing optical microscope is a reliable and sensitive technique to identify the phase transition temperatures. |
ACKNOWLEDGEMENT |
| The authors gratefully acknowledge the Project No.: 34-12/2008 (SR), dated 30-12-2008 of UGC, UGC DRS LEVEL III program No.F.530/1/DRS/2009 (SAP-I), dated 09-02-2009 and DST FIST program No DST/FST/ PSI – 002/2011dated 20-12-2011, New Delhi, to the department of Physics, ANU for providing financial assistance. |