International Journal of Innovative Research in Science, Engineering and Technology
ISSN ONLINE(2319-8753)PRINT(2347-6710)
ISSN ONLINE(2319-8753)PRINT(2347-6710)
S.Palaneeswari1, K.Fathima Begam2
|
| Related article at Pubmed, Scholar Google |
Visit for more related articles at International Journal of Innovative Research in Science, Engineering and Technology
The objective of the paper is to improve the quality of image such as Medical or Satellite image . In this paper a technique has been proposed based on Discrete Wavelet Transform with Singular Value Decomposition. In this transform decompose the image into four sub bands, out of four bands one is low frequency and remaining are high frequency. Then the modified image is reconstructed by using inverse DWT. To improve the quality, the firststep is Adaptive Histogram Equalization (AHE).Adaptive histogram equalization method for enhancing the contrast of digital is divided into regions of pixels. Images captured in foggy weather conditions get highly degraded due to suffering from poor contrast and loss of colour characteristics .By using color space conversion method, to enhance the colored foggy images. The results of the SVD-DWT method clearly indicates increased efficiency and flexibility over the exiting methods such as Linear Contrast Stretching technique, GHE technique, De-correlation Stretching technique, Gamma Correction method based techniques
Keywords |
| Adaptive Histogram Equalization (AHE), Discrete Wavelet Transform (DWT) Singular Value Decomposition (SVD) andColor Space Conversion(CSC) |
INTRODUCTION |
| Image enhancement is the process of improving appearance or quality of a given image so that the result is more suitable than the original image for a specific application[1].It sharpens image features such as edges, boundaries, or contrast to make a graphic display more helpful for display and analysis. If we take a human body X-RAY, faults cannot be clearly detected .Because of scan machine distortion, environmental noise etc.., this leads to blurring effect and produce poor or low quality of image. To overcome this, DWT is used. DWT is the recent transform in image processing. Here Haar wavelet transform is used, this inherent their property that they are redundant and shift invariant. It decompose the given low contrast image into frequency components i.e.,sub-bands.There are several applications of DWT in image processing namely feature extraction, de-noising, face recognition, good resolution in satellite image and compression. In the existing system, Histogram Equalization, Contrast Stretching and Gamma Correction are used for image enhancement. |
| (a)Histogram Equalization: |
| The histogram of an image represents the relative frequency of occurrence of the various gray levels in the image, the histograms of two images: one colored and the other black and white. For black and white images we shall have 256 gray levels, from 0 up to 255, and the vertical lines in the histogram indicate how many pixels in an image assume a particular gray level. The histogram processes can be adapted for local enhancement. The procedure involves defining a neighborhood around each pixel and, using the histogram characteristics of this neighborhood, to derive a transfer function which maps that pixel into an output intensity level. This is performed for each pixel in the image. HE is a useful technique for improving image contrast[10], but its effect is too severe for many purposes. The advantage of this method is to control the contrast effect and histogram estimation and cumulating function period provide a very wide range of effects. Local enhancement may also define transforms based on pixel attributes other than histogram, e.g. intensity mean (to control variance) and variance (to control contrast) are common. |
| s = T(r)where 0 ≤ r ≤ 1 |
| T(r) is single-valued and monotonically increasing function in the interval 0 ≤ r ≤ 1 |
| The main disadvantage of this method is indiscriminate leads to increase the contrast of background noise and it produce more blurring effect . |
| (b)Contrast Stretching: |
| In some digital images, the features of interest occupy only a relatively narrow range of the gray scale. One might use a point operation to expand the contrast of the features of interest so that they occupy a larger portion of the displayed gray-level range. This is called contrast enhancement or contrast stretching. The notion contrast refers to the amplitude of gray-level differences within an image[6]. |
 |
| The range of gray level is a simple measure of how dispersed a data distribution is. |
| Range=gmax(x,y)-gmin(x,y) |
| gmax(x,y)=Maximum Gray level values |
| gmin(x,y)=Minimum Gray level values |
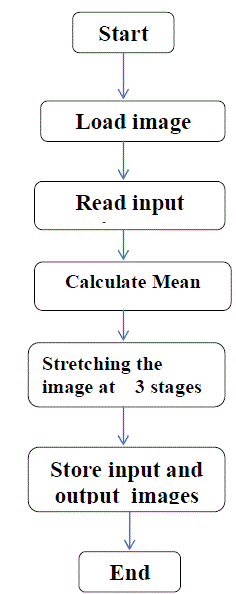
| The advantage is to improve the visualization of structures in both darkest and lightest portions of the image at the same time.The above flowchart describes how to calculate Contrast Stretching. The main disadvantage of this method is to produce aliasing effect due to missing of edges. |
| (c)Gamma Correction: |
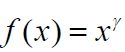
| Gamma correction is the name of a nonlinear operation used to code and decode luminance or tristimulus values in video or still systems. Gamma is the term used to describe the nonlinearity of a display monitor[5].The gamma correction is an intensity transformation function |
 |
| hereγ is a constant |
| A gamma value γ< 1 is sometimes called an encoding gamma, and the process of encoding with this compressive power-law nonlinearity is called gamma compression; conversely a gamma value γ> 1 is called a decoding gamma and the application of the expansive power-law nonlinearity is called gamma expansion. The effect of gamma correction on an image: The original image was taken to varying powers, showing that powers larger than one make the shadows darker, while powers smaller than one make dark regions lighter. The main disadvantage of this method is low signal to noise ratio. |
METHODOLOGY |
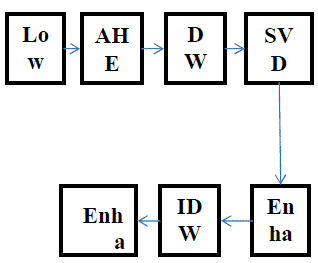
| During the last decade, several techniques are proposed for contrast enhancement of a low-contrast satellite images. In this paper, a technique has been proposed based on the Singular Value Decomposition (SVD) and Discrete Wavelet Transform (DWT). The proposed technique modified SVD-DWT converts the image into the SVD-DWT domain after normalizing the singular value matrix. Then the modified image is reconstructed by using inverse DWT. In the enhancement procedure Adaptive Histogram Equalization (AHE) has been used. The perceptual and quantitative results of the proposed modified SVD-DWT Images captured in foggy weather conditions get highly degraded due to suffering from poor contrast and loss of color characteristics .By using color space conversion method, to enhance the colored foggy images. This method clearly indicates increased efficiency and flexibility over the exiting methods such as Linear Contrast Stretching technique, GHE technique, De-correlation Stretching technique, Gamma Correction method based techniques. |
 |
| Adaptive histogram equalization (AHE) is a computer image processing technique used to improve contrast in images. This method is more advanced version of histogram equalization, adaptive histogram equalization, makes the assumption that the image varies significantly over its spatial extent. [2][5]It differs from ordinary histogram equalization in the respect that the adaptive method computes several histograms, each corresponding to a distinct section of the image, and uses them to redistribute the lightness values of the image. Divides the image into smaller tiles, applies histogram equalization to each tile, then interpolates the results.Adaptive histogram equalization method comprises a step of smoothing the histograms and used, directly or indirectly, in the step of mappingpixel values. The structure determining means is adapted to delete single and sparsely distributed edge points determined by the edge detection method and/or is adapted to connect broken edges. |
| STEPS: |
| 1. Select the 225x225 sub image |
| 2. Find the count i.e., no of times values repeated with corresponding pixel values |
| 3. Then calculate the CDF i.e., sum of consecutive values of each pixel value. Pixel values that have a zero count are excluded .From that we get a histogram of an image |
| 4. Then calculate the histogram equalization by the formula |
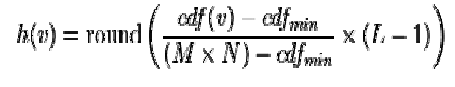 |
| cdfmin - minimum non-zero value of the cumulative distribution function M × N – image size (225x225) gives the image's number of pixels L -number of grey levels used (in most cases, like this one, 256). |
| 5. Divides the image into smaller tiles, applies histogram equalization to each tile, then interpolates the results. |
| (b)Discrete Wavelet Transform: |
| The transformation is a process that translates one object from a given domain to another in order to have some important implicit information, which can be used for its recognition .One of the conventional transformations, is the Fourier transform which usually transforms the signal from its time domain to the frequency domain. The next form of the Fourier transform developed to an efficient transform is called the Wavelet Transform (WT) .Wavelet can be regarded as the most efficient transform that deals with image, sound, or any other pattern since it provides a powerful time-space (timefrequency) representation. |
| STEPS: |
| 1. Select the input image |
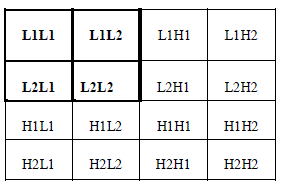
| 2. Apply mean filter on specific parts (high pass components) of the resultant image (L1H1,L1H2, L2H1, L2H2, H1L1, H1L2, H1H1, H1H2, H2L1, H2L2, H2H1, H2H2),and leave the low-pass components as it is which is used in the next step. |
| 3. Obtain the Wavelet transformation coefficients for each part of the low-pass components (L1H1, L1L2, L2L1, L2L2). Each part will give four subband( LL,LH,HL,HH) as shown below:- |
 |
| 4. Each part will be processed as the previous way then repeat step (2) on the resultant high passcomponents only (L1H1, L1H2, L2H1,L2H2, H1L1, H1L2, H1H1, H1H2, H2L1, H2L2,H2H1, H2H2) by applying mean filter on that components and leave the lowpasscomponent |
| 5. Inverse the Wavelet transformation coefficient gives the reconstructed image. |
| (C)Singular Value Decomposition: |
| Singular value decomposition (SVD) can be calculated mainly by the three mutually compatible points of view. On the one hand, we can view it as a method for transforming .World Academy of Science, Engineering and Technology correlated variables into a set of uncorrelated ones that better expose the various relationships among the original data itemsp[11]. At the same time, SVD is a method for identifying and ordering points exhibitthe most variation. His ties the dimensions along which data in to the third way of viewing SVD which is that once we have identified where the most variation is present, then it is possible to find the best approximation of the original data points using fewer dimensions. Hence, SVD can be seen as a method for data reduction and mostly for feature extraction as well as for the enhancement of the low contrast images. |
| (D)Enhancement of Foggy Images |
| Images captured in foggy weather conditions get highly degraded due to suffering from poor contrast and loss of color characteristics[4]. This project presents a contrast enhancement algorithm for such degraded color images. To restore both contrast and color we propose following four steps: 1) RGB component of the input image is converted into Hue Intensity Saturation (HIS) components; 2) Applying a novel contrast enhancement technique on Intensity (I) component. This is done on the I component due to the well known fact that human vision system is more sensitive to this component as compared with other components (i.e. H, S); and then 3) apply Gamma correction method on the S component for color restoration; finally, 4) combining H, I, S components to get back RGB components. Besides proposed method being simple, experimental results show that the proposed method is very effective in contrast and color enhancement as compared to other competitive methods |
 |
| Figure shows the flow chart of foggy images. |
| (i) Pre processing |
| It suppresses noise (image pre-processing) and enhances some object features - relevant to understanding the image such as edge extraction, smoothing, thresholding etc. |
| (ii)Color Space Conversion[18] |
| Color space conversion is the translation of the representation of a color from one basis to another. This typically occurs in the context of converting an image that is represented in one color space to another color space, the goal being to make the translated image look as similar as possible to the original. |
| After completing preprocessing,the input image is given to the Color Space Conversion method,1)RGB component of the input image is converted into Hue Intensity Saturation (HIS) components; 2) Applying a contrast enhancement technique on Intensity (I) component. This is done on the I component due to the well known fact that human vision system is more sensitive to this component as compared with other components (i.e. H, S); and then 3) apply Gamma correction method on the S component for color restoration; finally, 4) combining H, I, S components to get back RGB components[3]. Besides proposed method being simple, experimental results show that the proposed method is very effective in contrast and color enhancement as compared to other competitive methods. |
| (iii)Post Processing |
| It enhances the quality of a finished image to prepare its publication and distributon.It includes technique to clean up the image to make them visual clear. |
SIMULATION RESULTS& DISCUSSION |
 |
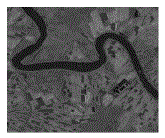
| The above figure shows the Original Image |
Adaptive Histogram Equalization(AHE) |
 |
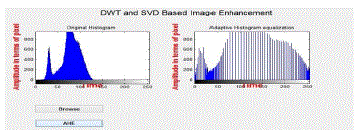
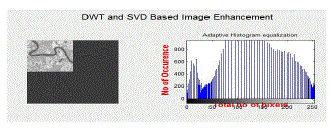
| Figure2 Shows the Adaptive Histogram Equalization[5][7]. By calculating Cumulative distribution function( CDF) ,we get a histogram of an image,.Divides the image into smaller tiles, applies histogram equalization to each tile, then interpolates the results ; here the gray level pixels are distributed evenlythis leads to improve the quality of the image. |
 |
| Discrete Wavelet Transform(DWT) |
 |
| Figure 4 shows Discrete Wavelet Transform of an image. Here the input image is divided into four sub-bands, from that we obtain the wavelet coefficient for each part of the low-pass components (L1H1, L1L2, L2L1, L2L2).For Higher frequency, it produce more noise, so that, the image is taken as lower frequency. |
| Singular Value Decomposition(SVD) |
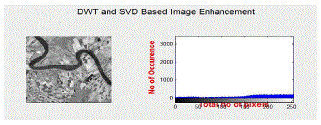 |
| Figure 5shows the DWT with SVD .After taking Discrete wavelet transform, applying SVD process to the imageit is possible to find the best approximation of the original data points using fewer dimensions. Hence, SVD can be seen as a method for data reduction and mostly for feature extraction as well as for the enhancement of the low contrast images. |
 |
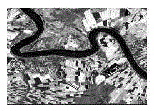
| Figure 6 shows the enhanced image. From the above process We get a enhanced factor, taking Inverse Discrete wavelet transform (IDWT)it gives Enhanced image. |
| From that calculating Mean Square Error(MSE)and Peak Signal o Noise Ratio(PSNR) |
| MSE=((original image-reconstructed image)^2)/(M*N) |
| PSNR=10 log(M*N)/MSE |
| Comparison |
 |
| From the above table, Increased PSNR and reduced MSE over the existing method such as Gamma Correction, this leads to improve the quality of image. |
| Enhancement of colored Foggy image |
| Input image |
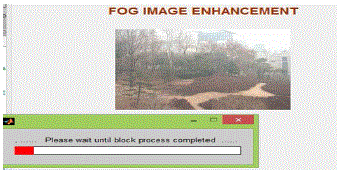
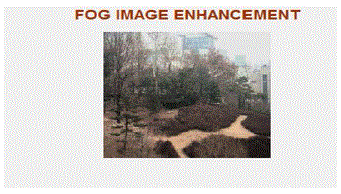 |
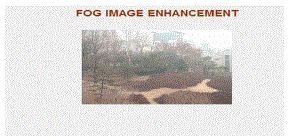
| Figure 7 shows the Original input Foggy image |
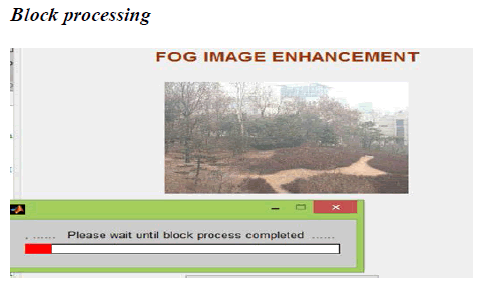 |
| Figure 8 shows the block process i.e.,1)RGB component of the input image is converted into Hue Intensity Saturation (HIS) components; 2) Applying a contrast enhancement technique on Intensity (I) component. This is done on the I component due to the well known fact that human vision system is more sensitive to this component as compared with other components (i.e. H, S); and then 3) apply Gamma correction method on the S component for colour restoration; finally, 4) combining H, I, S components to get back RGB components[18]. Besides proposed method being simple, experimental results show that the proposed method is very effective in contrast and color enhancement as compared to other competitive methods. |
| Output |
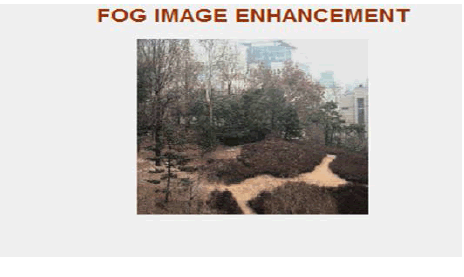 |
| Figure 9 shows the enhancement of Foggy images From that calculating Mean Square Error (MSE) and Peak Signal o Noise Ratio (PSNR) |
| From that calculating Mean Square Error (MSE)and Peak Signal o Noise Ratio(PSNR) |
| MSE=((original image-reconstructed image)^2)/(M*N) |
| PSNR=10 log(M*N)/MSE |
| Comparison |
 |
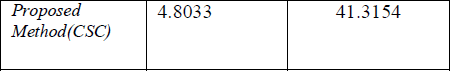 |
| From the above table, Increased PSNR and reduced MSE over the existing method such as Gamma Correction, this leads to improve the quality of image. |
CONCLUSION |
| Thus the improvement of image quality, several techniques are proposed for contrast enhancement of a medical or satellite images. A technique has been proposed based on the Singular Value Decomposition (SVD) and Discrete Wavelet Transform (DWT). The proposed technique modified SVD-DWT converts the image into the SVD-DWT domain after normalizing the singular value matrix. Then the modified image is reconstructed by using inverse DWT. In the enhancement procedure Adaptive Histogram Equalization (AHE) has been used.Images captured in foggy weather conditions get highly degraded due to suffering from poor contrast and loss of colour characteristics .By using color space conversion method, to enhance the colored foggy images. The perceptual and quantitative results of the proposed modified SVD-DWT method clearly indicates increased efficiency and flexibility over the exiting methods such as Linear Contrast Stretching technique, GHE technique, DWT-SVD technique,De-correlation Stretching technique, Gamma Correction method based techniques. By using proposed method of Discrete Wavelet transform with singular value decomposition, Adaptive histogram equalization reduces the blurring effect and aliasing effect. |