ISSN ONLINE(2319-8753)PRINT(2347-6710)
ISSN ONLINE(2319-8753)PRINT(2347-6710)
Ujwal Shreenag Meda1*, Rakesh2, Sidharth S N2, Chandra2, Latha B R2
|
| Related article at Pubmed, Scholar Google |
Visit for more related articles at International Journal of Innovative Research in Science, Engineering and Technology
Several products of pharmaceutical and food industries are a blend of various powders or bulk solids. These powder blends often have active/minor ingredients such as active pharmaceutical ingredients or food additives. Minor ingredient is one which is present in small quantity which has to be uniformly distributed throughout the mixture. Hence mixing of powders is a very important part of production. Content uniformity of mixture is said to be achieved when the proportion of the ingredients is identical all over the mixture. Particle size of active ingredient plays an important role in achieving content uniformity. Mixing experiments were carried out on a binary mixture using an inhouse mortar mixer to test the impact of particle size on content uniformity. The binary system consisted of wheat flour and common salt (Sodium Chloride). Sodium chloride, minor ingredient, of varying particle size was considered for the experiments and the content uniformity was tested for different mixing times. Results showed that smaller the particles better the content uniformity.
Keywords |
| Content uniformity, particle size, powder mixing, minor ingredient, mixing time, binary mixture |
INTRODUCTION |
| Solid particulate materials have been subjected to mixing operations since ancient days. One of the earliest devices used was a mortar and pestle [1]. The aim of mixing operation is to get the best homogenization of two or more components. When a sample taken from any position in the mixture contains the same proportions of all the ingredients as the proportions present in the whole mixture then the mixture is said to have achieved content uniformity. But difficulties in achieving content uniformity will appear due to varying properties of each componentsuch asparticle size, shape, moisture content, density etc. [2]. In a mixing process, uniform distribution of a minor ingredient (like salt/food additive in a food industry or an active pharmaceutical ingredient in a pharmaceutical industry whose weight fraction is very low) all over the mixture to achieve content uniformity is a challenge. Choosing the right particle size of minor ingredient is critical in achieving content uniformity. Many mixing devices are used in the food processing industries likeribbon blenders, orbiting screw mixers, extruders, etc. Irrespective of the type of mixer used, choice of right particle size of minor ingredient influences the mixing time along with content uniformity. A satisfactory mixing process produces uniform mixture in a minimum time with minimum labour and energy consumption. The impact of particle size on content uniformity is tested on a binary mixture consisting of wheat flour and salt using an in-house mortar mixer. |
II. EXPERIMENTAL |
A. Materials: |
| Wheat flour, sodium chloride |
B. Instruments: |
| Mortar mixer, flame photometer – ELICO CL 354, sieve shaker(ASTM test sieves) with sieves of mesh number 36, 52 and 72, sampling thief |
C. Quantities: |
| Table 1specifies the components and their quantities used for the mixing experiments. |
 |
D. Sieving: |
| Sieve Shaker – ASTM test sieves was used to obtain the wheat flour and common salt of required particle size. Wheat flour of particle size less than 295 microns was obtained by sieving for 10 minutes using a sieve with mesh number 52. Likewise common salt (sodium chloride) of three different sizes >422μm, 211-422μm and <211μm were obtained by sieving the salt for 10 minutes using sieves with mesh number 36 and 72. |
E. Mixing: |
| An in house Mortar Mixer of 3kg capacity was used for mixing experiments on binary system of wheat flour and common salt. The mixer was operated at 60 rpm and the experiments were carried out for 16 minutes each. In total three mixing experiments were carried out for which 3 different particle sizes of salt were considered along with wheat flour as mentioned inTable 1. In the first mixing experiment, 1990g of wheat flour and 10g of salt with particle size greater than 422 microns were taken. Samples of 1g each were collected at six different positions for every 1, 2, 4, 8 and 16 minutes using customized sampling thief. Two more experiments were carried out with salt size 211-422μm and <211μm respectively by keeping all other parameters constant. In all the three experiments, the particle size of wheat flour was fixed to less than 295 microns. Salt being the minor ingredient which also acts as a tracer, samples were tested for sodium content using a flame photometer in order to check the content uniformity. |
F. Sample collection:q |
| A sampling thief was used to collect samples at 6 different locations within the mortar mixer. 6 locations were chosen in such a way that it covers the entire volume of the mixer. The mixing operation was stopped at the specified time intervals and samples were collected from the same six locations every time. Sample size was fixed to 1g. |
G. Determination of salt concentration in samples: |
| Initially the flame photometer was calibrated using sodium chloride solutions of known concentration to generate the calibration curve.Distilled water was used for setting intensity to zero. Solutions were prepared using the samples that were collected during the experiment by dissolving the entire sample (1g) in 25 ml distilled water. Later the intensity corresponding to salt concentration in every sample was noted and the corresponding salt concentration was calculated. |
III. RESULT AND DISCUSSION |
A. Calibration of flame photometer |
| The calibration chart that was used to determine salt concentration in each of the samples collected during mixing experiments is shown inFigure 1. Here intensity of 200 corresponds to 0.5% salt solution. |
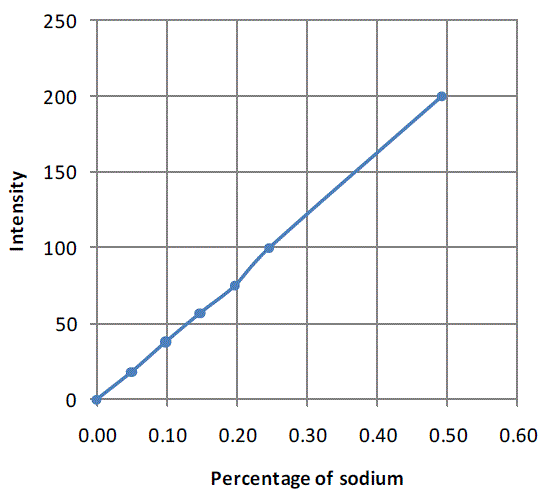 |
| Figure 1:Calibration chart for flame photometer generated using sodium chloride solution of known concentrations |
B. Variation of salt concentration with mixing time |
| Figure 2, Figure 3 and Figure 4 are plots of intensity obtained from flame photometer corresponding to the amount of salt present in each sample collected at six different locations at regular time intervals. In Figure 2 intensities corresponding to the salt present in samples collected after first minute shows that the concentration of salt is not uniform all over the mixture. As the time proceeds, the mixing is improved and the content uniformity is achieved after 8 minutes of mixing in case of experiment with salt particles of size more than 422 microns as shown in Figure 2. In case of salt particles with size between 211 microns and 422 microns mixing time required to achieve content uniformity decreases to 4 minutes. Whereas in case of salt particles with size below 211 microns, content uniformity is achieved in just 2 minutes. |
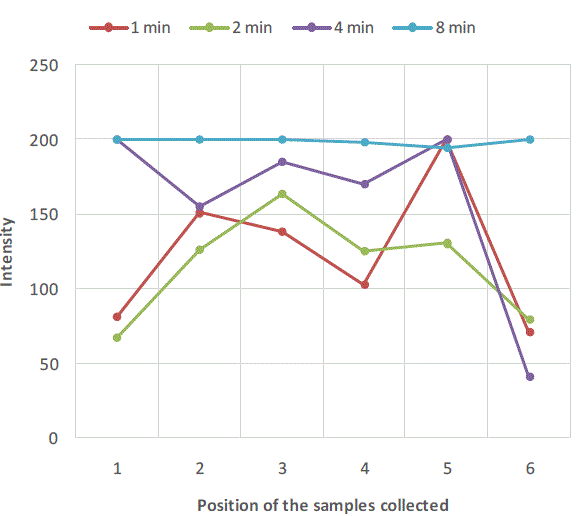 |
| Figure 2:Variation of salt concentration at different locations of mixer with respect to time in case of binary system with salt particles greater than 422 microns |
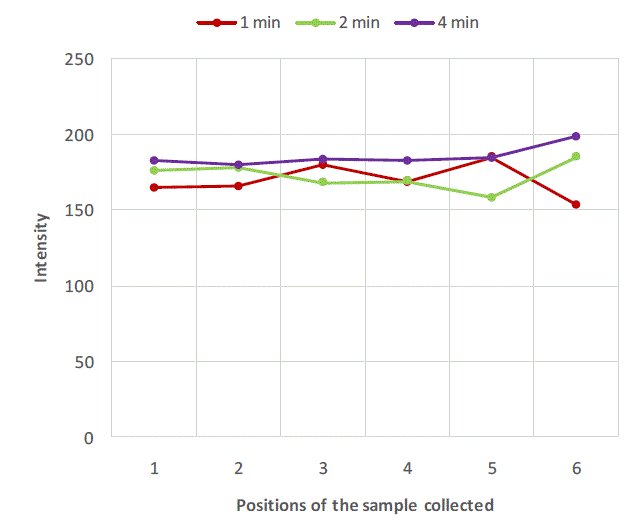 |
| Figure 3: Variation of salt concentration at different locations of mixer with respect to time in case of binary system with salt particles between 211 microns and 422 microns. |
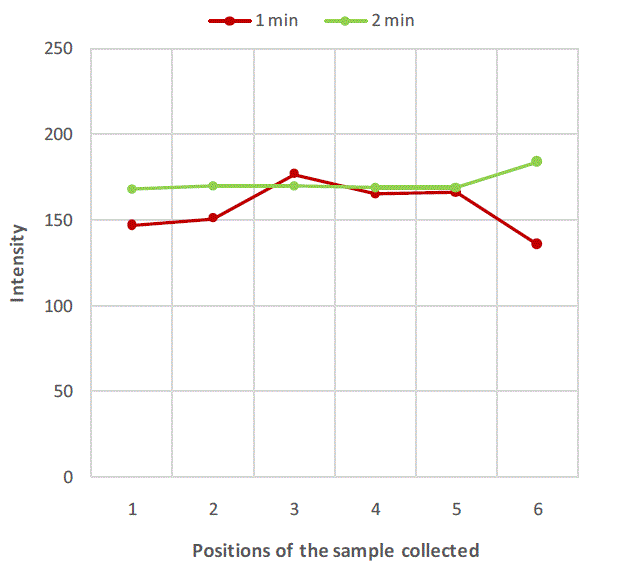 |
| Figure 4:Variation of salt concentration at different locations of mixer with respect to time in case of binary system with salt particles less than 211 microns. |
C. Mixing curves |
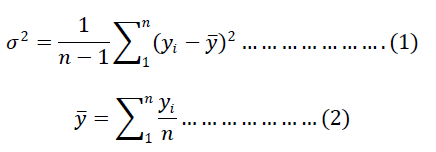 |
| ïÿýïÿý = average value of the concentration of the tracer (minor ingredient)in all the samples taken at a time interval ïÿýïÿýïÿýïÿý = mass fraction of the tracer component in each sample n = number of samples taken at a time interval |
| Variance between the expected salt concentration and the actual salt concentration inthe samples collected at varying mixing times at six different locations is calculated usingequation 1. In case of mixing curve for salt with particle size greater than 422 microns, the variance reduces with increasing in mixing time and reaches a constant value beyond 8 minutes of mixing, that means it requires at least 8 minutes of mixing to achieve content uniformity in case of a mix having a minor ingredient with particle size greater than 422 microns. A huge reduction in variance is observed in case of salt with particle size between 211 and 422 microns just after a minute of mixing and the content uniformity is achieved just beyond 4 minutes of mixing. It implies that reducing the particles size reduces the mixing time. When the particle size is reduced by half, the mixing time is reduced by four times and it can be seen in mixing curve for salt with particle size less than 211 microns where the required content uniformity is obtained just after 2 minutes of mixing. |
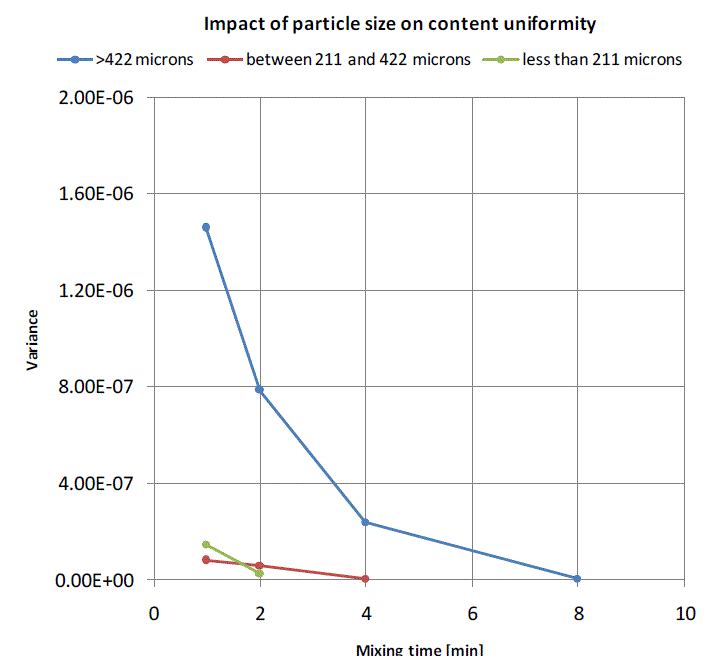 |
| Figure 5:Mixing curves for binary mixture of wheat and salt for varying particle sizes of salt |
IV. CONCLUSION |
| Particle size of a minor ingredient plays a major role in achieving content uniformity in a mixture.Content uniformity is achieved faster when the size of the particles(in particular minor ingredient) is smaller. Choosing the right particle size of minor ingredient saves mixing time as were as energy. In addition, the type of mixer, properties of ingredients such as shape, moisture content, flowability, density of the particles etc also play a role in mixing. These parameters should also be taken into account during mixing operations to optimize the mixing process. |
References |
|