Research & Reviews: Journal of Microbiology and Biotechnology
E- ISSN: 2320 - 3528
P- ISSN: 2347 - 2286
E- ISSN: 2320 - 3528
P- ISSN: 2347 - 2286
1School of Resources and Environment, University of Jinan, Jinan 250022, China
2Key Laboratory of Chemical Sensing & Analysis in Universities of Shandong, School of Chemistry and Chemical Engineering, University of Jinan, Jinan 250022, China
Received date: 07/07/2015; Accepted date: 04/08/2016; Published date: 15/08/2016
Visit for more related articles at Research & Reviews: Journal of Microbiology and Biotechnology
Extracellular polymeric substances (EPS), as a series of metabolic products secreted by microorganisms, have important effect on the formation and stability of sludge. This study evaluated the role of EPS in biosorption of three dyes by using aerobic granular sludge (AGS) as a biosorbent. Meanwhile, the mechanism between EPS and three types of dyes was investigated by using three-dimensional excitationemission matrix (3D-EEM), synchronous fluorescence spectra, twodimensional correlation spectroscopy (2D-COS) and Fourier transform infrared spectroscopy (FTIR). The experimental data revealed that methylene blue (MB), methyl orange (MO) and congo red (CR) sorption onto AGS were favorable for Langmuir and Freundlich isotherms. It was demonstrated that EPS made a different contribution for three types of dyes removal and EPS might play a greater role in the cationic dyes removal. 3D-EEM implied that two protein-like substances in EPS were identified and quenched in the presence of dyes. According to synchronous fluorescence spectra, it was found that dynamic and static quenching might be involved in the fluorescence quenching of EPS by three types of dyes. Moreover, a higher binding ability between MB and EPS was observed than other two dyes. 2D-COS indicated that the spectral changes proceeded in the same direction as the variation of MB, MO and CR concentrations. The results obtained in present study could facilitate a better understanding towards the role and mechanism of EPS during biosorption process.
Extracellular polymeric substances (EPS); Aerobic granular sludge (AGS); Biosorption; Dyes; Fluorescence spectra
Dyes are widely used in many industry fields, including leather tanning, textile, printing, cosmetics and food processing, etc. It is reported that 10-20% of used dyes could enter the environment through industrial discharge annually, resulting in large amounts of wastewater [1]. Dyes not only affect the photosynthetic activity in aquatic life due to decreased light penetration but also are toxic to some aquatic life due to the presence of metals, aromatics, etc [2]. Up to now, various techniques are used in the removal of the dye from wastewater, such as ion exchange [3], coagulation/flocculation [4], membrane separation [5], oxidation or ozonation [6,7], adsorption [8].
Recently, biosorption is considered as one of potential alternative technologies for removing dye-containing wastewater due to its effectiveness and environmental friendliness. A wide range of biomaterials available have been employed as biosorbent for the desired pollutant removal, e.g., bacteria [9], fungi [10], agricultural waste [11], and activated sludge [12]. Compact structured aerobic granular sludge (AGS) has been extensively utilized as a biosorbent in lab-scale, since its high surface area, dense and porous microbial structure and excellent settling capability [13]. Gao et al. demonstrated that the inactive AGS could be effectively used as a low-cost biosorbent for the removal of Acid Yellow 17 dye from wastewater, who found that the biosortion process was highly dependent on pH value and the pH value of 2.0 was favorable [14]. Jian et al. used AGS as biosorbent to remove Cu2+ from aqueous solution and evaluated effects of different conditions, suggesting that the interaction between Cu2+ and AGS was endothermic and spontaneous [15].
Extracellular polymeric substances (EPS) are a class of metabolic products secreted by microorganisms during the growth and lysis, which play an important role in the stable operation of sludge system. EPS have a significant influence on the physicochemical properties of microbial aggregates, including floc structure [16], surface charge [17], bioflocculation, sludge-water separation property [18] and adsorption ability [19]. Hence, it is necessary to elucidate the role of EPS for desired pollutant removal from wastewater in sludge biosorption process. The binding experiment between EPS and sulfamethazine (SMZ) was conducted by Xu et al. and results showed that EPS made a specific contribution to SMZ removal in activated sludge system [20]. Sheng et al. also characterized the adsorption characteristics of EPS to toluidine blue, who found that EPS played an important role in the biosorption of dyes pollutants in wastewater biological treatments [21].
So far, however, there are few reports concerning the role and mechanism for EPS in sorption of different dyes during AGS system. In this reason, the objective of present work was to investigate the role and mechanism for EPS by means of various characterization methods. Three dyes, including methylene blue (MB), methyl orange (MO), congo red (CR), were selected as the target pollutants to evaluate the role and change of EPS in dyes removal. The combination of three-dimensional excitationemission matrix (3D-EEM) fluorescence spectroscopy, synchronous fluorescence spectroscopy, two-dimensional correlation spectroscopy (2D-COS), and Fourier transform infrared (FTIR) spectroscopy was employed to elucidate the interaction between EPS and dyes. The results might contribute towards a better understanding on the role of EPS in the biosorption of different kinds of dyes from wastewater by AGS.
Dyes and analysis
MB (molecular formula=C16H18ClN3S, molecule weight 319.86 g mol/L), a type of cationic dyes; MO (molecular formula=C14H14N3SO3Na, molecule weight 327.34 g mol/L), a model of anionic azo dyes; CR, (molecular formula=C32H22N6Na2O6S2, molecule weight 696.68 g mol/L), a typical and the first synthetic dye of anionic disazo dye. Their molecular structures are shown in Figure S1 (See Supplementary material). They were purchased from Aldrich Chemical Company. The test solutions were prepared by diluting stock solutions to the desired concentrations, adjusted to neutral with 0.1 mol/L HCl or NaOH solutions.

Figure 1: Langmuir and Freundlich adsorption isotherms fit of (A1) MB; (B1) MO; (C1) CR; and Contribu tions of EPS for biosorption (A2) MB; (B2) MO; (C2) CR.
AGS used in biosorption test
AGS used for the biosorption test was collected from our lab-scale sequencing batch reactor (SBR) operated over 2 years, more details of cultivation can be obtained from previous study [22]. Synthetic wastewater fed to the reactor with the following composition was used: ammonium chloride, 200 mg/L; glucose, 500 mg/L; K2HPO4, 112 mg/L; CaCl2, 40 mg/L; FeSO4•2H2O, 20 mg/L; MgSO4•2H2O, 20 mg/L and trace element solution 1.0 mL/L. For each batch in biosorption experiments, AGS was harvested from the SBR and then washed three times with deionized water to remove the external substrate.
Biosorption experiment
Biosorption experiment was performed in four 100 mL Erlenmeyer flasks and each flask contains 10 mL (about 0.5 g dry weight) of AGS and 100 mL dyes solution (200 mg/L). Thereafter, flasks were agitated on a reciprocal shaker at 25°C for 6 h to reach equilibrium. After biosorption equilibrium, the supernatant was discarded by centrifugal and the remained sludge in flasks was used to extract EPS. For adsorption isotherm experiment, about 5 mL AGS was added into 50 mL solution containing different initial dyes concentrations from 50 to 2000 mg/L at 25°C for 6 h to ensure equilibrium.
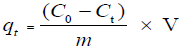
The removal efficiency of dyes and the amount of dyes adsorbed (mg/g) qt in biosorption process were given according to the following Equations (1) and (2):
 (1)
(1)
 (2)
(2)
Where C0 (mg/L) is the initial concentration and Ct (mg/L) represents the concentration of dye at time t (min), V (L) is the volume of adsorbate solution, qt (mg/g) is the mass of adsorbents, qt (mg/g) denotes the adsorbed amount at time t (min).
Extraction and 3D-EEM of EPS
Extraction process of EPS from AGS was as follow: 0.5 g AGS was first washed several times with deionized water and subsequently centrifuged in a 100 mL centrifugal tube at 4000 rpm for 5 min. Afterwards, AGS was re-suspended with 0.05% NaCl solution and heated at 75°C for 1 h, then centrifuged at 8,000 rpm for 15 min. The centrifuged supernatants were filtered through 0.45 μm membranes and regarded as the EPS of AGS.
3D-EEM spectra of EPS samples were measured and the range of corresponding scanning emission wavelength was set from 250 to 550 nm, while the excitation intensity was collected from 200 nm to 400 nm. The interval and the slit width of emission and excitation were fit to 5 nm and 10 nm, respectively. Additionally, to limit second-order Raleigh scattering, a 290 nm cutoff filter was used for all samples.
Binding test between EPS and dyes
Binding test between EPS and seven test concentrations of dyes (0, 5, 10, 15, 20, 30, 50 mg/L) were conducted, which was prepared for the following synchronous fluorescence spectra analysis. To begin with, 0.5 mL solution of EPS was added into 10 mL centrifugal tube, and then the prepared dyes stock solutions were fed into the tube to achieve the above pre-determined concentrations. Subsequently, the mixed solutions were set as 2 h for equilibrium before spectral analysis. Synchronous fluorescence spectra of EPS without and with dyes were scanned with the excitation and emission wavelength from 200 to 550 nm and the slit widths were set at 10 nm.
Analytical methods
The dyes concentration was determined by measuring the absorbance at 665, 463 and 488 nm for MB, MO, CR by using a UV-spectrophotometer (TU-1901, Beijing Purkinje General instrument Co., Ltd., China). The FTIR spectroscopy of EPS was recorded on a FTIR spectrometer (TENSOR27 spectrometer, Bruker Co. Ger.) in the range of 4000-5000 cm-1. The 3D-EEM spectra were measured by means of a luminescence spectrometer (LS-55, Perkin-Elmer Co., USA). All the samples were monitored immediately in this study and experiments were analyzed in triplicate to decrease the error in the experimental system.
Adsorption isotherm and EPS contribution
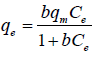
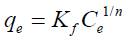
Langmuir and Freundlich models were used to describe the adsorption equilibrium of three types of dyes onto AGS. The mathematical forms of Langmuir and Freundlich adsorption isotherms can be given as Equations (3) and (4):
 (3)
(3)
 (4)
(4)
Where qe (mg/g) and Ce (mg/L) represent the amount of adsorbed dyes and dye concentration at equilibrium, respectively. And qm (mg/g) is the theoretical maximum adsorption capacity, b (L/mg) denotes the Langmuir constant related to adsorption energy, Kf is the binding energy constant reflecting affinity of adsorbent to dyes, and is the Freundlich constant.
The adsorption isotherms of different types of dyes onto AGS in the absence and in the presence of EPS are shown in Figures 1A1-1C1. The fitted constants along with regression coefficients (R2) are summarized in Table S1. The high values of regression coefficients for Langmuir and Freundlich adsorption isotherms (R2 >0.90) revealed that MB, MO and CR sorption onto AGS with and without EPS were favorable for both adsorption isotherms. The Langmuir and Freundlich isotherm models describe perfectly the biosorption of studied dyes on the AGS, which is similar to the study reported by Khaled et al. [23]. The calculated maximum adsorption capacity (qm) of MB, MO and CR onto AGS with EPS were 632.3, 196.6 and 35.47 mg/g, respectively. However, the qm of MB, MO and CR onto AGS without EPS were 608.1, 140.1 and 23.65 mg/g, respectively, suggesting EPS played a role in biosoption of dyes by using AGS as adsorbent. It was also found that AGS showed more adsorption capacity and Langmuir constant value in biosoption of MB. Moreover, the values of 1/n are between 0.1 and 1 in the biosorption process for all of dyes, reflecting the favorable character of the biosorption of the studied dyes on the AGS, according to the paper reported by Ncibi et al. [24]. The contributions of EPS in the process of biosorption were also evaluated, as shown in Figures 1A2-1C2. There was an overall decreasing trend for EPS contributions with increase of initial concentration of dyes. And EPS displayed a significantly greater contribution in the biosorpion of MB than MO and CR at the same concentration of dyes. It could be speculated that EPS have greater biosorption capacity for cationic dyes; similar result was obtained by Gao et al. [25].
| Total number of modules | No. of modules containing cell wall-associated genes | Maximum No. of genes in one module | Significantly related modules | Maximum No. of cell wall-associated genes in one module | |
|---|---|---|---|---|---|
| K-means cluster | 308 | 201 | 54 | 24 | 19 |
| Hierarchical cluster | 308 | 131 | 342 | 29 | 70 |
| Integrated cluster | 163 | 163 | 49 | 33 | 16 |
Table 1. Cluster analysis of Mycobacterium tuberculosis H37Rv gene expression
3D-EEM fluorescence spectra of EPS
To evaluate the effects of dyes on the characteristic of EPS, 3D-EEM fluorescence spectroscopy technology was applied in this experiment. Two major peak locations (Peak A and Peak B) in the initial EPS (Figure 2A) could be observed, which were located at the excitation/emission wavelengths (Ex/Em) of 275/355 and 222/355 nm, respectively. According to previous reports, the two peaks were identified as tryptophan Protein-like (PN-like) substances (Peak A) and aromatic PN-like substances (Peak B) [26,27]. Result demonstrated that EPS contains two fluorophores belonging to PN-like substances, which in accordance with previous study reported by Pan et al. [28]. All the fluorescence parameters of the spectra, including peak location, fluorescence intensity, are listed in Table S2. As shown in Table S2, the fluorescence intensities of these two major types of substances gradually decreased with the presence of dyes, implying that the two main components of EPS were quenched with the exposure of dyes. Additionally, the intensities of Peak A and Peak B of Sample 2 (Figure 2B) were most obviously quenched compared with other Samples. More detailed, the intensities of Peak A and B were decreased from 510.2 and 995.1 to 169.3 and 462.1, respectively. This result was consistent with that EPS had a highest biosorption capacity for MB in the biosorption test. In conclusion, 3D-EEM results indicated that the chemical binding occurred between EPS and dyes and further elucidated EPS played a certain role in the migration and removal of dyes in biosorption process.

Figure 2: 3D-EEM fluorescence spectra of sludge EPS before and after addition of different types dye: (A) Sample 1: control; (B) Sample 2: MB; (C) Sample 3: MO; (D) Sample 4: CR.
Synchronous fluorescence spectra
Synchronous fluorescence spectra are collected by simultaneously scanning excitation and emission wavelengths with a constant offset values (Δλ), which have been extensively used to analyze complex mixtures of fluorophores [29]. Figure 3 shows the synchronous florescence spectra of EPS before and after binding with a series concentration of MB, MO and CR with Δλ 60 nm. When Δλ is set at 60 nm, the synchronous fluorescence spectra can inform the characteristics of tryptophan residues in proteins [30,31]. Hence, the result revealed that the main contribution to fluorescence quenching of EPS was caused by tryptophan PN-like substance, which was agreement with the literature reported by Xu et al. [20]. As shown, with increasing concentration of three dyes from 0 to 50 mg/L, the fluorescence intensities of EPS gradually decreased, indicating that fluorescence quenching occurred between EPS and three dyes. Furthermore, the fluorescence intensity of MB-loaded EPS quenched from 850.81 to 21.77, which was more obviously quenched than other dyes-loaded EPS. This phenomenon was consistent with the result of 3D-EEM.

Figure 3: The fluorescence quenching spectra of EPS by different concentrations of: (A) MB; (B) MO; (C) CR.
Fluorescence quenching mechanism
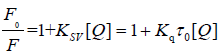
The fluorescence quenching: Fluorescence quenching process can be divided into two types, dynamic and static quenching. The former derived from collision between the fluorophore and quencher, while the latter was due to the complexation between the fluorophore and quencher [32]. The fluorescence quenching data can be modeled with Stern-Volmer equation Eqution (5):
 (5)
(5)
Where F0 and F represent the fluorescence intensities of EPS before and after addition of dyes, respectively, Ksv is the Stern- Volmer quenching rate constant, Kq denotes the biomolecular quenching rate constant, is the average lifetime of the molecule in the absence of quencher and is the concentration of the dyes [33]. The Stern-Volmer plots of the fluorescence quenching of EPS by three types of dyes were shown in Figures 4A-4C. The values of Ksv, Kq and R2 are summarized in Table S1 (See Supplementary material). It was clearly observed that the Stern-Volmer plots exhibited an upward curve, which indicated that both dynamic and static quenching may be involved in the fluorescence quenching of EPS by three types of dyes [34]. By fitting and calculating, the quenching rate constants for EPS by three dyes were 2.65 × 10¹³, 6.5 × 10¹², 1.62 × 10¹³ L/mol/s, respectively, which were obviously much greater than Kq of scatter procedure (2.0 × 10¹⁰ L/mol/s). In addition, at low concentrations of dyes, there is a linear relationship between F0/F and [Q] for three types of dyes. Thus, it could be speculated that the fluorescence quenching process of EPS may be governed by a static quenching mechanism at low concentrations of dyes.
The static fluorescence quenching process was further analyzed by the modified Stern-Volmer equation (6):
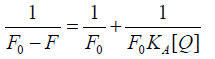 (6)
(6)
Figures 4G-4I show the curve of  vs. nlog[Q] and Table S2 (See Supplementary material) lists the binding constants
and binding sites for EPS quenched by three types of dyes. The binding constant is able to reveal the binding strength between
EPS and dyes, and the interaction is stronger with higher value of binding constant. As showed, the value of for EPS-MB system
was greater than, those for EPS-MO and EPS-CR systems, indicating that EPS have a higher binding strength for MB than other
dyes. Additionally, the values for the EPS-dyes systems were all >1 (1.30-1.76), suggesting that more than one class of binding
sites were present in fluorophores in EPS for three types of dyes [28].
vs. nlog[Q] and Table S2 (See Supplementary material) lists the binding constants
and binding sites for EPS quenched by three types of dyes. The binding constant is able to reveal the binding strength between
EPS and dyes, and the interaction is stronger with higher value of binding constant. As showed, the value of for EPS-MB system
was greater than, those for EPS-MO and EPS-CR systems, indicating that EPS have a higher binding strength for MB than other
dyes. Additionally, the values for the EPS-dyes systems were all >1 (1.30-1.76), suggesting that more than one class of binding
sites were present in fluorophores in EPS for three types of dyes [28].

Figure 4: Analysis of fluorescence quenching mechanism: Stern-Volmer plot of EPS with increased dosages of: (A)MB; (B) MO; (C) CR; Modified Stern-Volmer plot for the quenching of EPS with (D) MB; (E) MO; (F) CR; Plots of log [(F0-F)/F] versus log [Q] for binding of EPS with (G) MB; (H) MO; (I) CR.
2D-COS
2D-COS is a powerful data-handling method for analyze the complex spectrum, where spectral are difficultly distinguishable in one-dimension [36]. To obtain the structural variation information of EPS, 2D-COS was employed to the synchronous fluorescence with the addition of dyes as the external perturbation. In synchronous 2D-COS spectra (Figures 5A1-5C1), one major positive autopeak was observed, implying that the changes of spectra and dyes concentration are heading in the same direction [37]. Furthermore, the autopeak was identified at 281 nm (between 250 and 300 nm), which indicate that PN-like substrates were more susceptible to dyes addition [38]. In the meantime, the intensity of the autopeak was much higher for the MB-loaded EPS than MO-loaded and CR-loaded EPS, also showing that EPS was more obviously quenched by MB dye than MO and CR dyes.
The asynchronous 2D-COS spectra could provide further information about the sequence of the binding during dyes binding to EPS. As shown in Figure 5A2, one predominant positive cross-peak was shown at 271/287 nm, while two negative crosspeaks were appeared at 281/367 nm and 232/367 nm in the upper left corner of asynchronous map. It suggested that, based on Noda’s rule [39], the binding might occur sequentially in the following order: 367 nm>232 and 281 nm; 271 nm>287 nm. The same rule could be applied to the three major peaks of the MO-loaded EPS (Figure 5B2), in which one positive peak appeared at the wavelength of 281/303 nm, and two negative peaks were shown at 281/378 nm and 260/281 nm. It could be speculated that the change followed the order 378 nm>281>260 nm and 303 nm. Meanwhile, only one positive peak was observed in the upper left corner of asynchronous map of CR-loaded EPS. The positive signed peak of the EPS was observed at the wavelength pair of 281/334 nm, which indicated that the fluorescence quenching at 281 nm took place earlier than the one at 334 nm.

Figure 5: Synchronous 2D correlation maps generated from the synchronous fluorescence spectra of EPS w ith increased (A1) MB; (B1) MO; (C1) CR; and Asynchronous 2D correlation maps generated from the synchronous fluorescence spectra of EPS with increased (A2) MB; (B2) MO; (C2) CR.
FTIR spectra
FTIR analysis was conducted with raw and dyes-loaded EPS in order to identify functional groups of EPS involved in the biosorption and the results were shown in Figure 6. The broad absorptions peak around 3418 cm-1 was indicative of the existence of hydroxyl from polysaccharides and amino group from proteins [40]. The band near 1400 cm-1 was formed by the deformation vibrations of C-H in the methyl, whereas the band about 2926 cm-1 was formed by the stretching vibration of C-H in the aliphatic CH2- group [41]. The peaks around 1634 cm-1 were attributed to the stretching vibrations of C=O from proteins [42]. Bands near 1110 cm-1 reflected the existence of C-O from the carbohydrates and aromatics. As for peaks at approximately 615 cm-1 might be related with the phosphate group from the nucleic acid. Thus the results indicated the complex nature of EPS compositions, including, PN, PS, carbohydrates, nucleic acids, etc. When the EPS were loaded with the dyes, the spectrum exhibits some changes. A strong C=O stretching vibration initially presented at 1634 cm-1 was shifted to 1607, 1609 and 1620 cm-1 for MB, MO and CR-loaded EPS, respectively. The peaks for hydroxyl and amino group stretching near 3418 cm-1 also showed some changes, but it is difficult to distinguish which group causes the shift. The shifted functional groups of EPS samples were the main contribution for interaction between dyes and EPS.

Figure 6: FTIR spectra of raw EPS, MB-loaded EPS, MO-loaded EPS and CR-loaded EPS.
AGS was utilized as biosorbent for removing three types of dyes from aqueous environment in this study. Experimental results showed that AGS might have higher biosorption capacity for cationic dyes like MB dye. More important, fluorescence spectroscopy further elucidated EPS played a certain role in the migration and removal of dyes in biosorption process. The PNlike substrates of EPS were more susceptible to dyes addition according to 2D-COS. The results of FTIR indicated the complex nature of EPS compositions, including, PN, PS, carbohydrates, nucleic acids, etc. It is also expected that the possible mechanisms involved in dyes biosorption discussed this study could be applied to the practice for enhance the removal efficiency of dyes from aqueous environment.
This study was supported by the National Natural Science Foundation of China (21377046), Special project of independent innovation and achievements transformation of Shandong Province (2014ZZCX05101), Science and technology development plan project of Shandong province (2014GGH217006), Shanghai Tongji Gao Tingyao Environmental Science & Technology Development Foundation (STGEF) and QW thanks the Special Foundation for Taishan Scholar Professorship of Shandong Province and UJN (No.ts20130937).