International Journal of Innovative Research in Science, Engineering and Technology
ISSN ONLINE(2319-8753)PRINT(2347-6710)
ISSN ONLINE(2319-8753)PRINT(2347-6710)
| Gowthami.V and Ganesan.R TIFAC-CORE in Pervasive Computing Technologies, Velammal Engineering College, Anna University, Chennai, India |
| Related article at Pubmed, Scholar Google |
Visit for more related articles at International Journal of Innovative Research in Science, Engineering and Technology
Water covers over 70% of the Earth’s surface. It is an important resource for people and the environment. Water pollution affects fresh water, lakes and oceans all over the world. In many developing countries the main cause for death is increasing due to polluted water resources. So, it is mandatory to monitor and control the type of parameters depending on the use of water. Especially, for drinking water the chemical contaminations like Ph, TDS are more important. The methodology that is traditionally used for water contamination warning systems (WCWs) is the wireless sensor networks (WSN) which is used to monitor the water quality. In the previous methods the parameter values were constant till end and water sample is estimated for Ph alone. This proposes a Multisensor data fusion, which is applied for different parameters through enhancing MAP (Maximum a Posteriori) algorithm by measuring the parameters directly through sensors from which the time consumed also noted. Such fusion of parameters through MAP algorithm is simulated in MATLAB and is compared with other conventional fusion rules.
Keywords |
| water monitoring, data fusion, MAP algorithm, parameter estimation. |
INTRODUCTION |
| The polluted water may have undesirable color, odour, taste, turbidity, organic matter contents, chemical contents, toxic and heavy metals, pesticides, oily matters, industrial waste products, radioactivity, high Total Dissolved Solids (TDS), acids, alkalies, domestic sewage content, virus, bacteria, protozoa, rotifers, worms, etc. The organic content may be biodegradable or non-biodegradable. Pollution of surface waters (rivers, lakes, and ponds), ground water and sea water are all harmful for human and animal health. |
| In order to avoid such water pollution and contamination, we are going to design sensor fusion based algorithm for estimating the parameter value which gives the nearby value of each parameters. Data fusion is the process of integration of multiple data and knowledge representing the same real-world object into a fair, accurate, and useful representation. |
| Sensor fusion is the combining of sensory data or data derived from sensory data from disparate sources such that the resulting information is in some sense better than would be possible when these sources were used individually. The term in this case can better mean more accurate and complete, or very dependable, or refer to the result of an emerging view, such as vision of solid appearance. |
| The data sources for a fusion process are not specified to originate from similar sensors. One can distinguish direct fusion, indirect fusion and fusion of the output of the former two. Direct fusion is the process containing fusion of sensor data from a set of heterogeneous or homogeneous sensors and history values of sensor data, while indirect fusion uses data sources like a priori knowledge about the environment and human input. Sensor fusion is also known as (multi-sensor) Data fusion and is a subset of information fusion. |
RELATED WORKS |
A. Multisensor data fusion for water quality monitoring using Wireless Sensor Networks |
| The application of hierarchical wireless sensor networks in water quality monitoring is discussed. Adopting a hierarchical structure, the sensors set is divided into multiple clusters where the value of the sensing parameter is almost constant in each cluster. The members of cluster transmit their sensing information to the local fusion center (LFC) of their respective cluster, where using fusion rule, the received data is combined, and then possibly sent to a higher-level central fusion center (CFC).A two- phase processing scheme is also envisioned, in which the phase one is dedicated to detection in the LFC, and the phase two is dedicated to estimation in both the LFC and the CFC as shown in Fig. 2.1. |
| The focus of the paper is on the problem of decision fusion at the LFC, we propose hard-decision and softdecision maximum a posteriori (MAP) algorithms, which display flexibility in minimizing the total cost imposed by incorrect detections phase one. The proposed algorithms are simulated and compared with conventional fusion techniques. The Multisensor fusion described in the previous section provide the algorithmic means by which sensor data and their associated uncertainty models can be used to construct either implicit or explicit models of the environment. However, a Multisensor fusion system must include many other functional components to manage and control the fusion process. The organization of these is termed as Multisensor fusion architecture. |
 |
B. Multisensor data fusion: a review of the state-of-theart |
| There has been an ever-increasing interest in multidisciplinary research on Multisensor data fusion technology, driven by its adaptability and diverse areas of application. Therefore, there seems to be a need for an analytical review of recent developments in the data fusion domain. This paper proposes a comprehensive view of the data fusion state exploring its conceptualizations, benefits, and challenging features, as well as existing methodologies. In addition, several directions of research in the data fusion community are highlighted. |
| This paper is an endeavor to investigate the data fusion task, including its potential advantages, challenging aspects, existing methodologies, and recent trends. In particular, discussion of the existing data fusion methods relies on a data-centric taxonomy, and explores each method based on the specific data related challenging aspect(s) addressed. We also present less studied issues pertinent to data fusion, and discuss future avenues of research in this area. While several general and specific reviews of the data fusion literature exist; this paper is intended to provide the reader with a generic and comprehensive view of contemporary data fusion methodologies, as well as the most recent developments and emerging trends in the field. The bulk of data fusion research has been dedicated to problems associated with the first level of the Joint Directors of Laboratories (JDL) model. As work on low-level fusion becomes well established and approaches maturity, research on high level fusion tasks is gaining more attention. Discussion of new developments on high level fusion methodologies may be insightful; nonetheless, as the focus of this paper is on low level fusion. The Comparision of imperfect data fusion frameworks is shown in TABLE I. |
 |
C. Principles and techniques for sensor data fusion |
| This paper concerns a problem which is basic to perception: the integration of perceptual information into a coherent description of the world. In this paper we present identification as a process of dynamically maintaining a model of the local external environment. Fusion of identified information is at the heart of this process. After a brief introduction, we review the background of the problem of fusion in machine vision. We then present the fusion as part of the process of dynamic world modeling, and suggest a set of principles for the "fusion" of independent observations. These principles lead to methods which permit perceptual fusion with qualitatively different forms of data, treating each source of data as constraints. For numerical data, these principles lead to specific well known tools such as various forms of Kalman filter and forms of Mahalanobis distance. For symbolic information, these principles suggest representing objects and their relations as a conjunction of properties encoded as schema. |
| Dynamic world modeling is a cyclic process composed of the phases: match, predict and update. These three phases provide a framework with which we can organize and design perceptual systems. We show that in the case of numerical measurements, this framework leads to the purpose of a form of Kalman filter for the prediction and update phase, while a Mahalanobis distance is used for matching. In the case of symbolic information, objects of the framework can be constructed with schema and production rules. The framework for perceptual identified information is illustrated with the architectures of several systems as shown in Fig. 2.2. |
 |
| D. Real time survey on Chennai metropolitan water treatment plant, puzhal |
 |
IMPLEMENTATION AND RESULTS |
| Multisensor data fusion, which is applied for different parameters through enhancing MAP (Maximum a Posteriori) algorithm by measuring the parameters directly through sensors from which the time consumed also noted. |
a. Block diagram |
| A data fusion node collects the results from multiple nodes. It fuses the results with its own based on a decision criterion. Sends the fused data to another node/base station as shown in Fig. 3.1 and Fig. 3.2 .This explains that the various parameters value are collected from multiple nodes placed in watersheds and collected values are preprocessed using various statistical models. The resulting value sends to the data fusion station, which reduces the occurrence of error and again sends to Fusion center, which makes use of MAP algorithm to analyze exact value of such parameters like pH, TDS, etc. as shown in figures. |
 |
 |
| b. Methodology |
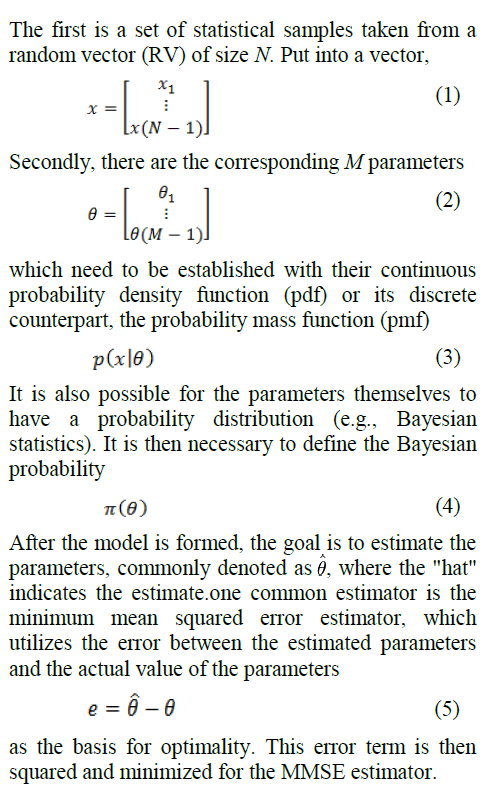
1. Estimation process |
| The entire purpose of estimation theory is to arrive at an estimator - preferably an easily implementable one. The estimator takes the measured data as input and produces an estimate of the parameters with the corresponding accuracy. It is also preferable to derive an estimator that exhibits optimality. Estimator optimality usually refers to achieving minimum average error over some class of estimators, for example, a minimum variance unbiased estimator. In this case, the class is the set of unbiased estimators, and the average error measure is variance (average squared error between the value of the estimate and the parameter). However, optimal estimators do not always exist. |
| These are the general steps to arrive at an estimator: |
| Step 1: In order to arrive at a desired estimator, it is first necessary to determine a probability distribution for the measured data, and the distribution's dependence on the unknown parameters of interest. Often, the probability distribution may be derived from physical models that explicitly show how the measured data depends on the parameters to be estimated and how the data is corrupted by random errors or noise. In other cases, the probability distribution for the measured data is simply "assumed", for example, based on familiarity with the measured data and/or for analytical convenience. |
| Step 2: After deciding upon a probabilistic model, it is helpful to find the theoretically achievable (optimal) precision available to any estimator based on this model. The Cramér– Rao bound is useful for this. |
| Step 3: Next, an estimator needs to be developed, or applied (if an already known estimator is valid for the model).There are a variety of methods for developing estimators; maximum likelihood estimators are often the default although they may be hard to compute or even fail to exist. If possible, the theoretical performance of the estimator should be derived and compared with the optimal performance found in the last step. |
| Step finally, experiments or simulations can be run using the estimator to test its performance. |
| After arriving at an estimator, real data might show that the model used to derive the estimator is incorrect, which may require repeating these steps to find a new estimator. A nonimplementable or infeasible estimator may need to be scrapped and the process started anew. Estimation theory can be applied to both linear and nonlinear models and is closely related to system identification and nonlinear system identification. In summary, the estimator estimates the parameters of a physical model based on measured data. |
| To build a model, several statistical "ingredients" need to be known. These are needed to ensure the estimator has some mathematical tractability instead of being based on "good feel". |
 |
| c. Enhanced Map algorithm |
| MAP stands for "Maximum A posteriori Probability". The MAP algorithm was first presented to the coding community on 1974 by Bahl, Cocke, Jelinik and Raviv. (It is also called as the BCJR algorithm in the memory of its discoverers). It is an algorithm for estimating random parameters with prior distributions. (With reference to decoding of noisy coded sequences, the MAP algorithm is used to estimate the most likely information bit to have been transmitted in a coded sequence). |
| The MAP method which enhanced minimizes the total probability of error plot. Two variants of MAP are described, based on soft decision (SD) and hard decision (HD) as shown in Fig. 3.3 respectively. Then, a Bayesian risk minimization approach is adopted to provide enhanced flexibility in managing different application requirements. |
 |
CONCLUSION AND FUTURE WORK |
| In this we conclude that, the importance of monitoring the contaminated water and Multisensor data fusion architectures with its fusion algorithms were studied. By using MATLAB, we have generated random pH values for parameters and neutral value of pH is plotted using Gaussian distribution. Generating such random samples is made simple using tools of probability distribution. |
| Further the fusion algorithm, Maximum a Posteriori (MAP) is enhanced using various fusion techniques. Such proposing enhanced MAP algorithms are simulated and compared with conventional fusion rules. The obtained results demonstrate that the modified MAP algorithms exhibit significantly better performance, particularly in terms of the achieved average cost. This shows that the proposed methods are compelling candidates for water quality monitoring applications. |
References |
|