Research & Reviews: Journal of Medical and Health Sciences
ISSN: 2319-9865
ISSN: 2319-9865
Department of Mechanical and Materials Engineering, Wright State University, Dayton, USA
Received date: 01/08/2017; Accepted date: 18/08/2017; Published date: 28/08/2017
Visit for more related articles at Research & Reviews: Journal of Medical and Health Sciences
Detailed blood flow information has been recognized as the key information for diagnosis of vascular diseases, such as vascular stenosis and aneurysms. Optical flow method (OFM) is an emergent technique as a tool to analyze the digital x-ray subtraction angiographic images of blood vessels to obtain the detailed blood flow distribution in vascular systems. A brief review is constructed to discuss the status, applicability, accuracy and future direction of the optical flow technique in the physical study of vascular flow.
Optical flow method, Blood velocimetry, Doppler sonography, Angiographic image processing
Diseases in the vascular system are still the leading cause of mortality and morbidity in developed countries despite considerable therapeutic progress in recent years. Hemodynamic characteristics, such as flow impingement, pressure and Wall Shear Stress (WSS), have been recognized as the key parameters in the initiation and development of various vascular diseases including vascular stenosis and aneurysms [1,2]. Blood flow velocity distribution is critical for the study of hemodynamics, especially for the wall shear stress assessment. X-ray video densitometric blood velocimetry is a method based on detecting the radioopaque contrast material in the blood flow and was widely used for blood flow rate and velocity measurements. The calculation of the movement of the contrast material is assumed to be a good representation of the blood flow in the field of view. The general X-ray video densitometric methods have been reviewed by Shpifoygel et al. [3]. The X-ray technology for in vivo imaging of function and form has been reviewed by Fouras et al. [4]. Digital x-ray subtraction angiography is a technique that the contrast medium image is produced by subtracting a “pre-contrast image” from the later images through using digital cameras; therefore, overlying structure besides the blood vessels can be avoided. Herein, digital x-ray subtraction angiography has many advantages over other methods in terms of image quality, spatial resolution, temporal resolution and accuracy [3,5]. Several types of algorithms including the flight-of-time type of algorithms, continuous velocity determination based on iso-density contours, inverted continuity equation algorithms and optical flow algorithms were utilized to estimate the velocity field from the digital x-ray subtraction angiographic images. In recent year, velocity assessment based on the digital x-ray subtraction angiography and optical flow method has drawn numerous research interests [6,7]. However, no reviews of literature on the particular subject of x-ray angiography velocimetry with optical flow method (OFM) can be found. In this paper, it is attempted to present a review on OFM for blood velocimetry based on digital x-ray subtraction angiography.
The OFM for angiographic image processing has been used since 1983 [6]. This led to multiple validation efforts using simulated image, in vitro and in vivo experiments. Amini [7] proposed the general optical flow method, which allows rotational flow components in the flow, and evaluated it on a flow phantom. Sugimoto et al. [8] presented an optical flow method by combining velocity smoothness constraint and maximum flow constraint (maintain outflow rate from a control volume less than the amount of contrast material in the control volume) to conduct velocity distribution measurements within an abdominal aneurysm [9,10]. Rhode et al. [11] developed the model-based optical flow algorithm and the weighted optical flow algorithm for 1D blood flow measurements. Pereira et al. [13,14] used a model-free optical technique to assess an internal carotid artery flow and compared the results with Doppler sonography data only in terms of volumetric flow rate. The method is only fairly validated for low contrast injection rate. Huang et al. [15,16] applied the optical flow method to simulated micro-vessel image sequences. The method was validated in 1-D fashion for low velocity measurement, and the validation is based on an in vitro experiment. Brina et al. [17] conducted illustrative comparison of optical flow and computational fluid dynamics based on digital subtraction angiography, and they concluded that the results from both methods were qualitatively consistent. None of the aforementioned methods are fully quantitatively validated for the assessment of detailed two-dimensional velocity map. The traditional OFM associated with the x-ray angiography also suffers from low frame rate and vulnerability to diffusion; thus, the accuracy and reliability of OFM cannot satisfy the clinical requirement [3].
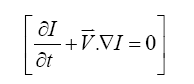
Optical flow algorithm was introduced by computer scientists to capture visual motion in digital images [18]. The governing equation was described as the apparent movement of brightness patterns in an image, an analogy to continuity equation for mass flow is used as follows:
 (1)
(1)
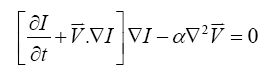
where I represents brightness in the optical image, t is time, V=(V1,V2)T is the 2D optical flow velocity and ∇ is the gradient operator. By adding additional smoothness constraints, two-dimensional velocity can be determined linearly. With a first order constraint function, the Euler-Lagrange equation was derived [18].
 (2)
(2)
where a is a Lagrange multiplier. The brightness constraint equation assumes that the image intensity remains invariant along a stream of images within a short time interval. This algorithm has been applied to recover blood velocity by several research groups [10-17].
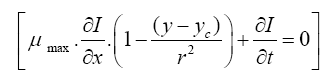
This governing equation was also simplified by several research groups through assuming one-dimensional flow (axisymmetric and parabolic) and non-divergence effect [19]. Then the governing equation becomes
 (3)
(3)
where umax is the maximum velocity along the direction vessel in the central position, r is the radius of the axisymmetric vessel and ye is the radial position of the centerline [20], x represents the coordinates along the vessel, y represents the coordinates along the radial direction.
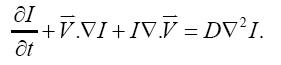
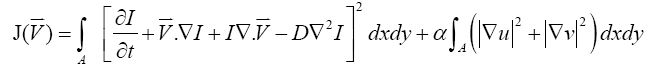
At this stage, the major problem in applying the optical flow method to physical fluid/blood measurement is that the connection between the optical flow method and fluid flow has not been established quantitatively. Therefore, these constraints fail to adequately capture the nature of fluid flow and are less clearly applicable to cerebrovascular flow [10-17]. Once this problem is solved, the optical flow method will be more appropriate for images of continuous patterns and will provide useful information for clinical diagnosis of vascular diseases. Recently, Liu and Shen [21] have proposed a physics-based optical flow equation, which considers the diffusion effect, physical boundary, accumulation effects and the non-zero divergence in the control volume with the purpose of building the connection between the optical flow and engineering fluid flow for typical flow visualization. The governing equation is proposed as:
 (4)
(4)
where IV and V represents the divergence effect of the optical flow, DV2I represents the diffusion effect of the quantity in the flow such as the contrast density. These two terms are highlighted because they are additional terms compared to Eq. (1). Accordingly, the function of total error in Eq. (4) to be minimized is defined as
 (5)
(5)
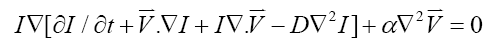
where a is the Lagrange multiplier, u and v are two components of the velocity. Using the calculus of variation, the vector Euler-Lagrange equation can be derived as:
 (6)
(6)
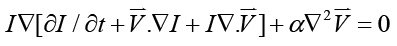
Most recently, Yang et al. [5] further studied the divergence-compensatory optical flow method by using an in vivo x-ray angiographic image and a second simulated image by superimposing a given flow field. In this study, the physical effect, i.e., diffusion effect was not simulated, but the divergence term was included in the governing equation. The non-zero divergence, i.e., I∇ ∙ V is mainly caused by the finite resolution problem (control volume defined by pixels), although theoretically, the term of ∇∙ V should be zero for incompressible flow. So, the governing equation becomes,
 (7)
(7)
Yang et al. [5] demonstrated a significant improvement in accuracy (6~7% error) by using divergence- compensatory OFM applied on the semi-simulated angiographic images of the arterial flow and the aneurysmal flow.
Optical flow method associated with x-ray angiography has its pros and cons. The high-spatial- resolution and excellent accuracy make it advantageous over all other methods. However, the accuracy of this technology is limited by large movements, i.e., the optical flow algorithm is inherently local processing. It requires the movement of each pixel is within 1 pixel to maintain the accuracy of the algorithm. According to Yang et al. [5], the maximum accuracy requires the movement to be around 0.5 pixels in the optical images. This limitation significant requires a fast imaging system. This particular requirement of a short time interval between two images challenges the current x-ray imaging system in two folds: 1. The maximum repetition rate of current commercial x-ray machine, such as the Siemens Artis Zee system, is about 15 Hz. Even though some high repetition rate x-ray systems (60 Hz-150 Hz) have been proposed and used for blood flow measurements, this rate is still not enough to satisfy the accuracy requirement of OFM [14,17]. It was calculated that a very high frame rate, e.g.10,000 Hz would satisfy the short time interval requirement [5]. 2. The high repetition rate brings another issue regarding the over exposure on the patient. For example, a 10,000 Hz x-ray will generate 667 times of exposure dose over the 15 Hz x-ray. Such a system cannot pass the rules of Food and Drug Administration (FDA). An alternative solution might be a double-pulse x-ray system, wherein the time interval between two pulses could be extremely short (in the scale of microseconds or even nanoseconds) and controllable. The advantage of such a double-pulsed system lies in the limited addition of exposure dose, i.e., only double of the exposure with the same frame rate. Unfortunately, there is no available commercial x-ray machine fitting in this need. Considering the over-exposure burden, a double-pulsed x-ray system might be promising to enable the wide application of OFM for mapping the blood flow in vascular systems.
Isotropic distribution of contrast agent in the x-ray angiographic image is another challenge for the processing in OFM, as demonstrated in a typical x-ray angiographic image of the internal carotid artery with an un-ruptured aneurysm in Figure 1. The non-distinct pattern in the brightness distribution would result in a very low gradient of intensity, which makes the calculation of OFM ill-suited. It was claimed that the isotropic feature in the x-ray angiographic image was the main source of error for the velocity estimation by using semi-simulated angiogram [5]. This shortcoming might be improved by introducing pulsatile injection of contrast agent while conducting the x-ray imaging [5]. The pulsatile injection will inherently produce high brightness gradient due to the wavy concentration of contrast material in the blood. On the other hand, safety-proof tracer particles were also recommended for the x-ray imaging, which might enable higher image quality and thus more precise assessment of the velocity distribution [5,22- 23].

Figure 1: A typical digital x-ray subtraction angiographic image of the right internal carotid artery (3D Digital subtraction angiography by using Semens Artis Zee with a repetition rate of 6 Hz, visipaque 300 contrast agent injected using the powered injector set as 3 ml/min and 5F Terumo angle taper catheter, the image acquired at 1 s after the injection).
X-ray angiography has its feature of transmittance imaging, which generates a 2D projection image of a 3D flow field, as presented in Figure 1. The mixing quality of the contrast agent in the flow region will affect the image quality (distinct pattern or isotropic distribution) and the 3D flow feature of the flow especially the motion perpendicular to the projection plane cannot be visualized. These are the coherent shortcoming of this technology. Both in vitro and in vivo studies are still needed to quantify the errors induced by the mixing difference of contrast agent and 3D flow feature. Tortuosity of some blood vessels also makes the x-ray imaging highly complex. Perspective angle for such a complex structure of blood vessels might be highly limited.
The optical flow method is capable of estimating the global velocity in the entire section of interest in the vascular system, while the accuracy is highly dependent on the time interval between sequential images, brightness patterns in the image, complexity of the flow characteristics including multi-scaled vessel diameters, multi-scaled velocity magnitude, 3D vertical flows, and turbulent flows, and tortuosity of blood vessels. However, once the accurate blood flow mapping is obtained, hemodynamic information such as WSS and impingements, could be derived as the key index for the diagnosis and treatment planning for multiple vascular diseases. It is also essential to validate many computational efforts on hemodynamics.