ISSN ONLINE(2319-8753)PRINT(2347-6710)
ISSN ONLINE(2319-8753)PRINT(2347-6710)
D. Sunitha1, S. Mahadeva Murthy2*, K.S. Divya3 and A. Ramalingam4
*Corresponding Author |
| Related article at Pubmed, Scholar Google |
Visit for more related articles at International Journal of Innovative Research in Science, Engineering and Technology
Water quality is a vital concern for mankind as it is directly linked with human welfare. With this knowledge, the present study was performed to assess the potability of drinking water in Mysore city. Water samples from different drinking water sources were collected and analyzed for physico-chemical and bacteriological parameters. Most of the water samples showed fecal contamination, total coliform count (MPN/100 ml) ranged between 2 and 1600 organisms/100 ml respectively. Raw water of the river showed fecal contamination of Escherichia coli, Klebsiella pneumoniae, processed water with Salmonella typhi and sewage mixed water with Salmonella typhi, Klebsiella pneumoniae and Citrobacter freundii. The results obtained were statistically analyzed.
Keywords |
| Water quality, sources of contamination, physico-chemical and bacteriological parameters, fecal contamination, coliforms |
INTRODUCTION |
| One of the things which make Earth a unique planet in this universe is continuous availability of water, a vital requisite for the existence of life. Water is also the essential prerequisite of agriculture and industrial production, the source of food needed for the survival of life. Thus, life on earth is entirely and exclusively dependent on water. Eventhough water covers more than 70% of the earth; only 1% of the earth’s water is available as a source of drinking. Yet, our society continues to pollute it (Sadhale, 2006). |
| The physico-chemical analysis of the underground water samples around sewage water treatment plant showed higher contamination of EC, TH, COD, nitrate, sulphate and trace metals in all underground water around sewage treatment plant (Shivaraju, 2011). |
| Water-related diseases continue as a major health problem globally. An estimated, four billion cases of diarrhea yearly represented 5.7% of the worldwide disease in the year 2000 (WHO, 2002). It has been reported that human fecal contamination is one of the main causes of water borne diseases. In 19 96, WHO therefore recommended regular testing of drinking water for thermotolerant coliforms and Salmonella sp. to ensure its complete absence. Organized structures of water supply and sanitation were completely destroyed by the flash flood of Pakistan in 2010. Escherichia coli was isolated in the water samples of (internally displaced person) IDPs campus and villages in Swat and Sukkur, 76% and 92% respectively (Baig et al., 2012). The majorities of the populations in developing countries are inadequately supplied with potable water and are thus bound to use water from sources like shallow wells and bore holes that have high potential of contamination and provide the unsafe water for domestic and drinking purposes (WHO, 2011). |
| Household water treatment practice may play a vital role in protecting public health where existing water sources, including those delivered via a piped network become contaminated during distribution or storage (UNICEF and WHO, 2009). The present study was aimed to investigate the physico-chemical and bacteriological water quality changes of various potable sources viz., processed and protected water supplies, tap water, near broken, underground water distributing pipes and river water in Mysore city. |
MATERIALS AND METHODS |
Study area |
| Mysore is the second largest city in Karnataka state, India. Mysore is located at 12°18’N 76°39’E 12.3°N 76.65°E and has an average altitude of 770 m (2,526 ft). It is situated in the southern region of the state of Karnataka, at the base of the Chamundi Hill and spreads across an area of 128.42 Km2 (50 sq mi). The highest temperature recorded in Mysore was 38.5°C (110°F) and in the winter as low as 9.6 have been recorded. The average annual rainfall received by the city is 798.2 mm (31in). Though Mysore is situated in the relatively safe seismic zone II, earthquake of magnitude greater than 4.5 on the Richter scale have been recorded in the vicinity of the city (http://en.wikipedia.org/wiki/Mysore). |
| The residents of Mysore city are served with processed water through a piped network. Overall work plan of this investigation is to find different sources of pollution, kind of pollution to drinking water and its microbiological study. Water samples were collected randomly over a period of one year from March 2011 to February 2012, as and when the source of contamination to drinking water was identified. Analysis of physico-chemical parameters of water samples like temperature (°C), pH, total dissolved solids (mg/l), total hardness (mg/l), chloride (mg/l), iron (mg/l), alkalinity (mg/l), electrical conductivity (μmho/cm), nitrate (mg/l) and fluoride (mg/l) were performed according to standard procedure (FAO,1997). |
| Bacteriological analyses were performed according to the standard methods prescribed by APHA (1995) and AWWA (1995). H2S test were carried according to updated protocol from Manja et al. (1982). Drinking water samples were collected at various sources like, raw water of river Kaveri collected at the right canal near Hongalli water treatment plant to analyze the water quality before entering the water treatment plant (Sample: 1= S1), processed water sample collected at High Level Reservoir- a secondary storage water tank, Yadavagiri (Sample: 2= S2) sewage contaminated drinking water collected at Mandi Mohalla where drinking water was mixed up with over flown drainage water (Sample: 3= S3), turbid water sample collected at Mandi Mohalla (Sample: 4= S4), processed water sample of Vani Vilas Water Works collected at leaking valve (Sample: 5=S5), sewage contaminated drinking water sample collected at Mahajana extension, Vijayanagar (Sample: 6=S6), processed water collected at broken water pipeline, Maharaja ground (Sample: 7=S7), processed water collected at a public water tap, Veeranagere (Sample: 8=S8), processed water collected at a public water tap, Ganeshnagar (Sample: 9=S9) and processed water collected at receiving point of secondary storage tank (CSR) Central Service Reservoir, Vijayanagara (Sample: 10=S10). |
| Samples collected from the above mentioned places were inoculated into H2S test bottles (K022-water testing kit) on the spot and incubated at 37ºC for 18-24 h in the laboratory for bacteriological analysis. Standard analysis of drinking water was performed by MPN method, reconfirmed by membrane filtration, total bacterial count was calculated and isolated pathogens were identified by biochemical tests. |
| Data were subjected to determine the statistically significant values using SPSS for Windows release 6.0 (Norusis, 1993). Pearson’s correlation coefficient was performed which showed correlation between different parameters. Using hierarchical cluster analysis or dendrogram interrelationship between the parameters was studied (Hammer et al., 2001). |
 |
RESULTS AND DISCUSSION |
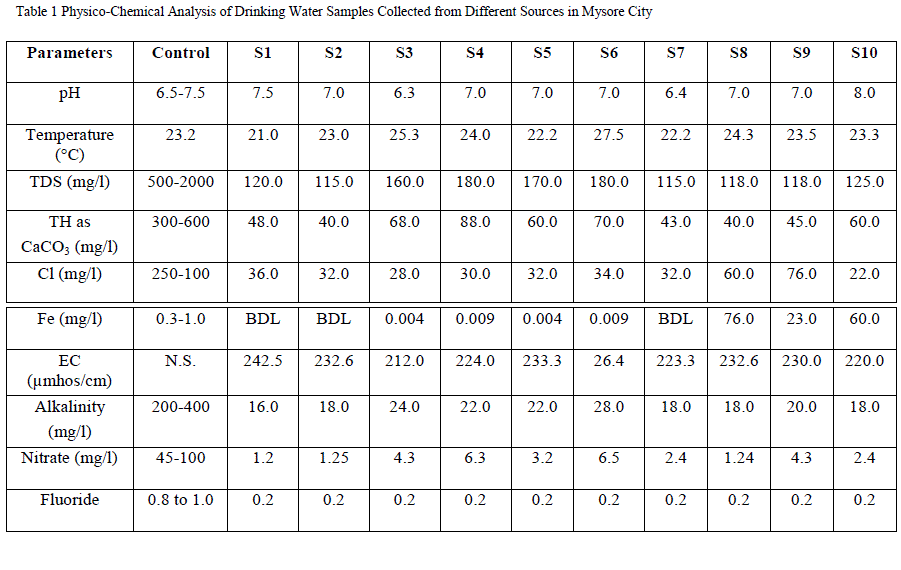
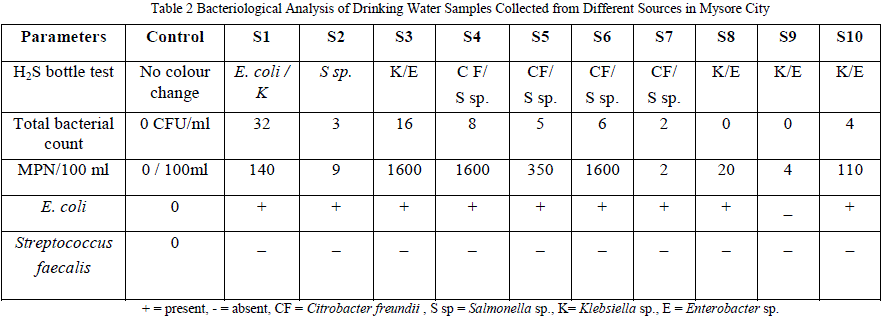
| The Drinking water samples collected from Mysore city were analyzed for physico-chemical and bacteriological qualities (Tables 1 and 2). Different sources of drinking water showed different type of contamination including few processed water sources also. |
 |
 |
| In the present investigation, total dissolved solids (TDS) values ranged between 120 and 180 mg/l. The results obtained are in good agreement with Shivaraju (2011) and the range was within acceptable level. |
| Total hardness (TH) values ranged from 43 to 88 mg/l and were within permissible limit. The concentration of TH values in the underground water samples around sewage treatment plant were slightly higher and had crossed the permissible limit The electric conductivity (EC) in levels of dissolved ionic substances in drinking water samples were within permissible limit and increased w ith the increase in calcium and magnesium level. The alkalinity of all water samples collected was slightly low. |
| Present study shows allowable chloride contents in all samples. The concentration of iron (Fe) was below detection level (BDL); except S3 and S6 with 0.004 mg/l and 0.009 mg/l of iron respectively which was slightly higher. |
| Alkalinity in natural waters is due to free hydroxyl ions and water with low alkalinity is more likely to be corrosive (Frank, 1987) and in the present study, level of alkalinity was found to be slightly low. The nitrate level in the present study was very low but ranged little higher in S3, S4 and S6 due to sewage discharge and turbidity in drinking water. The fluoride concentration was very low (0.2 mg/l) and negligible in all drinking water samples. |
| Assessment of water samples from different localities in Mysore city showed total bacterial count, a minimum of 2 CFU/ml in S7, S8 and a maximum of 32 CFU/ml in S1(Table 2). The total coliform bacteria ranged from 2 to 1600 MPN/100 ml in the collected water samples which exceeded when compared to the prescribed water quality standards in all samples except S7, S8 and S9. Fecal coliforms were present in all the samples except in S9. Raw water of the river showed fecal contamination of E. coli, K. pneumoniae, processed water with S. typhi and sewage mixed water with S. typhi, K. pneumoniae and C. freundii. |
Statistical analysis |
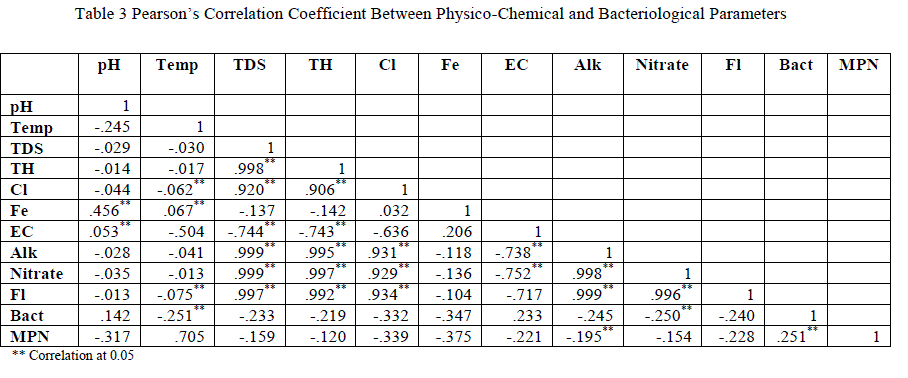
| Statistically, using Pearson’s correlation coefficient pH was found to be positively and significantly related to Fe (iron) and EC (Electronic Conductivity), temperature was found to be significantly and positively related to MPN (most probable number), TDS (total dissolved solids) was found to be significantly and positively related to TH (total hardness), Cl (Chloride), Alk (alkalinity), NO3 (nitrate) and Fl (fluoride) whereas, TDS was negatively and significantly related to EC. TH was found to be significantly and positively related to Cl, Alk, NO3 and Fl and inversely or negatively related to EC. EC was found to be inversely and negatively and significantly related to Alk, NO3 and Fl. Cl was found to be positively and significantly related to Alk, No3, Fl and inversely and significantly related EC. Alkalinity was positively and significantly related to NO3 and Fl and NO3 was positively and significantly related to Fl. Rest of the combinations were not significantly related to each other (Table 3). |
| Hierarchical agglomerative cluster analysis was performed on the normalized dataset. TH and MPN showed highest interrelationship among them (Fig. 2). |
 |
| In this study, it is found that levels of total coliform and E. coli were much high in unprocessed river water, sewage contaminated drinking water and turbid drinking water. Further, the pattern of total coliform and E. coli in processed water were very low but not permissible. |
CONCLUSION |
| The research work is an attempt to identify and assess different sources of contamination to drinking water. The physico-chemical analysis reveals the present status of drinking water quality is suitable for drinking purposes except in unprocessed water, sewage mixed drinking water and turbid drinking water. The quality of physico-chemical falls within the standard limits of WHO standards. T he drinking water of all collected areas has been contaminated by microorganisms and they were bacteriologically unsafe for drinking purposes. Periodic monitoring and continuous disinfection of drinking water at the site of each storage tank during supply is necessary. This indicates that the water of Mysore city and its vicinity is suitable for drinking purposes if processed water sources are protected hygienically. |
ACKNOWLEDGMENT |
| The authors are grateful to UGC, New Delhi for providing financial support. |
References |
|