ISSN ONLINE(2319-8753)PRINT(2347-6710)
ISSN ONLINE(2319-8753)PRINT(2347-6710)
| 1M. K. Gupta, 2Anjani Gupta,3G.S. Gupta,4Rajesh. Kr. Dubey |
| Related article at Pubmed, Scholar Google |
Visit for more related articles at International Journal of Innovative Research in Science, Engineering and Technology
Ground water quality of many hand pumps at different locations of Banda city was evaluated. In the light of above facts, the above study was designed to monitor the quality of ground water of Banda city. We collected data and information related to the ground water in the proposed locations for various purposes. We performed statistical analysis of the generated data. The physio-chemical parameters investigated were colour, temperature, turbidity, electrical conductivity, pH, D.O, T.D.S, total solids, alkalinity, total hardness, calcium hardness, magnesium hardness, chloride, sodium, potassium, sulphate, nitrate, phosphate, total nitrogen, fluoride and iron. The results were compared with drinking water quality standards prescribed by WHO. The above study will be useful to know the ground water quality and their subsequent fitness or unfitness of water for drinking domestic purpose at various sites undertaken. The study will be useful to the regulatory authorities and also to the policy makers towards Hand pumps study. Most of the water samples were found to have total alkalinity and hardness values more than their permissible level. The high values of these parameters may have health complications and therefore they need attention.
Index Words |
| Ground Water Pollution, T.D.S, Sulphate, Nitrate, Phosphate, Hand pumps |
INTRODUCTION |
| Water is the life force for the living organism. Water covers 71% of the Earth's surface, is vital for all known forms of life and there are various theories about the origin of water on Earth. On Earth, 96.5% of the planet's water is found in seas and oceans, 1.7% in groundwater, 1.7% in glaciers and the ice caps of Antarctica and Greenland, a small fraction in other large water bodies, and 0.001% in the air as vapor, clouds (formed of solid and liquid water particles suspended in air), and precipitation. Only 2.5% of the Earth's water is freshwater, and 98.8% of that water is in ice and groundwater. Less than 0.3% of all freshwater is in rivers, lakes, and the atmosphere, and an even smaller amount of the Earth's freshwater (0.003%) is contained within biological bodies and manufactured products. It possesses a number of physical and chemical properties that helps the molecules to act as best suited medium for the life activities. Most of the biochemical reactions that occur in the metabolism and growth of living cells involve water hence it has been referred to as universal solvent. Water is an essential natural resource and an absolute necessity for sustaining life. It is the lifeblood of the environment. Human beings solely depend upon the availability of fresh water for living and livelihood and in its natural state it is a ‘savior of life’. Today, by ignoring these facts, man is indiscriminately polluting water and unknowingly providing nature a complex situation. Most of our demand for water is fulfilled by rain water which gets deposited in surface and ground water resources. The quantity of this utilizable water is very much limited on the earth. Though, water is continuously purified by evaporation and precipitation, yet pollution of water has emerged as |
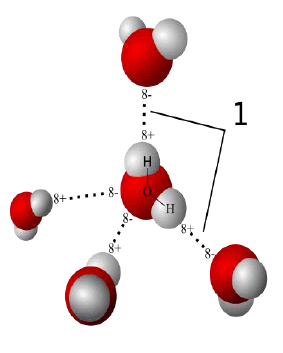 |
| one of the most significant environmental problems of the recent times. Not only there is an increasing concern for rapidly deteriorating supply of water but the quantity of utilizable water is also fast diminishing.Banda is a district place situated at 25o30I N latitude and 80018I E longitude and it is at the bank of river Ken. Banda is famous for its historical, mythological and religious significance. Wastewater produced by domestic activities contributes about 45% organic waste material along with some inorganic material and trace metals. Often this wastewater is discharged without any treatment in ground water. In recent years, an increasing threatto ground water quality due to human activities has become of great importance. The adverse effects on ground water quality are the results of man's activity at ground surface, unintentionally by agriculture, domestic and industrial effluents, unexpectedly by sub-surface or surface disposal of sewage and industrial wastes. The quality of ground water is of great importance in determining the suitability of particular ground water for a certain use (public water supply, irrigation, industrial applications, power generation etc.). The quality of ground water is the resultant of all the processes and reactions that have acted on the water from the moment it condensed in the atmosphere to the time it is discharged by a well. Therefore, the quality of ground water varies from place to place, with the depth of water table, and from season to season and is primarily governed by the extent and composition of dissolved solids present in it. The pollution in Banda city is increasing resulting from increase in organization and development. The 3D modelhydrogenbondsinwater are expressed in fig-1. |
MATERIAL AND METHODS |
| Eight hand pumps of Banda city were selected for the study. These were of JalSansthan (Mardan Naka), AtarraChungiChauki (Aliganj), Hanuman Temple (PiliKothi), Gular Naka, Kali Devi Temple (BabulalChauraha), Civil Line, AvasVikas, Indira Nagar. Detailed of hand pumps were given in Table 1. |
| Table-1; Details of Hand pump's Locations, Banda City (U.P.) |
 |
| The ground water sampling was done at morning time in May-June, 2012. High grade plastic bottles of one liter capacity were used for sample storage, which were thoroughly cleaned prior to filling with water samples. All parameters were analysed as per the prescribed standard methods for examination of water and wastewater (APHA- AWWA, 1998). |
RESULTS AND DISCUSSION |
| The intensive use of natural resources and the large production of wastes in modern society often pose a threat to ground water quality and have already resulted in many incidents of ground water contamination. Pollutants are being added to the ground water system through human activities and natural processes. Solid waste from industrial units is being dumped near the factories, which is subjected to reaction with percolating rain water and reaches the ground water level. The percolating water picks up a large amount of dissolved constituents and reaches the aquifer system and contaminates the ground water. The problem of ground water pollution in several parts of the country has become so acute that unless urgent steps for detailed identification and abatement are taken, extensive ground water resources may be damaged. The contamination of ground water by heavy metals and pesticides has also assumed great significance during recent years due to their toxicity and accumulative behaviour. These elements, contrary to most pollutants, are not biodegradable and undergo a global eco-biological cycle in which natural waters are the main pathways. The determination of the concentration levels of heavy metals and pesticides in these waters, as well as the elucidation of the chemical forms in which they appear is a prime target in environmental research today. |
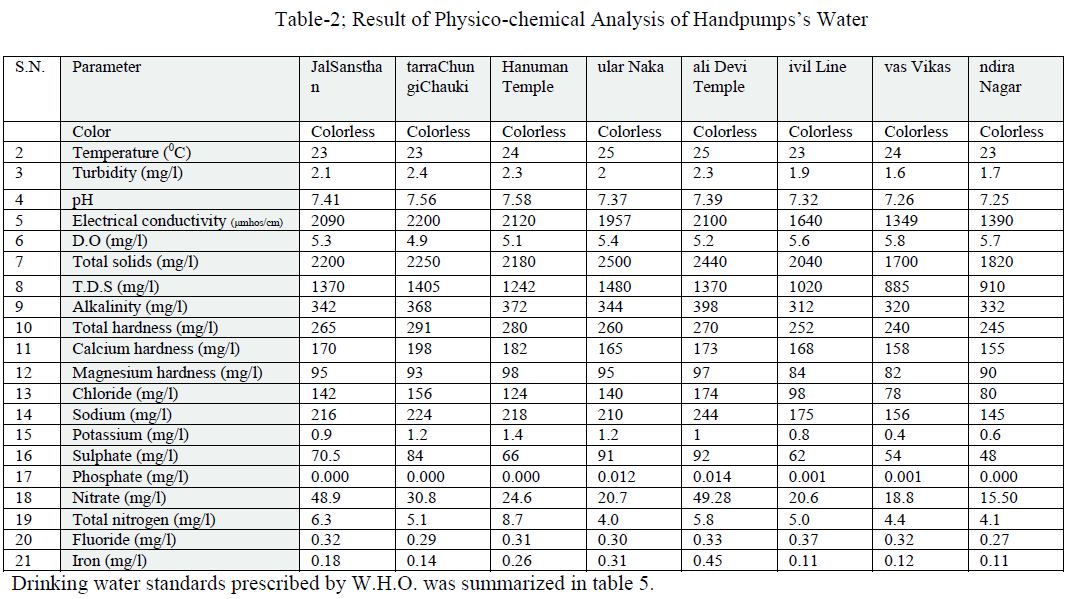
| Details of ground water locations were given in table 1. The results of physic-chemical monitoring of ground water samples of the selected hand pumps were mentioned in table 2. |
 |
Color,Temperature and Turbidity: |
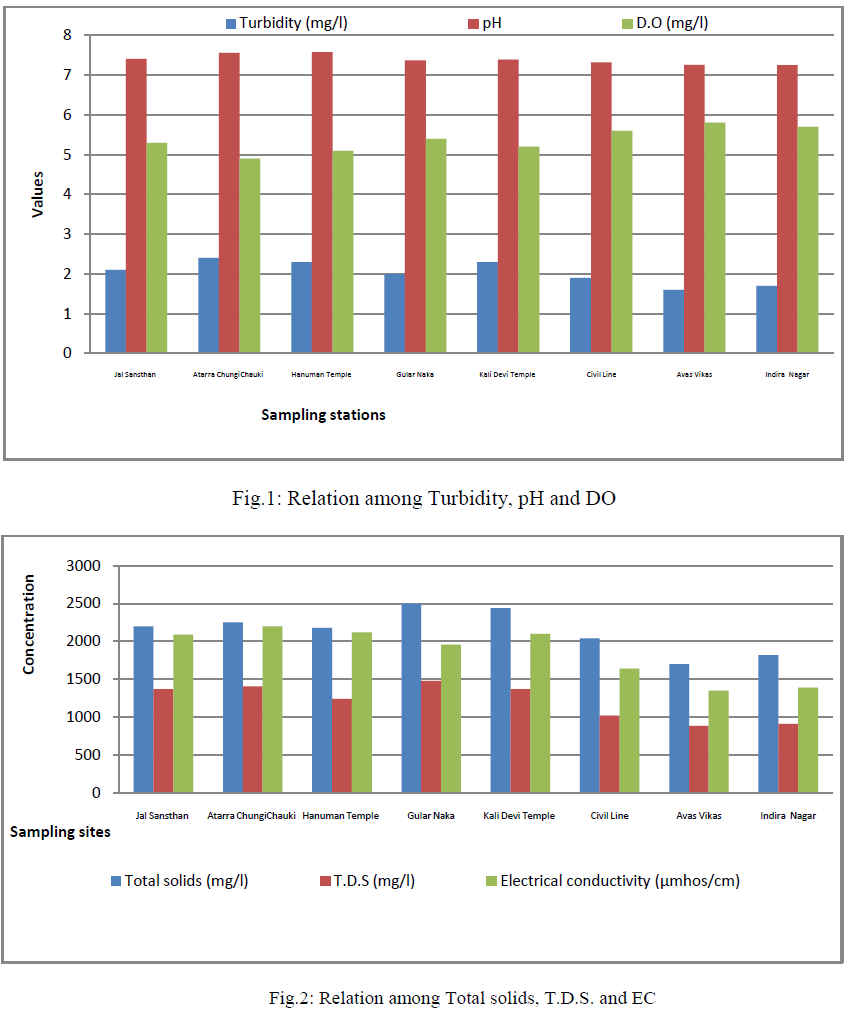
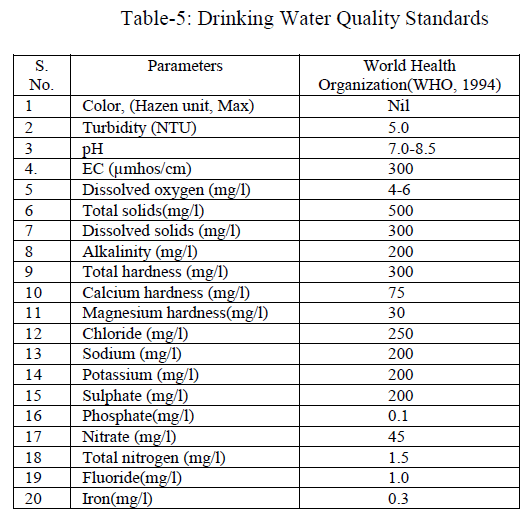
| Colour was estimated that all water samples were colourless. Colour adversely affects the water quality and also it is not aesthetically acceptable. Temperature recorded range was from 22 to 250C in all cases (Table 2). Turbidity is an important parameter of water quality analysis. It is caused due to presence of lots of number of suspended substances like peat, sludge, organic and inorganic matter, soluble colour organic compound, plankton and other micro substance etc., in water. The value of turbidity in the aforesaid water samples was found to be 2.0 to 2.4 NTU (Tables 2, fig.1); and the coefficient of variance for the turbidity was observed 14.3% only. |
 |
 |
 |
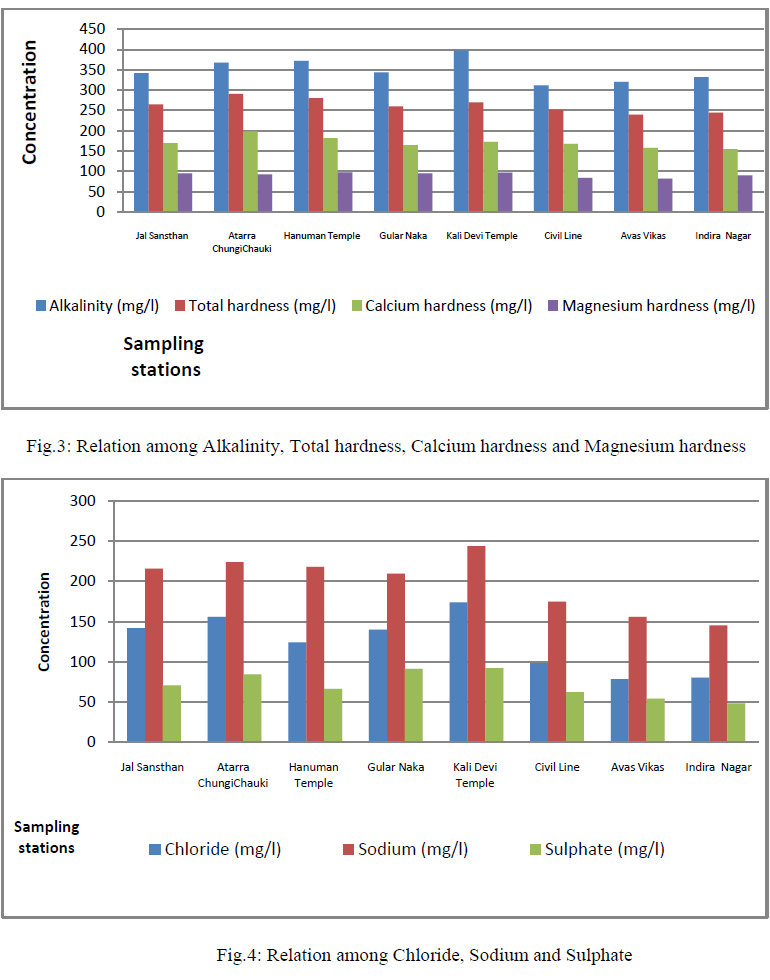
| pH, EC and Dissolved Oxygen: The pH value of all the water samples was varying from 7.25 to 7.58, its value was found to be greater than 7; hence the water samples were slightly alkaline in nature. These values were within the limits prescribed by WHO (Table 2, fig.1); and the coefficient of variance for pH was observed 1.6% only. Electrical conductivity value were found in the range of 1349- 2200 μmhos/cm (Table 2, fig.2) ; and the coefficient of variance observed for the EC was 18.59% only. These values were upper the limits prescribed by WHO. It showed that the river water will be suitable for drinking after filtration. Dissolved oxygen values were found in range of 4.9 to 5.8(Table 2, fig.1). The deep depth of hand pumps prevents low aeration results in short amount of dissolved oxygen [1]; and also the coefficient of variance for DO was observed 5.7% only. |
| TDS, Total solids: Total dissolved solids varied from 885 to 1480 mg/l (Table 2, fig.2); and the coefficient of variance for TDS was observed 19.62% only. It was more than the limit prescribed by WHO. Total solids varied from 1700 to 2500 mg/l (Table 2, fig.2); and the coefficient of variance for TS was observed 13.0% only. It was more than the limit prescribed by WHO [2]. |
| Alkalinity, Total hardness, Calcium hardness and Magnesium hardness: Alkalinity varied from 312 to 398 mg/l (Tables 2, fig.3); and also the coefficient of variance for alkalinity was observed 8.3% only. The carbonate alkalinity was absent; this indicated that the total alkalinity recorded due to accumulation of bicarbonate only [5]. The alkalinity appears to be due to natural sources, the water quality is good for drinking and domestic purposes after filtration. Total hardness varied from 240 to 291 mg/l (Tables 2, fig.3); and also the coefficient of variance for the total hardness was observed 6.6% only. Hardness of water is seemed to be the capacity of water for reducing and destroying the soap lather. Hardness in water is due to the natural accumulation of contents of calcium ions and magnesium ions and salts or both. The sum of the calcium and magnesium hardness is called total hardness. The high value of total hardness was found due to the availability of limestone rocks in the surrounding area consequently more solubility of calcium and magnesium salts under anaerobic conditions [7] and [6]. Its value was within the limit prescribed by WHO. The total hardness appears to be due to natural sources so the water quality is good for drinking and domestic purposes after filtration. Calcium hardness ranged from 155 to 198 mg/l (Tables 2, fig.3); and also the coefficient of variance for the turbidity was observed 8.0% only. Magnesium hardness ranged from 82 to 98 mg/l (Tables 2, fig.3); and also the coefficient of variance for the turbidity was observed 6.4% only. |
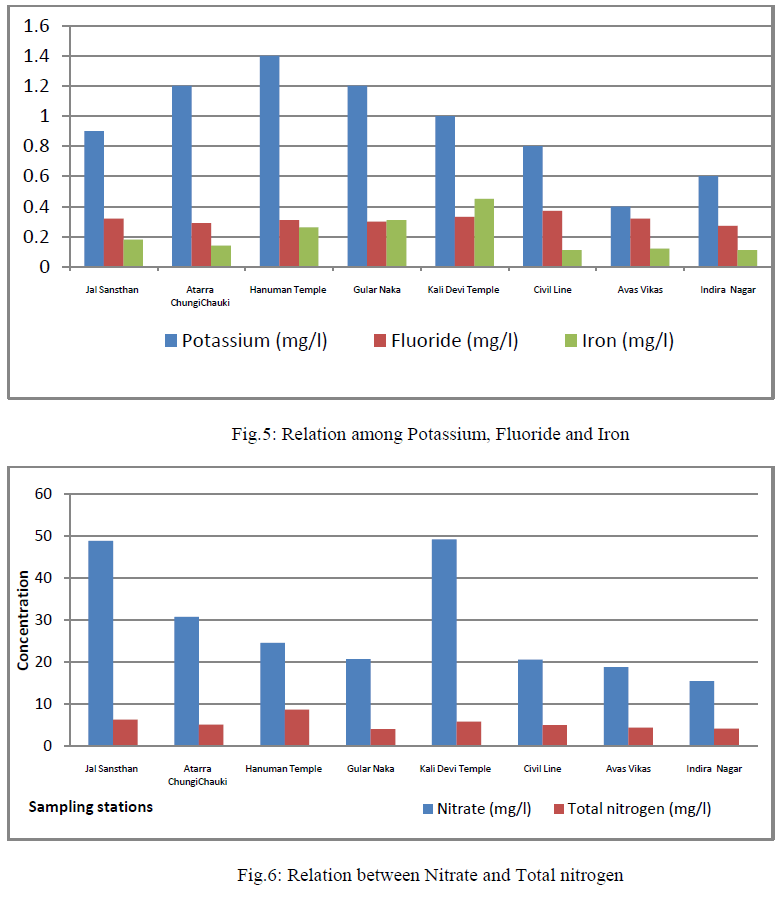
| Chlorine, Sodium and Potassium: The amount of the chloride present in the ground water samples ranged from 78-174 mg/l (Table 2, fig.4); and also the coefficient of variance for chlorine was observed 28.64% only. High chloride reacts with sodium and makes water salty in taste, which in unacceptable for human consumption. It also increases the total dissolved solid values thereby affecting the quality of water. Sodium ranged from 145 to 316 mg/l (Table 2, fig.4); and also the coefficient of variance for sodium was observed 0.178% only. Its value was more than the limit prescribed byWHO. Potassium ranged from 0.4 to 1.4 mg/l (Table 2, fig.5); and also the coefficient of variance for potassium was observed 35.57% only. |
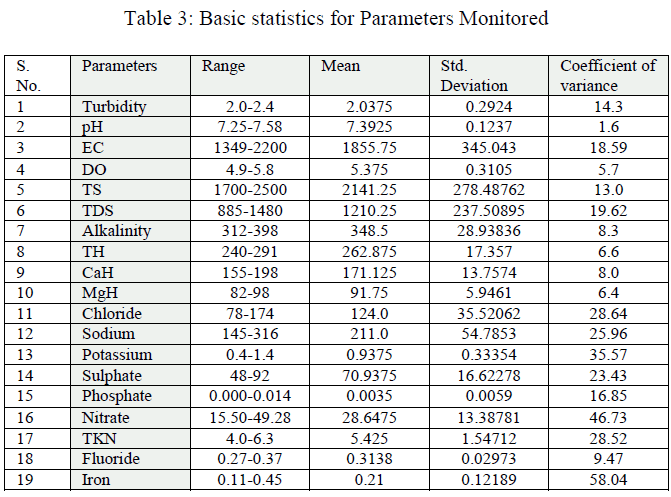 |
| Sulphate, Phosphate and Nitrate: Sulphate varied from 48 to 92 mg/l (Table 2, fig.4); and also the coefficient of variance for sulphate was observed 23.43% only. They found that water was used for domestic and irrigation purposes. Phosphate varied from 0.000 to 0.014 mg/l; and also the coefficient of variance for phosphate was observed 16.85% only. Nitrate varied from 15.50 to 49.28 mg/l(Table 2, fig.6); and also the coefficient of variance for nitrate was observed 46.73% only. Its values were upper the limits prescribed by WHO. They observed that surface and ground water of Rajgangpur part II was suitable for domestic and irrigation purposes [4]. |
| Total nitrogen, Fluoride and Iron: Total nitrogen varied from 4.0 to 6.3 mg/l(Table 2, fig.6); and also the coefficient of variance for total nitrogen was observed 28.52% only. Fluoride varied from 0.27 to 0.37 mg/l; and also the coefficient of variance for the fluoride was observed 9.47% only. These values were within the limits prescribed by WHO. Iron value varied from 0.11to 0.45 mg/l(Table 2, fig.5); and also the coefficient of variance for iron was observed 58.04% only. The values of iron concentration in all the samples were upper the prescribed limit for potable water. Iron concentration in water more than 2.0 mg/l causes staining on clothes, sanitary ware and imparts bitter astringent taste. The linear correlation coefficient (r) has a value between +1 & -1. |
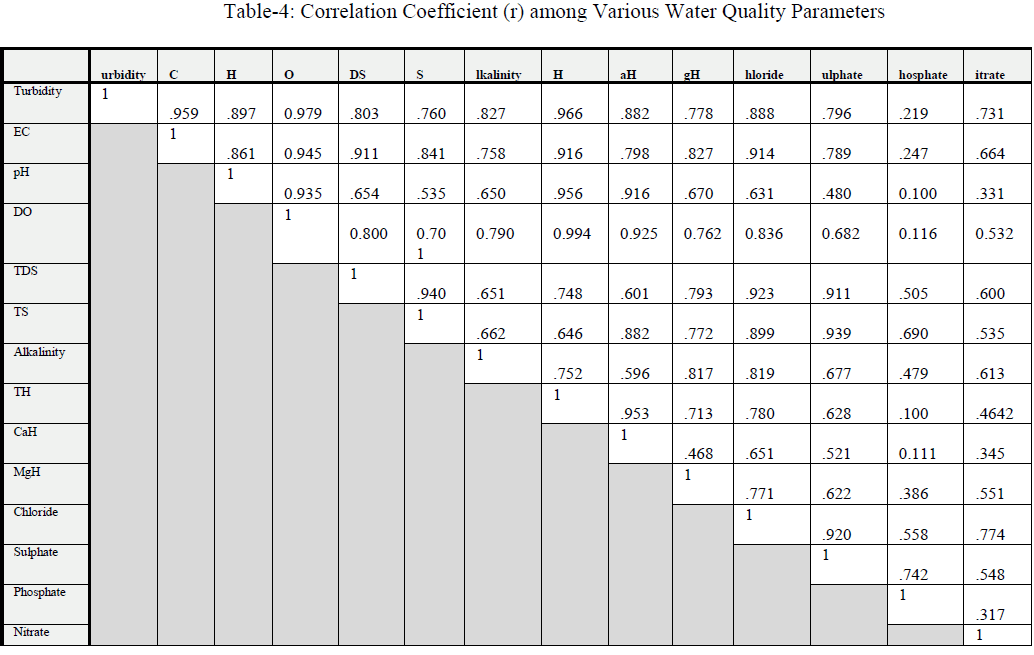 |
| The value of +1 represents a perfect positive correlation and -1 represents a perfect negative correlation. The correlation between the parameters is characterized a strong when it is in the range of +8.0 to +1.0 and -8.0 to -1.0, moderate, when it is having value in the range of +0.5 to +0.8 and -0.5 to -0.8, and weak it is in the range of 0.0 to 0.5 and +0.0 to -0.5. |
 |
| The value of coefficient of variance and correlation coefficients (r) among various water quality parameters calculated by Statistical Programming System Software (SPSS) were given in table 3 & 4. Out of the 105 correlation coefficient, 30 strong correlation between Turbidity and EC (0.959), Turbidity and pH (0.897), Turbidity and DO ( -0.979), Turbidity and TDS (0.803), Turbidity and alkalinity (0.827), Turbidity and total hardness (0.966), Turbidity and calcium hardness (0.882), Turbidity and chloride (0.888), EC and pH (0.861), EC and DO (-0.945), EC and TDS (0.911), EC and TS (0.841), EC and Total hardness (0.916), EC and magnesium hardness (0.827), EC and Chloride (0.914), pH and DO (-0.935), pH and TH (0.956), pH and Calcium hardness (0.916), DO and TDS (-0.800), DO and TH (-0.994), DO and Calcium hardness (-0.925), DO and chloride (-0.836), TDS and TS (0.940), TDS and chloride (0.923), TDS and sulphate (0.911), TS and chloride (0.899), TS and sulphate (0.939), Alkalinity and magnesium hardness (0.817), Alkalinity and chloride (0.819), TH and calcium hardness (0.953) were found to be strong correlation. Correlation coefficient between Turbidity and TS (0.760), Turbidity and magnesium hardness (0.783), Turbidity and sulphate (0.796), Turbidity and nitrate (0.731), EC and alkalinity (0.758), EC and calcium hardness (0.798), EC and sulphate (0.789), TDS and TH (0.748), TDS and magnesium hardness (0.793), TS and alkalinity (0.662), TS and TH (0.646), TS and magnesium hardness (0.772), Alkalinity and TH (0.752), TH and magnesium hardness (0.713), Magnesium hardness and chloride (0.771) were found to be moderate correlation. Correlation coefficient between Turbidity and phosphate (0.219), EC and phosphate (0.274), Alkalinity and phosphate (0.479), Magnesium hardness and phosphate (0.386) were found to be weak correlation. Dissolved Oxygen was found with negative correlation with other parameters. |
CONCLUSION |
| A vast majority of ground water quality problems are caused by contamination, over-exploitation, or combination of the two. Most ground water quality problems are difficult to detect and hard to resolve. The solutions are usually very expensive, time consuming and not always effective. Ground water quality is slowly but surely declining everywhere. Ground water pollution is intrinsically difficult to detect, since problem may well be concealed below the surface and monitoring is costly, time consuming and somewhat hit-or-miss by nature. The contamination of ground water by heavy metals and pesticides has also assumed great significance during recent years due to their toxicity and accumulative behaviour. These elements, contrary to most pollutants, are not biodegradable and undergo a global eco-biological cycle in which natural waters are the main pathways. The determination of the concentration levels of heavy metals and pesticides in these waters, as well as the elucidation of the chemical forms in which they appear is a prime target in environmental research today. The above study indicates that ground water quality of the selected hand pumps are almost good, consequently water is fit for drinking and other domestic purposes. Occurrence of lime stone and dolomite rocks produced hardness and alkalinity in the study area. These results must be shared with people of the area and necessary remedial cure must be suggested to them to improve the water quality more. These data may also be shared with public health engineering authorities in order to upgrade the quality of water for a safe and healthy life. |
References |
|