ISSN ONLINE(2319-8753)PRINT(2347-6710)
ISSN ONLINE(2319-8753)PRINT(2347-6710)
Manohar.G.N 1, Harish Raju .M 2, Sripathy L 3 and Renuka C 4
|
| Related article at Pubmed, Scholar Google |
Visit for more related articles at International Journal of Innovative Research in Science, Engineering and Technology
Eight groundwater samples of Chintamani Taluk of Chikkaballapur District were analysed for the Physicochemical properties like pH, TDS, EC, Alkalinity, Total Hardness, Ca++, Mg++, NO3 -, SO4 2-, F- and Pb following the standard guidelines of APHA (1998). Out of eight ground water samples six samples were found to have nitrate level above the permissible limit (45mg\L), all the fluoride levels close to the permissible limit (1.5 mg\L). Six samples were found to have Pb level greater than the permissible limit (0.01 mg\L). The above mentioned water quality variables are hazardous to the biological system which emphasises the need for improvising the water quality.
Keywords |
| Groundwater, Chintamani Taluk, Nitrate, Fluoride, APHA (1998) |
INTRODUCTION |
| Abiogenesis was theorised mainly by Miller, Uray and Alexander Oparin. Their theories have indicated the origin of the first life forms in water, from inorganic molecules through polymerization. Water became the primary medium for the birth of life on earth three million years ago. When we look at the present scenario, we must realize that the water quality is deteriorating due to several factors such as urbanization, industrialization, etc. As our earth is a closed system, the quantity of water has remained the same over billions of years but most of the fresh water is in the form of glaciers and only about 1% of it is available as potable water which is largely stored beneath the surface in Aquifers. As agriculture is the backbone of our nation, groundwater is the major source of irrigation in many parts of India [1]. Excessive use of chemical fertilizers to increase the agricultural yield paves a way to leaching of chemicals and percolation which degrades the chemical composition of the groundwater [2,3]. To overcome the problems such as increased human consumption, poor quality and scarcity of water, judicious management and recycling of water are mandatory. As the demand for the usable water is much greater than the availability and the quality is also degrading by human activities, there is a dire need to maintain the quality and security of water to meet the demands. Approximately, 33% of the Indian villages have no access to fresh water. Polluted water with organic wastes provides a congenial environment for the pathogens. In India, Diarrhoea is responsible for the death of approximately 1.8 million children in a year. Due to water related diseases 6-8 million people die in a year around the world. As water plays a vital role for the sustenance is life, its proper maintenance and conservation is strongly recommended |
STUDY AREA |
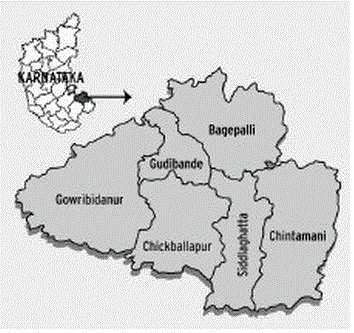
| Karnataka state has seven major rivers , the total water resources of all the seven river basin is estimated to 7663 TMC and groundwater availability in the state is estimated to 485 TMC, the study area is not situated in the above said seven river basin of the state, it is completely dependent on small lakes and aquifers. Chikkaballapur district lies in the south eastern part of Karnataka. Chintamani is one of the six taluks of the above said district. The taluk has a land area of 3,287,293 km2, and its geographical location being 13.4° North latitude, 78.07° East longitude. It is situated 865 m above the sea level and bounded by Sidlaghatta in the West, Bagepalli in the North – West, The Morphological gradient is an edge-strength extraction operator that gives symmetric edges between foreground and background regions. |
METHODOLOGY |
 |
| Groundwater samples for analysis were collected from eight different stations of Chintamani taluk during the period of monsoon 2013. The samples were collected in pre cleaned black coloured polythene cans of 5L capacity. The cans were rinsed with the sampling water before the collection. (As per APHA 1998). The samples were transported to the laboratory with the necessary precautions. The physical parameters such as Temperature, pH, EC and the chemical parameter DO were estimated on the spot using Systronics water analyser – 371 instrument. The chemical parameters such as Total Hardness, Chloride, Alkalinity and Calcium were estimated by titrimetric method in the laboratory of Vivekananda Degree College. The Alkali metals such as Na+ and K+ were analysed using Flame Photometer FPM – 128 of Systronics make. Nitrate and Sulphate (turbidimetry) were estimated using the Spectrophotometer- Elico make,Fluoride was estimated using Tintometer (Multidirect Spectrophotometer of UK) in the laboratory of Atria Institute of Technology. |
RESULTS AND DISCUSSION |
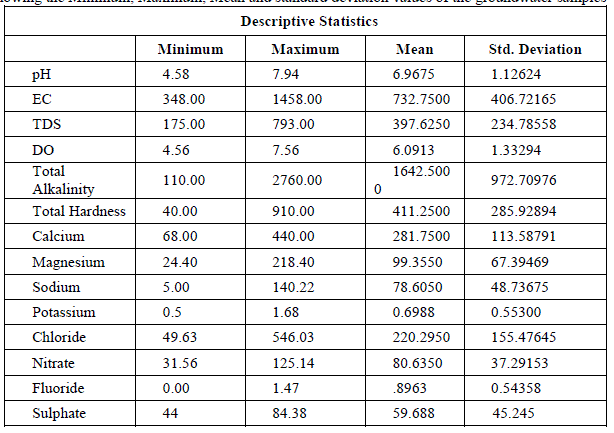
| pH: pH measures the alkalinity or acidity of water. pH values of the samples ranged from 4.58 to 7.94 and the mean value was found to be 6.97 as shown in table-1 and depicted in graph-1, as shown in table . An alarming pH value of pH 4.58 was observed in groundwater sample collected from Anjani Extension. All the other samples were within the permissible limit of WHO (1993). pH showed a positive correlation with EC, TDS, DO, Total Alkalinity, Total Hardness, Ca++, Mg++, Na+, NO3 - and F- and negative correlation with K+, Cl+ and SO4 2- as shown in the table III |
 |
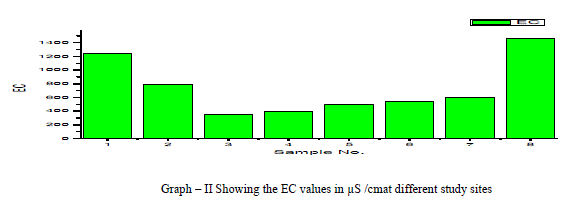
| Electrical Conductance (EC): Electrical Conductivity is the measure of the conductance of the water which is due to the total dissolved solids in water, in the present research EC values ranged from 348 to 1458 micro S /cm, the average value of EC reported is 732.75 micro S /cm as shown in the table 1 and Graph – II. Electrical Conductivity showed a positive correlation with pH as shown in the table III. |
 |
| Total Dissolved Solids (TDS): Total dissolved Solids is directly related to EC. The water containing TDS more than 1000 mg/L becomes unacceptable according to WHO as it affects the palatability. In the present research, the TDS values ranged from 175 to 793 mg/L, with an average TDS value of 398 mg/L as shown in the table-I and Graph - III. 38% of the groundwater samples indicated TDS values above the prescribed permissible limits of WHO for drinking water standards (1993). TDS showed a positive correlation with DO, Total alkalinity, Total Hardness, Ca++, Mg++, Na+, Cl-, and NO3 -and showed negative correlation with K+ and SO4 2- as shown in table III. |
 |
| Dissolved Oxygen: The amount of Oxygen dissolved in water is referred to as DO, it represents the quality of water. The concentration level of DO in water is dependent on the physical, chemical and Biochemical activities available in the water body. DO is an important factor for the dissolution of inorganic substances in water [4]. In the present investigation the DO values ranged between a minimum of 4.56 mg/L and a maximum of 7.56 mg/L with an average value of 6.1 mg/L as shown in the table-I and graph- IV. DO showed a positive correlation with Ca++, Mg++, Na+, K+, Cl-, NO3 -, and F- and negative correlation with Total Alkalinity, Total Hardness and SO4 2- as shown in the table-III. |
 |
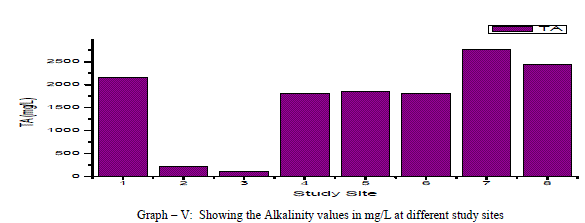
| Total Alkalinity: Alkalinity is a measure of the capacity of the water to neutralize the acids. Alkalinity is caused due to the presence of bicarbonates, carbonates and hydroxides. In the current findings, the alkalinity ranged from 110mg/L to a maximum of 2760 mg/L with an average of 164.25 mg/L as shown in the table-I and graph-V. 75% of the samples under examination showed total alkalinity values above the permissible limits of WHO for drinking water (1993). Alkalinity is positively correlated with pH, EC and TDS and negatively correlated with DO as shown in the table-III. |
 |
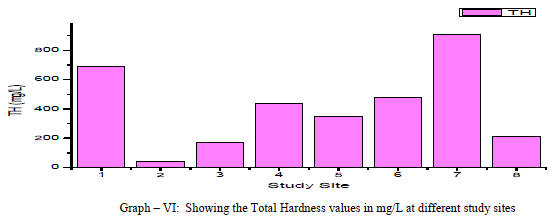
| Total Hardness: Total Hardness is caused by the divalent metal ions and mainly due to the presence of Ca++ and Mg++ ions in the groundwater. In the current study, the total hardness of the groundwater samples varied from a minimum of 40.0 mg/L to a maximum of 910.0 mg/L with a mean of 411.25 mg/L, as shown in table-I and graph-VI. 75% of the samples had the total hardness values above the permissible limits of BIS (1998) for drinking water. Total hardness showed a positive correlation with Ca++, Mg++, Na+, NO3 -, F- and SO4 2- and negative correlation with Cl- and SO4 2-. As shown in table-III. |
 |
| Calcium: In general, Calcium content in groundwater is greater than Mg. It is a major component of most Igneous, metamorphic and sedimentary rocks. The range of calcium content in groundwater is largely dependent on solubility of Calcium carbonate, Calcium Sulphate and also Calcium chloride. In the present findings, Calcium values ranged from a minimum of 68 mg/L to a maximum of 440 mg/L with a mean of 281.75 mg/L as shown in the table-I and graph-VII. 90% of the samples under examination have Ca values above the permissible limits of WHO (1993). Ca showed a positive correlation with Mg++, Na+, k+, NO3 -, and F-and a negative correlation with Cl- and SO4 2- as shown in the table- III. Magnesium: Magnesium is an important component of the basic igneous rocks such as Dunites, Pyroxenites and Amphibolites and Volcanic rocks. In the present pursuit Mg content varied between a minimum of 24.40 mg/L and a maximum of 218.40mg/L with a mean value of 99.4 mg/L. as shown in table-I and graph-VII. 63% of the samples have the Mg values above the permissible limits of WHO (1993). Mg showed a positive correlation with Na+, K+, NO3 -, F- and SO4 2- and negative correlation with Cl-. As shown in the table-III. |
 |
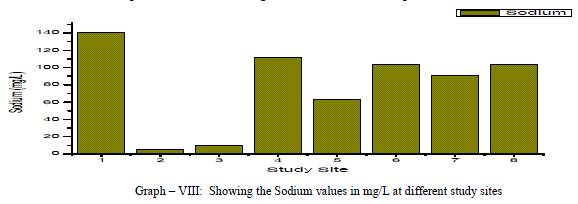
| Sodium: Sodium occurs in nature in combined state, and it is largely distributed and occupies about 2.6% of the earth’s crust. The role of Sodium is important in Agriculture and human pathology. High Sodium content present in the groundwater in the form of Chloride and sulphate makes the water salty and is unfit for the human consumption [5]. It is an essential element in living organism. In the present investigation, the sodium values are varied from a minimum of 5.0 mg/L to a maximum of 140.22 mg/L, the mean is found to be 78.61 mg/L as shown in the table-I and graph-VIII. All the samples have the Na values below the permissible limits of WHO (1993). Sodium showed a positive correlation with Fluoride, Nitrate and sulphate, it showed a negative correlation with potassium as showed in the table III |
 |
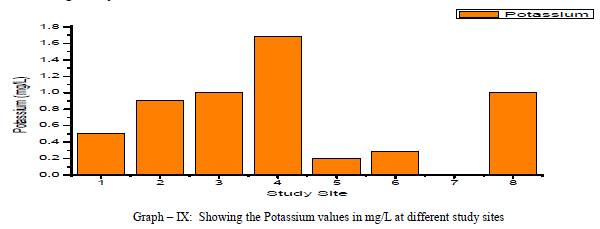
| Potassium: Potassium is an Alkaline Earth metal which dissolves in water mainly from agricultural leaching. Potassium levels in the groundwater samples varied from a minimum of 0.5 to a maximum of 1.69 mg/L with an average of 0.7 mg/L as shown in the table-I and graph-IX. Potassium is positively correlated with Calcium and Magnesium and negatively correlated with, EC, TDS, and Total Hardness as shown in the table-III |
 |
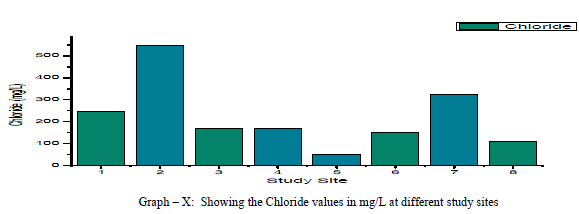
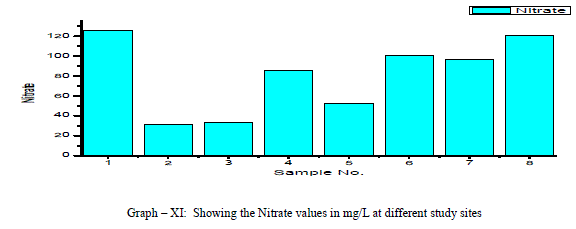
| Chloride: Chloride originating from NaCl gets dissolved in water from rocks and soil, NaCl has little effect on suitability of water, the removal of NaCl from water is difficult and not economical. In the present study, Chloride ranged between a minimum of 49.63 mg/L and to a maximum of 546.03 mg/L with a mean of 220.3 mg/L as shown in the table-I and graph-X. 38% of the samples have the Chloride values above the permissible limits of WHO (1993). Chloride is positively correlated with EC, TDS and Potassium, and negatively correlated with Total Hardness, Total Alkalinity, Magnesium and pH as shown in the Table-III Nitrate: The most oxidised form of Nitrogen is Nitrate [6]. Nitrate values of the groundwater samples vary from 31.56 to 125.14 mg/L with an average of 81 mg/L as shown in the table-II and as depicted in the graph-XI. 75% of the samples have NO3 - values above the permissible limits of BIS (1998), indicating that the groundwater samples are nonpotable. Nitrate has a positive correlation with pH, EC, TDS, Total Hardness and negatively correlated with K+ and Cl- as shown in the table-III. |
 |
| Fluoride: Free fluorine is found little in nature due to its high reactivity, it is found as fluorides [7]. Fluoride enters in to the groundwater when it flows through the bedrock having fluoride minerals such as Cryolite, Fluorite, Fluorspar etc. [8,9,10]. Fluoride values of the groundwater samples varied from 0 to a maximum of 1.47 mg/L, with an average of 1.02 mg/L as shown in the table-II and Graph-XII. All the samples have the Fluoride values close to the permissible limit of (WHO 1993). Fluoride is positively correlated with pH, EC, TDS, total hardness, total alkalinity, calcium and magnesium. It is negatively correlated with potassium and chloride as shown in the table-III. |
 |
| Sulphate: It is present in atmospheric precipitation only for about 2mg/L but it is present in groundwater because of the oxidation, precipitation solution and concentration as the water passing through rocks. The sources of this contaminant are sulphur minerals, Sulphides of heavy metals which are of common occurrence in igneous and metamorphic rocks. Sulphate salts are mostly soluble in water and imparts hardness and with a concentration of more than 1000 mg/L, may cause intestinal disorders. In the present findings, the sulphate values ranged between a minimum of 44 mg/L to 84.38 mg/L with a mean of 59.68 mg/ as shown in the table-I and graph-XIII. SO4 2- showed a positive correlation with EC, total alkalinity, total hardness, Mg++, Na+, K+, NO3 - and F-, and negative correlation with TDS, DO, Ca++, pH and Cl- as shown in the table-III All the samples have got the SO4 2- values within the permissible limits of WHO (1993). A similar report in bore well investigation was reported by [11]. |
 |
CONCLUSION |
| In the current investigation, physicochemical parameters are estimated in the groundwater samples of various stations in Chintamani taluk. The study revealed that most of the water samples are not suitable for drinking due to high NO3 - , Total Hardness, and Bicarbonate. As a consequence, the groundwater of this study area needs a suitable treatment before consumption. |
ACKNOWLEDGEMENTS |
| It is our primary duty to sincerely thank our life long encourager’s (parents), Sashidhar and Savitha, Dr. J Sreenivasa Murthy, Principal MES Degree College, Dr. Sheela Menon, HoD. Department of Zoology, MES Degree College, Dr .T. Usharani HoD, Department of Chemistry, MES Degree College, Engineering Chemistry Lab, Atria Institute of Technology, Chemistry lab MES Degree College. |
 |