International Journal of Innovative Research in Science, Engineering and Technology
ISSN ONLINE(2319-8753)PRINT(2347-6710)
ISSN ONLINE(2319-8753)PRINT(2347-6710)
Lawrence T.1, Gunasekaran S.2
|
| Related article at Pubmed, Scholar Google |
Visit for more related articles at International Journal of Innovative Research in Science, Engineering and Technology
In the present study, an attempt has been made to prepare an extract by the methanol from Toddalia asiatica leaf and it contains alkaloids. The molecular structure, functional groups, chemical bonds, etc has been analyzed with the help of IR, UV and MS spectrum. The Gaussian software has been used to estimate the theoretical values of vibrational frequencies of IR spectrum and for obtaining possible structure of the compound. The theoretical values are in good agreement with the experimental values and the structure of the alkaloid is confirmed
Keywords |
| Isolation, IR, UV, MS spectrum analysis, Toddaquinoline alkaloid, |
INTRODUCTION |
| Nature is the source of medicinal agents for the impressive number of modern drugs for many years. It has been observed that the Toddalia asiatica, a Todda’s (Tribal) medicinal plant contains flavonoids, steroids, alkaloids etc., [1] and are using by Toddas, a tribal people living in the Nilgiris district, Tamilnadu, India. The extract of Toddalia asiatica plant leaf has been used by them as medicine for fever, wounds, pains etc., [2]. Chen et.al. [3] have reported the isolation and characterization of an unusual alkaloid toddaquinoline [4], found in the root bark of Toddalia asiatica. Further David et al. [5] have synthesized toddaquinoline by the key step of Cobalt (I) mediated radial cyclisation to a pyridine and achieved. The root bark of Toddalia asiatica a new benzo[h]quinoline alkaloid synthesized [6]. Toddalia asiatica led to the isolation of 30 compounds, including coumarins, benzoquinoline, etc [7]. Toddalia asiatica is used as a folk medicine in Asia relieves pain and stasis [8] .The chemical composition of the Toddalia asiatica has been widely studied and identified the toddaquinoline [9]. The aqueous solution of the Toddalia asiatica contains gum and mucilage whereas the methanol extract contains alkaloid, carbohydrates, tannins and falavonoids, etc.,[10]. In the present study, an attempt has been made to compare the experimental values with the theoretical values of vibrational frequencies of IR spectrum of the alkaloid toddaquinoline, evaluated using Gaussian Software and molecular structure by MS spectrum. |
MATERIALS AND METHODS |
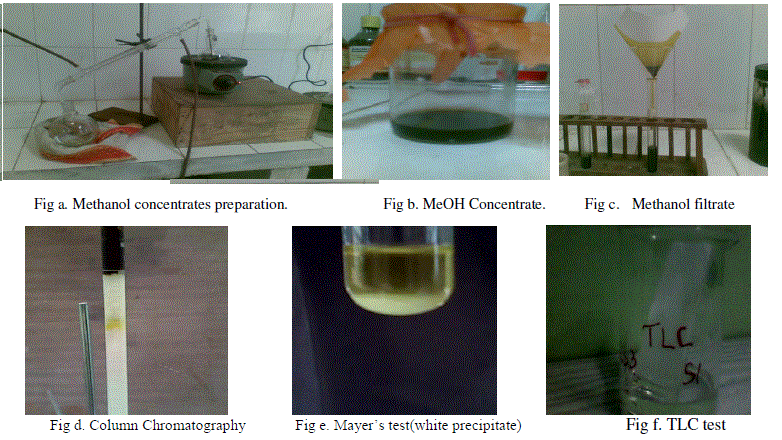
| Plant collection: Toddalia asiatica is found in the Nilgiris district, Tamilnadu, India at the altitude around 2200 meter from MSL. Small spicks are all over the stem and bottom of leaf. In this plant, an alkaloid rich in bark and stem [11]. Around 5kg of healthy, wet leaf free from dust etc. were collected and dried in shadow. Sample Preparation: The dried leaves of 1.5kg mechanically crushed and soak in n-Hexane for 72 hours. n-Hexane dissolves wax like moisture compounds of leaf [12] Then the leaves are filtered from n-Hexane and dried. Again leaf soaked in an Acetone for 72 hours. Acetone has more polarity then n-Hexane. Therefore most of the moistures like tar were dissolves in Acetone. Finally the leaf filtered and dried completely from acetone then soaked into methanol in a glass container for 72 hours and then the methanol extract alone collected in glass container. The methanol extract prepared for two more times from the leaf. Methanol extract taken into 500ml round bottom flask. A Condenser and mantel arrangement are used for evaporating the methanol from extract up to its 1/6th volume and it is called methanol concentrate [Fig a]. Again the leaf powder soaked in methanol, the above process repeated for 4 times for preparing methanol concentrate, without drying the leaf. |
| This methanol concentrate contains moisture, flavonoids, steroids etc. Hence it is washed by n-Hexane [Fig b]. The washed methanol concentrate is filter many times by No.1 waterman paper for removing the sediments, washed moistures and leaf powder. Then it is called filtrate [Fig c]. The filtrate allows drying and adding methanol to it and is called methanol filtrate. |
 |
| Dragendorff’s reagent [14] , Dragen dorff’s reagent are used for alkaloid test. Few drops of Mayer’s reagent added with filtrate, while precipitate is obtained. Brown precipitate is obtained after the addition of few drops of Dragendorff’s reagent [15]. It proves that the presence of alkaloid. |
 |
ALKALOID SEPARATION BY COLUMN CHROMATOGRAPHY METHOD |
| Column chromatography [16] is the best and quick physical method for separation of individuals from mixtures [Fig d]. This is a separation, which works well for tropane alkaloids such as atropine, cocaine, and scopolamine. The methanol extract is fractionated by column chromatography on SiO2. This separates lipids and terpenes from the crude alkaloid fraction. The alkaloid fraction is chromatographed (SiO2; CHCl3: MeOH = 10:1) to isolate the pure alkaloids. The column was packed by using the suspension of silica gel in n-Hexane. Then the different column elutes were collected and kept in separate containers and are named as S1/C1 ,S1/C2 , S1/C3 and S3/C4. Again SI/C1, SI/C2, SI/C3 and S3/C4 etc. under go the alkaloid test with Mayer’s regent. SI/C3 shows white precipitate, it proves presents of alkaloid [Fig e]. n-Hexane evaporated out and then sample dissolves in pure n-Hexane. It is collected in sample holder and named as SI/C3. Purity test. SI/3 purification is confirmed by Thin Layer Chromatography (TLC) [17] and paper chromatography (PLC). TLC prepared by a small glass slab coated with SiO2 and a small dot of SI/C3 kept just bellow the centre of the glass slab and placed slanting position in 100ml glass container with 20ml of n-Hexane. The glass container closed and monitored. After 8 hours the dot moves upward and no further dots of SI/C3 found [Fig f]. It shows no other moisture with SI/C3. PLC is prepared as a small dot of the SI/C3 is diffused near the center of small rectangular #1 waterman paper vertically hangover in 100ml glass container with 20ml of n-Hexane. |
EXPERIMENTAL SECTION |
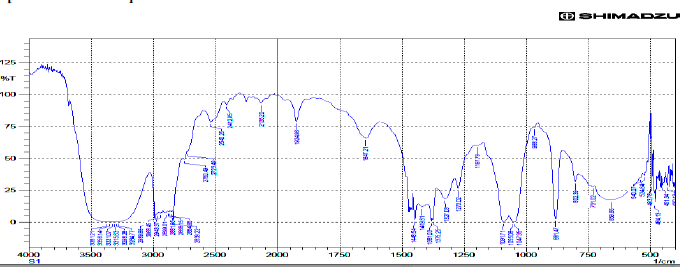
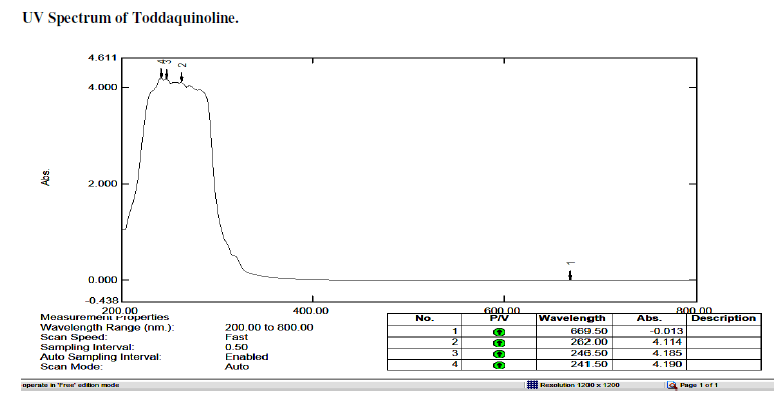
| SHIMADZU spectrometer is used for recording the IR and UV spectrum. IR spectra of liquid base samples were also recorded by the SHIMADZU. Fourier transforms infrared spectrometer using NaCl cells. JEOL GC Mate instrument is used for recorded Mass Spectrum [18-19]. |
RESULT AND DISCUSSION |
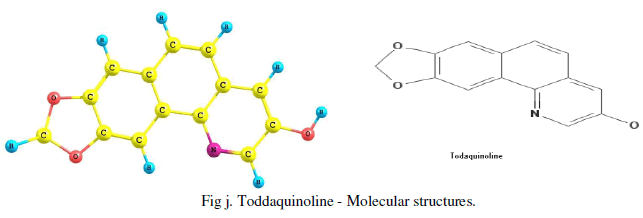
| The Gaussian software (v3) is used for obtaining IR, UV spectrum and most possible molecular 3D structure of the given IUPAC named compound or molecular diagram. The IUPAC name of Toddaquinoline is obtained by Chemdool software .The IUPAC name of the toddaquinoline is 13.15-Dioxa-3-azatetracyclo [8.7.0.0.0] heptadeca-1(17), 2, 4, 6, 8, 10, 12(16) - heptaen-5-ol. |
| Theoretical values are compared with experimental result and are listed bellow. |
| Toddaquinoline: IR(cm-1) υmax , OH-H bonded 3500,3200, N-H Stretch-3381,3356,3331,3315,3298,3284 (secondary amines). C-H Stretch-2989,2968,2943,2899,2881,2888, 2864, 2839. C-OH Stretch -2750.C=C Stretch-1647, C-C Stretch in ring aromatic-1448,1419. C-N Stretch-1327, 1091, 1055, 1047.C-H loop aromatic-881,802,731. UV - λ, 265.5,253.5,239.5 |
| Gaussian software output: IR(cm-1) υmax , O-H Stretch 3817, C-H Stretch 3170, 3162, 3193, 3175, 3193,3175, 3216 ,C-H Stretch 3250, C-H Stretch 3081,3033, 3081, 3033, N-C Stretch 1664,1482 , 1387. C-C Stretch 1677 ,1461, 1686 ,1516,1413, 1686, 1664 ,1550 ,1387 ,1177 ,1004 ,N-C Stretch 1305 ,1225, C-C Stretch 1640, 1640,1567, 1664 , 1334 1295 , 1413, 1461,1305 ,O-C Stretch 1516,1295,1115, 841, 1072,995, 983, C-C-C Bending 855, 610, C-O-C Bending 1072, 983,746, H-O-C Bending 1305,1225, 1213, 1177, H-C-N Bending 1431,1334,H-C-C Bending 1664,1225,1213,1207, H-C-C Bending 1334,1207, 1461,1305,1225,1153, 1516,1251,1213, C-N-C Bending 486, 417, C-C-C Bending 704,506, C-C-N Bending 1004, Bending O-C-C506. |
SPECTRAL GRAPHS |
| IR Spectrum of Toddaquinoline. |
 |
 |
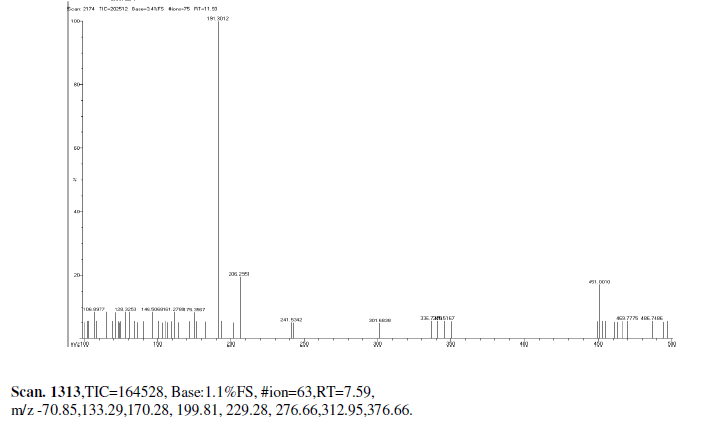
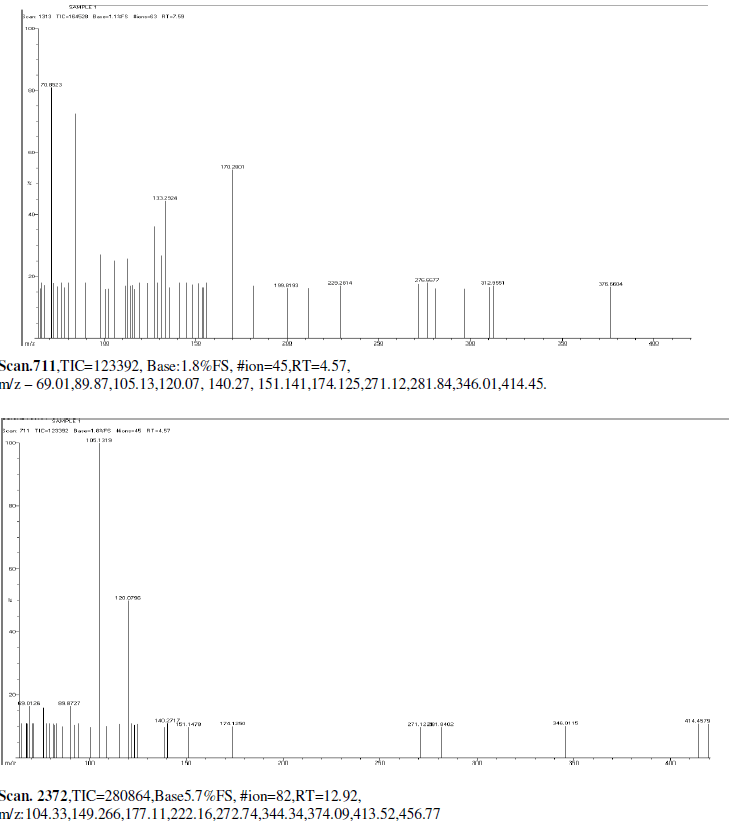
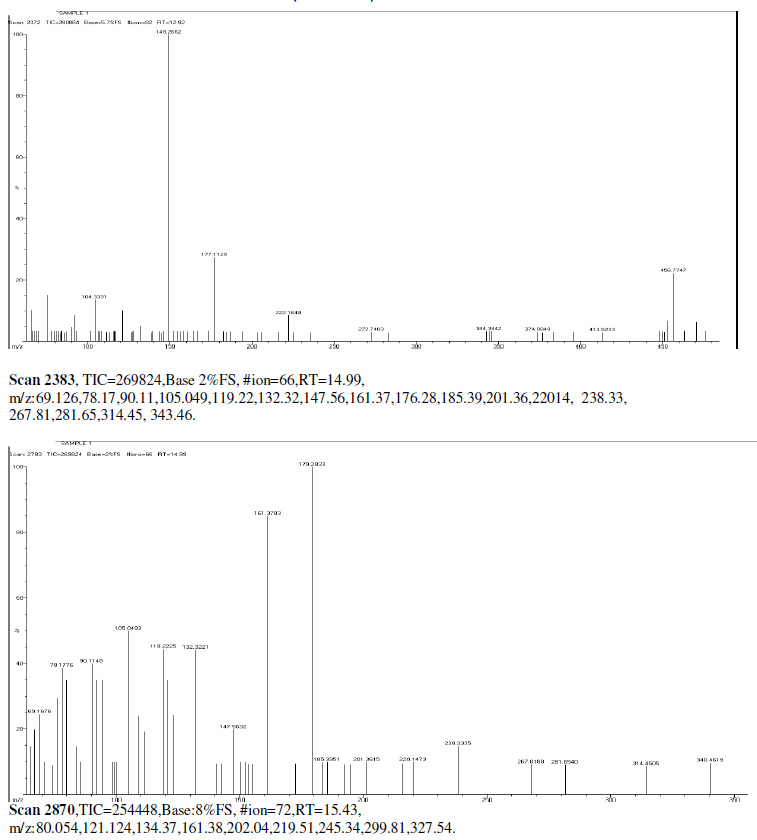
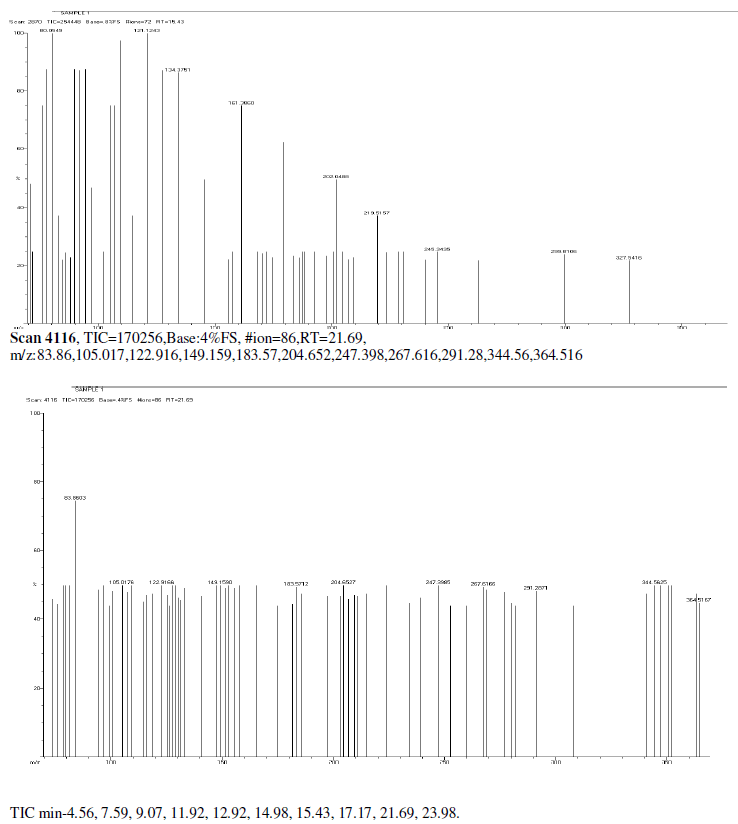
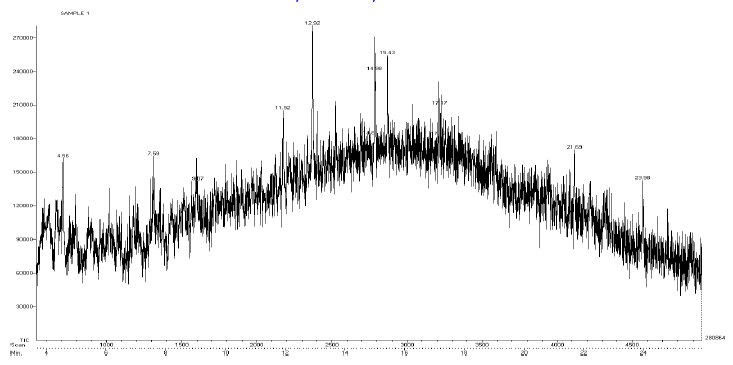
| Mass Spectrum Mass Spectral data. m/z scan.2174, TIC=202512, Base:3.4FS, #ion=75, RT=11.93, m/z. 106.89,128.32,146.50,161.278,175.3567,191.3012,206.26,241.53,301.68,336.73,340.51, 451.00, 469.77, 468.74. |
 |
 |
 |
 |
 |
CONCLUSION |
| The experimental values of IR, UV and MS are used to predict the molecular structure, atomic bond, possible molecular functional groups, etc., for the confirmation of toddaquinoline alkaloid present in the Toddalia asiatica plant and confirmed. Molecular structure is found by Gaussian software and IUPAC name by the Chemdoole software and reported as [Fig j]. |
 |
References |
|