ISSN ONLINE(2319-8753)PRINT(2347-6710)
ISSN ONLINE(2319-8753)PRINT(2347-6710)
Manju Meena1, Bharat Singh Meena1, Uttra Chandrawat1, Ashu Rani2
|
| Related article at Pubmed, Scholar Google |
Visit for more related articles at International Journal of Innovative Research in Science, Engineering and Technology
The present study is an effort to investigate physical and chemical parameters like pH, conductivity and concentration of Ca, Mg, Cu, Cd, Pb, Zn, Fe in samples of wet precipitation in order to evaluate the influence of the main anthropogenic sources in Kota city at various sampling sites situated in five zones while considering Kota Super Thermal Power Station as point source. A total of 90 event-based wet precipitation samples were collected from January to December, 2011. Samples were analyzed for concentrations of Fe, Zn, Cu, Cd, Mg and Pb using Atomic Absorption Spectrophotometer (Shimadzu-6300). Ca has been determined using Flame Photometer (Systronics -128). The average pH at these zones varied from 6.54 to 7.44, covering all samples having alkaline range. On the basis of enrichment factor, Pearson correlation coefficient and principal component analysis, it is concluded that Ca, Mg and Fe are originated from a common source that is soil while prime source of Cu, Cd and Zn is combustion products at Kota Super Thermal Power Station. A significant EF value of Pb in the studied zones indicated its anthropogenic origin
Keywords |
| Wet precipitation, Atomic absorption spectrophotometer, Flame photometer, Enrichment factor, Pearson correlation coefficients, Principal component analysis. |
I. INTRODUCTION |
| Atmospheric emission and scavenging process cycles play important role in regulating cross - domain transfer mechanisms [1]. Atmospheric aerosols emitted from natural and anthropogenic sources are transported, diluted and scavenged by dry and wet removal processes or by complex biogeochemical mechanism [2]. Human activity produces air particulate matter as a result of industrial processes, fossil fuel combustion, mining, motor vehicles and waste incineration processes [3]. The assessment of aerosol chemical composition as a function of time and size is necessary to understand atmospheric processes such as cloud formation, radiation transfer, precipitation chemistry and dry deposition, etc. [4]. |
| Over the last few decades, intensive monitoring programs of heavy metals in precipitation have been carried out worldwide, which are mainly focused on the chemical characteristics, deposition fluxes and long-term temporal trends [5]-[9]. According to these studies, the loadings and sources of heavy metals in precipitation have great spatial variability over different locations, which is mainly caused by different meteorological conditions (prevailing wind directions and type, frequency and amount of precipitation) and the emission patterns of pollutants (emission sources, distance from emission sources and the sampling sites). Therefore, more in-depth studies, specially on the regional level, of trace metal pollution in the air, are needed for the assessment of their impact on ecosystems [10]-[11]. |
| The most important of these features are the inverse relationship between concentration and intensity of rainfall and a decrease in concentration during the initial stages of precipitation and an increase or even no variation during the final stages [12]. The mass size distribution of metals in particulate matter and the solubility of the later strongly influenced the atmospheric reactivity and residence time. The physical properties of atmospheric aerosol vary greatly according to their size [13]. |
| Environmental risk assessment of metals associated with air particulates has usually been based on the total concentrations of the metals. This can provide information on the degree of contamination, however, the mobility of metals in the environment depends not only on their total concentration but also on the associations and forms present in the solid phase in which they are bound. These forms include the following broad categories: soluble; exchangeable; carbonate- bound; Fe and Mn oxide- bound; organic matter- bound and residual. Understanding the mode of occurrence of metals in air particulates is essential for the environmental assessment of this form of contamination [14]. |
| Because of presence of Kota Super Thermal Power Station (KSTPS), a major coal based thermal power plant, where approximately 3000 metric tonne fly ash per day is produced, the study of concentrations of heavy metal in atmospheric precipitation in and around Kota city is preliminarily required to measure heavy metal toxicity. Nevertheless, few large scale industries including DCM Shriram Consolidated Limited (DSCL), Multimetals Limited, Samtel Glass Limited, Chambal Fertilizers and Chemicals Limited (CFCL), Shriram Fertilizers and Metal India, Shriram Rayons and a number of Kota stone cutting polishing units further enhance the heavy metal burden in the atmosphere. |
| The present study is an attempt to study wet precipitation at number of sites in and around the city Kota under the influence of Kota Thermal Power Plant Station and several large & small scale industries and aims at identifying physical and chemical parameters (pH, conductance, metals of crustal origin and heavy metals of anthropogenic origin ) mainly in rain water samples collected during January to December, 2011 in order to evaluate the influence of the main anthropogenic activities in the area during the meteorological events. |
II.BACKGROUND TO THE STUDY AREA |
| Kota is one of the major industrial city of Rajasthan state in India. It is situated 25011 N and 75051 E on the eastern bank of river Chambal in the southern part of Rajasthan with an elevation of 271 meters (889 feet) above sea level on the south- east of Aravali ranges. The total geographical area of the district is 5,21,133 hectares as per land. According to the 2011 census Kota district has a population of 19,50,491. Kota has a semi arid climate with temperature ranging from 80C – 470C having long summers up to six months. The monsoon season follows with comparatively lower temperatures, but higher humidity and frequent downpours. The average annual rainfall is about 885.6 mm. Many large and small scale industries are present due to availability of river water and power. Kota district is a power production centre of the country where coal based KSTPS is situated. A popular cost effective building stone i.e. Kota stone is being excavated, cut to various sizes and polished in more than 200 units generating huge amount of slurry waste containing mainly CaO, MgO and SiO2. |
| Kota is one of the major industrial city of Rajasthan state in India. It is situated 25011 N and 75051 E on the eastern bank of river Chambal in the southern part of Rajasthan with an elevation of 271 meters (889 feet) above sea level on the south- east of Aravali ranges. The total geographical area of the district is 5,21,133 hectares as per land. According to the 2011 census Kota district has a population of 19,50,491. Kota has a semi arid climate with temperature ranging from 80C – 470C having long summers up to six months. The monsoon season follows with comparatively lower temperatures, but higher humidity and frequent downpours. The average annual rainfall is about 885.6 mm. Many large and small scale industries are present due to availability of river water and power. Kota district is a power production centre of the country where coal based KSTPS is situated. A popular cost effective building stone i.e. Kota stone is being excavated, cut to various sizes and polished in more than 200 units generating huge amount of slurry waste containing mainly CaO, MgO and SiO2. |
| Kota is one of the major industrial city of Rajasthan state in India. It is situated 25011 N and 75051 E on the eastern bank of river Chambal in the southern part of Rajasthan with an elevation of 271 meters (889 feet) above sea level on the south- east of Aravali ranges. The total geographical area of the district is 5,21,133 hectares as per land. According to the 2011 census Kota district has a population of 19,50,491. Kota has a semi arid climate with temperature ranging from 80C – 470C having long summers up to six months. The monsoon season follows with comparatively lower temperatures, but higher humidity and frequent downpours. The average annual rainfall is about 885.6 mm. Many large and small scale industries are present due to availability of river water and power. Kota district is a power production centre of the country where coal based KSTPS is situated. A popular cost effective building stone i.e. Kota stone is being excavated, cut to various sizes and polished in more than 200 units generating huge amount of slurry waste containing mainly CaO, MgO and SiO2. |
III.MATERIALS AND METHODS |
| Sampling Sites: |
 |
 |
 |
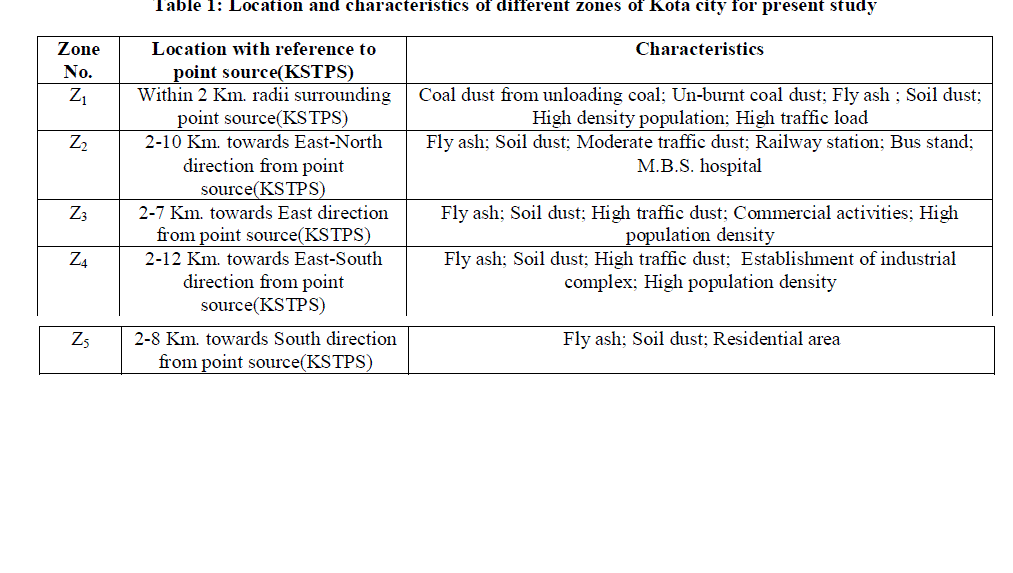
| The sampling sites for atmospheric precipitation were chosen with the help of cartographic charts, field job and GPS (Global Positioning System). The choice of the sampling sites followed some criteria laid by ASTM D 5111 Standards [15]. These criteria were: I) distance from polluting sources (approximately a radius of 12 km from KSTPS); ii) predominant wind direction; iii) the distance from obstacles that could interfere in sampling (twice the height of obstacles); and iv) logistics (security, access, electric power supply).The entire city area was divided into five zones (Fig.1) and monitoring sites were chosen for collection of rain water samples. The location with respect to the point source KSTPS of emissions and possible source of heavy metal emission in the zones are presented in Table 1. |
| Sample Collection and Analysis: |
| A total of 90 rainwater samples covering every rain event have been collected, during monitoring period i.e., from January to December, 2011, using a polypropylene funnel of 20 cm diameter fitted onto 3 L capacity polyethylene bottle at all the sampling stations in each zone. The containers were washed with milli-Q water (conductivity < 2 μS. cm-1) and were fixed at about 6 m above the ground level to avoid surface contamination. To avoid dry deposition, the containers were deployed for sampling at the onset of rain and retrieved soon after the rain [1]. Immediately after collection, the pH and conductivity of rain water samples were measured using Eutech- pH/ Ion meter (EC- pH 6500 42S Model) and conductivity meter (HANNA Model). Thereafter, the rain water samples were filtered and then acidified to pH < 2 with ultra – pure HNO3. |
| The concentrations of 6 metals (Fe, Zn, Cu, Cd, Mg and Pb) were measured by Direct Air – Acetylene Flame method (Atomic Absorption Spectrophotometer - Shimadzu-6300). The Ca metal concentration was determined using Flame Photometer (Systronics -128). Certified standard solutions (CertiPURïÃâ¬Ãª - MERCK) were used for calibrating the instruments. Blanks, quality control standards and stand reference materials were inserted during the analytical measurement to detect contamination and drift. The elemental concentrations of the blanks were < 1% of the mean analyte concentration for all metals and the precision (RSD) of the control standards and replicates were generally lower than 5%. The recovery rates for the metals in the standard material ranged from 96% to 99% [16]. Detection limits were: 0.02 mg/L for Fe ; 0.005 mg/L for Zn ; 0.01 mg/L for Cu ; 0.002 mg/L for Cd ; 0.0005 mg/L for Mg ; 0.05 mg/L for Pb; 0.06 mg/L for Ca. |
IV.RESULT AND DISCUSSION |
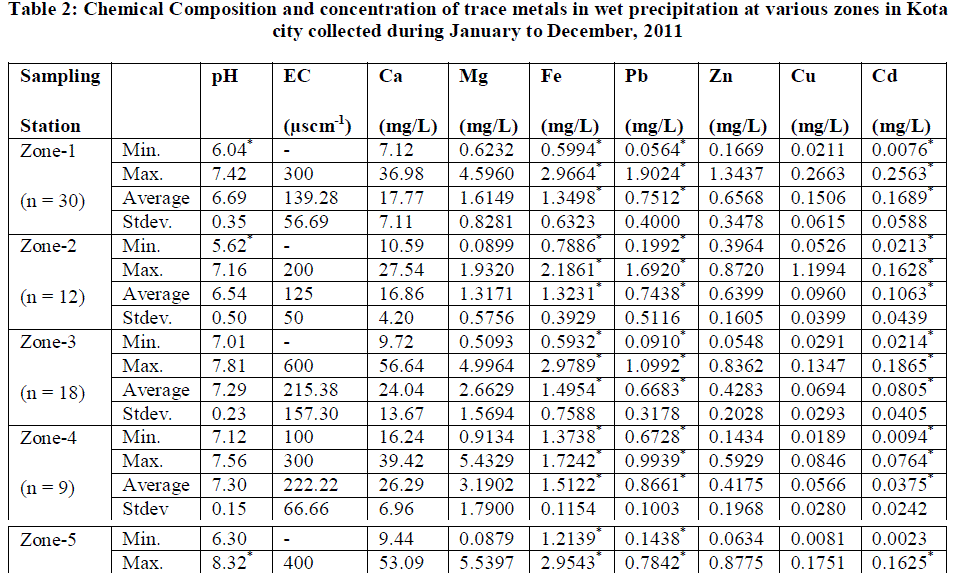
| Results of pH, EC and concentrations of various major and heavy metals in atmospheric wet precipitation samples collected at different sampling sites at Kota city are given in Table 2. The average and standard deviation values show that the variability of metals in wet precipitation were considerably very high. This variability can be explained by distance of sources of emission from the sampling location and level of emissions. |
| Variation of pH and Conductivity: |
| Table 2 indicates the average pH of rainwater samples at five zones, representing different surroundings, varied from 6.54 to 7.44. Minimum pH (5.62) has been noticed at zone 2 while maximum pH (8.32) at zone 5. The relatively higher pH values have been attributed to the dominance of crustal components particularly carbonates and bicarbonates of Ca2+ which buffer the acidity of sulphate and nitrate [17]-[18]. However, few samples of wet precipitation showed lower pH during rain events indicating the reduction of buffering action of rainwater to a minimum level by washing out the dust particles from the atmosphere [19]. |
| The average conductivity of rainwater varied between 125.0 μscm-1 to 225.0 μscm-1, the values being highest at zone 5 and lowest at zone 2. |
 |
 |
| Metal Analysis: |
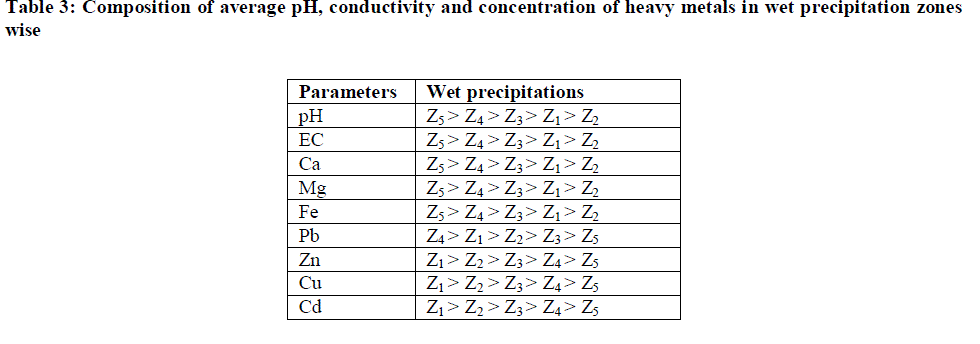
| Table II indicates the major and heavy metals concentration in rainwater, the trend appeared as Ca > Mg > Fe > Pb > Zn > Cd > Cu. Metal concentrations in rainwater ranged from 16.86 - 31.56 mg/L for Ca; 1.3171 - 3.4253 mg/L for Mg; 0.0399 - 0.1506 mg/L for Cu; 0.0321 - 0.1689 mg/L for Cd; 1.3231 – 1.9186 mg/L for Fe; 0.4088 - 0.6568 mg/L for Zn and 0.6474 - 0.8661 mg/L for Pb. The order of annual average values of various parameters has been presented in Table 3. |
| Heavy metal pollution due to Zn, Cu and Cd is found to be highest in Zone 1 which is within 2 km radii surrounding the point source KSTPS. Wind blow from KSTPS towards this zone encourages the worrying level of heavy metals in this region through fly ash generated during coal-combustion activities at KSTPS which normally contains SiO2- 58%, Al2O3- 19%, Fe2O3- 8%, CaO- 0.6%, MgO- 0.6%, TiO2- 1.3%, Na2O- 3.74%, K2O- 2.18%, PbO-0.008%, CuO-0.9%, ZnO-0.9% and other elements- 3.0% [20]. |
| Despite the use of lead free petrol, high concentration of Pb at zone 4 could be due to Pb particles in street dust accumulated for a long time [19] and the presence of railway sub - station, vehicle repairing market and a metal processing industry. Concentration levels of metals of crustal origin such as Ca, Mg and Fe are found to be highest in zone 5 where various mining activities are being carried out. This zone has been observed with lowest concentration of Zn, Cu, Cd and Pb. This zone is facing low traffic load and has also been blessed with wind blow in opposite direction to the KSTPS thereby facing least harmful effect of metal toxicity from point source. |
 |
| Enrichment Factor: |
| This study uses an enrichment factor (EF) analysis that incorporates information pertaining to reference element, indicative of a specific source, to determine the sources of the elements (crustal and non-crustal). Ca is normally used as the crustal indicator element. [21].The Enrichment Factor (EF) was calculated using widely accepted method [22]. |
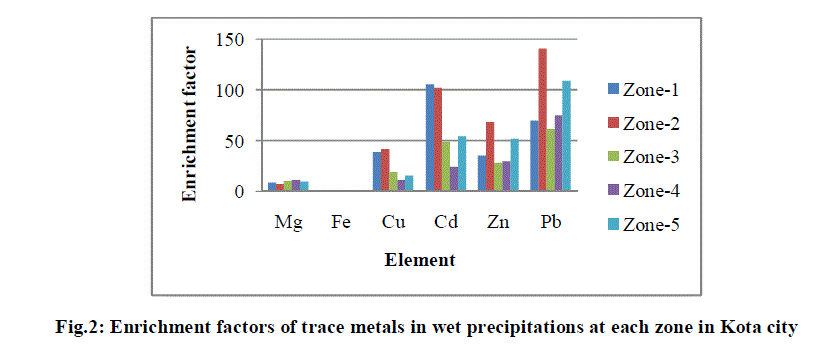 |
| It is assumed that at the enrichment coefficient values (EF) below 2, there is no anthropogenic pollution, the values of EF between 2 to 5 indicate temperate pollution, from 5 to 20 significant pollution and over 20 indicate high heavy metal enrichment from anthropogenic sources [23]. EF values for all analysed metals in wet precipitation samples are shown in Fig. 2. |
| The higher EF values shown in Fig. 2 suggest a substantial point source input for Cu, Cd and Zn as all these metals are components of fly ash generated at KSTPS. Pb is still persistent in road dust from earlier vehicular emission before ban of leaded gasoline because of its long residence time in the environment besides coal burning power plant. |
| The solubility of anthropogenic metals agrees with that reported in various studies [24]-[26], in which the majority classifies Zn as the most soluble. Other metals like Cu and Pb, however, are reported to show variable solubility, either high or moderate, and authors refer to a variety of influencing conditions, as pH of the rain and the type of particle these metals are associated to in the atmosphere [27]-[28]. However, highly soluble metals are not significantly affected by the pH, because they usually may be soluble in water at all pH [29]. |
| Fe is originated from the soil dust, and show low solubility. Fe is mainly introduced into the atmospheric aqueous phase by influence of particulate re-suspension of soil particles. Fe content is present in atmospheric particulate sample in the form of various oxides (goethite, hematite, magnetite etc.). While significant EF value for Mg is mainly due to its being a constituent part of fly ash generated at point source and partly due to lime stone mining activities carried out at study area. |
| Correlation Analysis: |
 |
 |
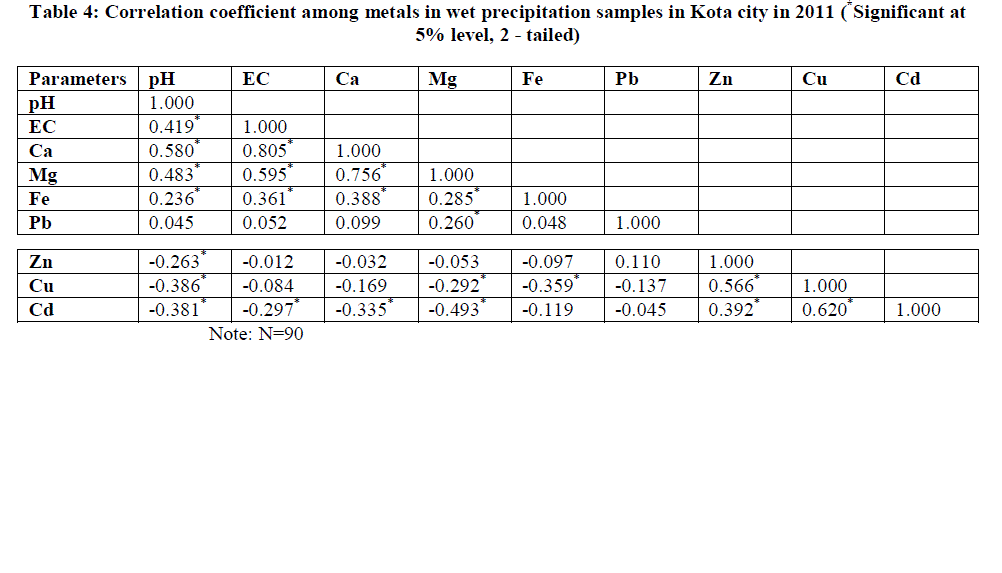
| The Pearson correlation coefficient (r) was calculated from the elemental concentration in order to predict the possibility of a common source (Table 4). Significant positive correlation was found between pH and EC (r = 0.419), pH and Ca ( r = 0.580 ), pH and Mg ( r = 0.483), EC and Ca (r = 0.805), EC and Mg (r = 0.595), EC and Fe (r = 0.361) indicating the influence of crustal aerosols. Significant effect of crustal aerosols in neutralizing rain water acidity has been observed at Kota city. Significant positive correlations between Mg and Ca (r = 0.756), Fe and Ca (r = 0.388), Fe and Mg (r = 0.285) has been found which may indicate that these metals have a common source, possibly natural soil. Similarly, significant positive correlation between Zn and Cu (r = 0.566), Zn and Cd (r = 0.392), Cu and Cd (r = 0.620) indicated common source of their emission. The significant positive correlation of Cu, Cd and Zn confirm that major contribution of these heavy metals in atmosphere is from fly ash generated during coal combustion activities at KSTPS and partly due to other industrial activities carried out at different parts of study area. On the other hand, metal pairs such as Pb and Cu, Pb and Cd showed negative correlations indicating their independent and site specific origin. |
| Source Identification Using Principal Component Analysis: |
 |
| The results of principal component analysis (PCA) showed that only two eigenvalues were > 1 which explains over 60.60% of variance (Fig. 3). Studies have indicated that PCA can effectively be used in interpretation of rain water composition data [30]-[31]. In the present study, the results in rotated component matrix (Table 5) showed that all the seven metal species analyzed are explained by two factors (varimax factors 1, 2). The first factor (VF 1), which explained over 30.49% variance, showed high loading of the heavy metals such as Zn, Cu and Cd indicating the influence of anthropogenic activities mainly coal combustion. VF 2 that accounted for 30.11% of the layout variance showed high loading of Ca and Mg indicating the influence of crust aerosols. |
V. CONCLUSION |
| The average pH of rain water samples at various sampling sites situated in five different zones were in the range of 6.54 to 7.44. The concentrations of studied heavy metals at zones located in closer vicinity of point source of contamination i.e. KSTPS and other industrial activities were high. One plausible reason for alarming concentration of Pb exceeding WHO standard limits at all studied zones might be due to Pb particles in street dust accumulated from earlier vehicular exhaust for a long time due to its higher residence time in environment. |
| The EF values and Pearson correlation method showed that Fe, Ca, Mg have crustal origin while a minor contribution of these metals in the atmosphere is through mainly fly ash. Heavy metals such as Cu, Cd and Zn have common source i.e. fly ash generated during coal combustion activities at KSTPS and other industries. |
| PCA further revealed that there were two major factors accounting 60.60% of the total variance of the precipitation data. They represented anthropogenic (KSTPS) and crust sources of the metal species. |
| As a result of growing environmental consciousness and regulations imposed by Indian government, efforts are being made to adopt adequate measures of delivery and utilization of dry fly ash at KSTPS. Still there is an urgent need to maintain the receptive capacity of the atmosphere by adopting proper abatement procedures by industrial and mining sector for maintaining the healthy environment to breathe. |
ACKNOWLEDGEMENTS |
| The authors are thankful to A. Mukhopadhyay and DST, New Delhi for instrumental support provided through DST – FIST project sanctioned to Govt. College, Kota and University Grants Commission, New Delhi for Minor Research Project sanctioned to Manju Meena for this work. |
References |
|