ISSN ONLINE(2319-8753)PRINT(2347-6710)
ISSN ONLINE(2319-8753)PRINT(2347-6710)
| Bhavani. R Assistant Professor, Department of Civil Engineering, JNTUA College of Engineering, Anantapuram, Andhra Pradesh, India |
| Related article at Pubmed, Scholar Google |
Visit for more related articles at International Journal of Innovative Research in Science, Engineering and Technology
For hydrological analysis, it is necessary to adopt a suitable method to compute the applicable rainfall by considering all the rain gauge stations of the catchment area. For computation of applicable rainfall, important methods being followed are Arithmetic mean method and Theissen polygon method. This paper aims at comparision of applicable rainfall obtained by Arithmetic mean method and Theissen polygon method. Anantapuram district has been selected for the present study and rainfall data for a period of 10 years has been used. It has been concluded that the values of annual rainfall obtained by Arithmetic mean method and Theissen polygon method are not showing much variation for all the considered years.
Keywords |
| Theissen polygon, Annual rainfall, Rain gauge stations, Station rainfall |
INTRODUCTION |
| In general, precipitation refers to all forms of water that reaches the earth from the atmosphere which are rain, snow, drizzle, hail etc. The only form of precipitation in Anantapuram district is rainfall. In order to carry out the hydrological analysis, rainfall occurred over a catchment area is necessary. But, the rainguage stations represent only point rainfall known as station rainfall. So it is necessary to convert the values of station rainfall at various stations into a single applicable value for a catchment area. In the present study, Arithmetic mean method and Theissen polygon method as suggested by Linsely.et.al., are considered to compute the annual rainfall. These two methods are discussed in ‘A’ and ‘B’. A. Arithmetic Mean Method In this method the rainfall values at different rain gauge stations are added and divided by the total number of rain gauge stations to get the mean value of rainfall. Mean rainfall can be obtained using equation (Eq. 1). pm = {(p1+ p2 +p3+………..+ pn)/n} . . . . (Eq. 1) Where pm is the value of mean rainfall over the catchment area. p1, p2, p3,……….., pn are the rainfall values at respective stations in a given period at ‘n’ number of stations within a catchment area. This method gives good results only when rain gauges in the catchment area are uniformly distributed and the individual station rainfall values do not vary widely. However, this method does not take into account the stations outside but near the boundaries of catchment area. B. Theissen Poygon Method Theissen polygon method is one of the interpolation methods with which an accurate estimation of applicable rainfall is possible. This method assigns weight to each gauge station in proportion to the catchment area and the area surrounding the gauge station. The weighted rainfall can be obtained using equation (Eq. 2). Pw = {(p1 x a1) + (p2 x a2) + (p3 x a3) + . . . . + (pn x an)} - (Eq. 2) Where Pw is weighted rainfall |
| a1, a2, . . . . an are the percentage areas influenced by rain gauge stations in the total catchment obtained from Theissen polygons. p1, p2, . . . . pn are the rainfall values of respective rain gauge stations. Since this method provides a weighting factor for each gauge, gives good results even for nonuniform distribution of rain gauges and also when there is a variation in individual station rainfall values. The results obtained by the Theissen polygon method are usually more accurate than those obtained by other methods. According to Diskin the Theissen method is less dependent upon the skill of the analyst and can be easily performed. Fritz R.Fiedler derived weights using Theissen Polygons and available isohyetal information. |
II. STUDY AREA |
| Anantapuram district is lying between 76ï°45ï¢ East longitude and 78ï°30ï¢ East longitude, between 13ï°40ï¢ North latitude and 15ï°15ï¢ North latitude. The geographical area of the district is 19134.772 sq. km. The total number of rain gauge stations existing in the district, are 63. The rainfall data for a period of 10 years from 2003-04 to 2012-13 for all the raingauge stations within the district is collected from the Chief Planning Office, Anantapuram. The rainfall data for the year, X-(X+1) refers to June of ‘X’ year to May of ‘(X+1)’year. |
III. ANALYSIS |
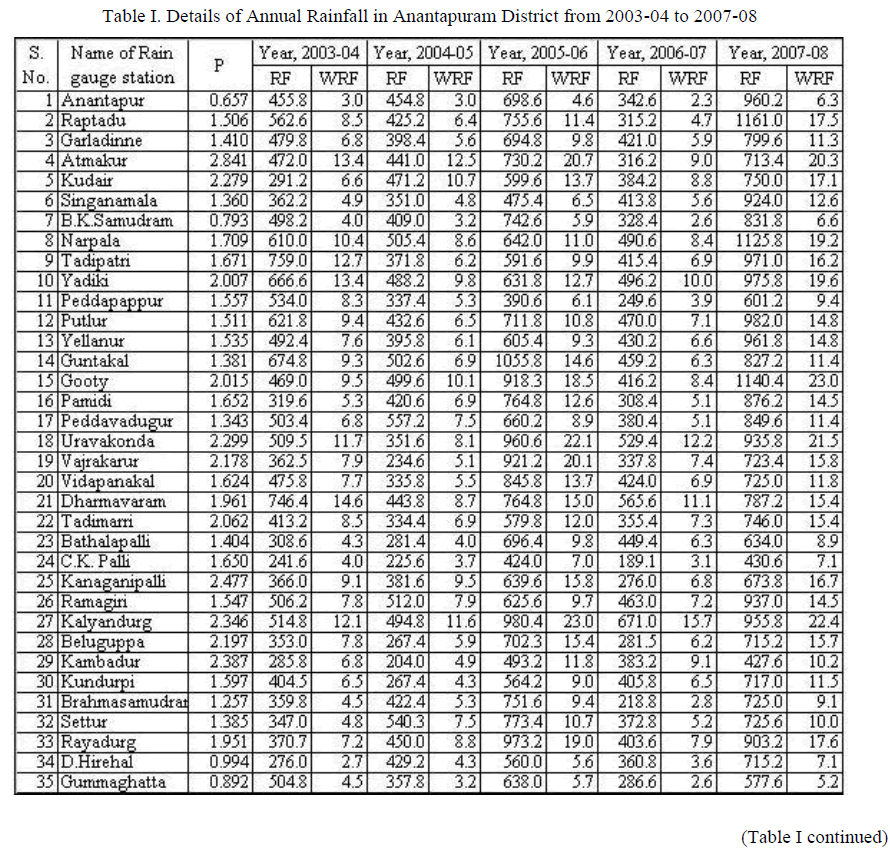
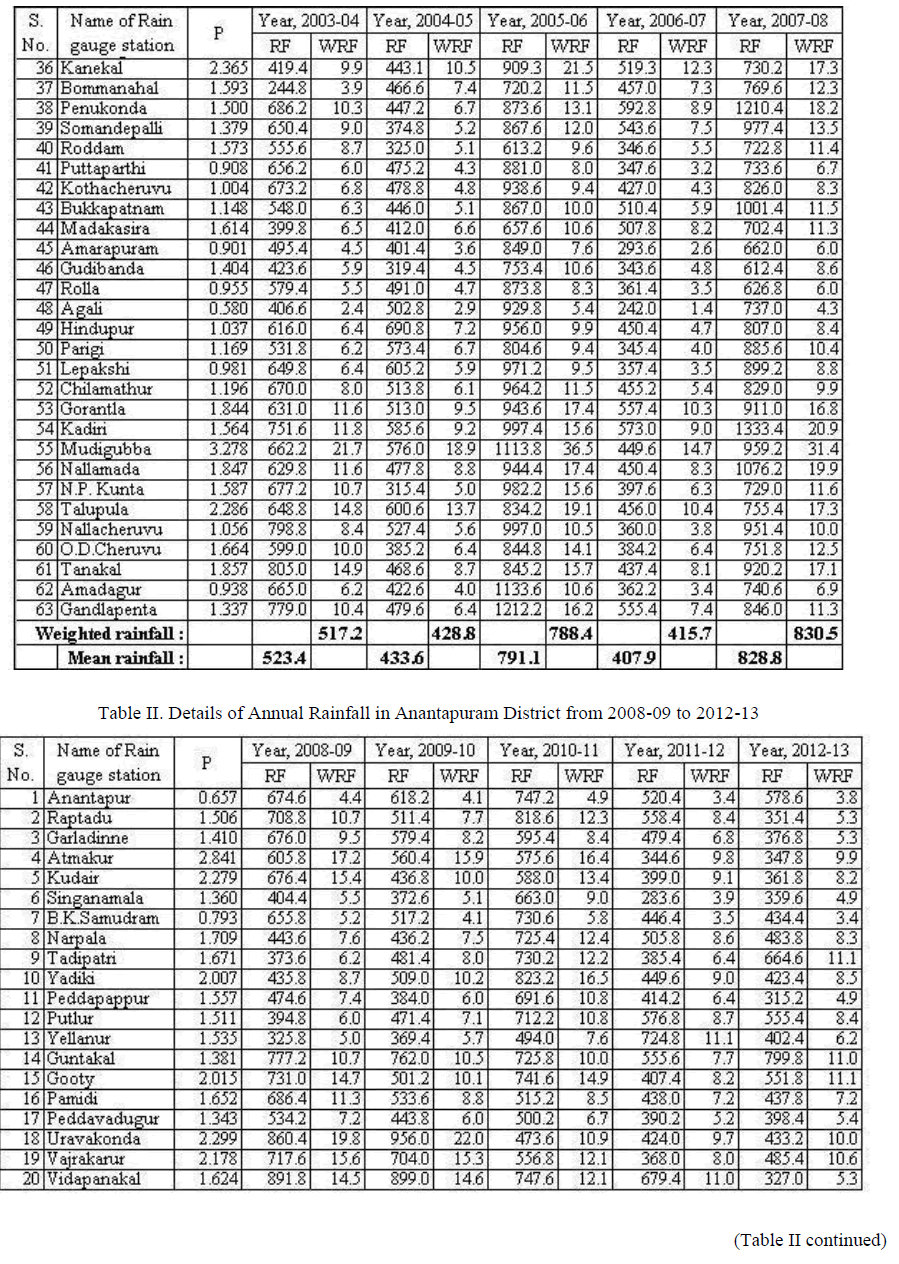
| The annual rainfall for all the 63 raingauge stations has been computed using Arithmetic mean method and Theissen polygon method. To apply the Theissen polygon method, necessary percentage areas influenced by raingauge stations are as given by Bhavani. R. The details are given in Table I and Table II. In tables I and II, following notations are used. P – Percentage Influencing Area RF – Rainfall in mm WRF – Weighted Rainfall in mm |
 |
 |
|
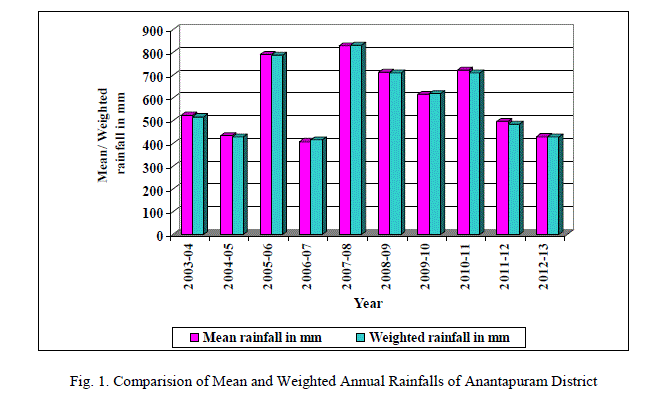
| The calculated values of annual rainfall by Arithmetic mean method and Theissen polygon method are shown in table III. Also the values are graphically represented in figure I. |
 As per the results in table III and figure I, the values of annual rainfall obtained by Arithmetic mean method and Theissen polygon method are not showing much variation for all the considered years. This may be mainly because of the uniform distribution of raingauge locations. The variation is ranging from a minimum of -7.8 mm to a maximum of 13.3 mm which can be considered as insignificant with respect to normal annual rainfall in the district which is about 552 mm. So, it can be concluded that for computation of annual rainfall in Anantapuram district either Arithmetic mean method or Theissen polygon method can be used. As per the results in table III and figure I, the values of annual rainfall obtained by Arithmetic mean method and Theissen polygon method are not showing much variation for all the considered years. This may be mainly because of the uniform distribution of raingauge locations. The variation is ranging from a minimum of -7.8 mm to a maximum of 13.3 mm which can be considered as insignificant with respect to normal annual rainfall in the district which is about 552 mm. So, it can be concluded that for computation of annual rainfall in Anantapuram district either Arithmetic mean method or Theissen polygon method can be used. |
References |
|